. 2021 Mar;591(7849):270-274.
doi: 10.1038/s41586-020-03115-5. Epub 2021 Jan 6.

Activation and disruption of a neural mechanism for novel choice in monkeys

Affiliations

Activation and disruption of a neural mechanism for novel choice in monkeys

Alessandro Bongioanni et al. Nature. 2021 Mar.

Abstract

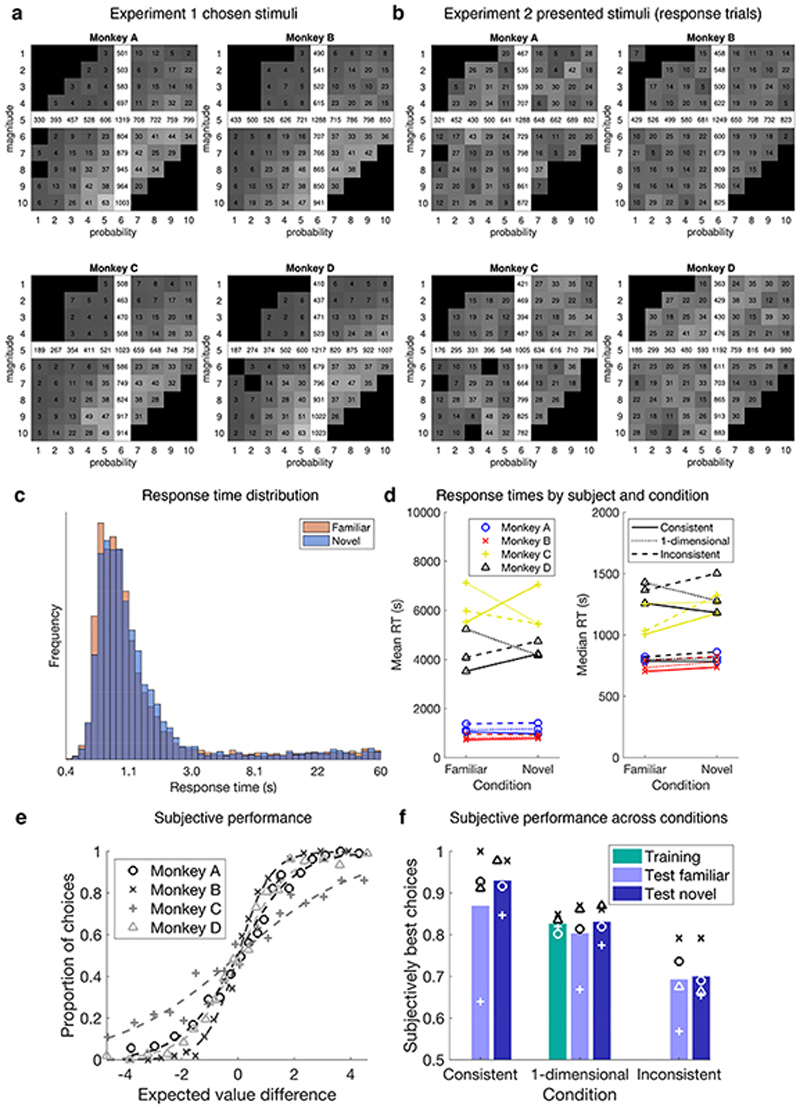
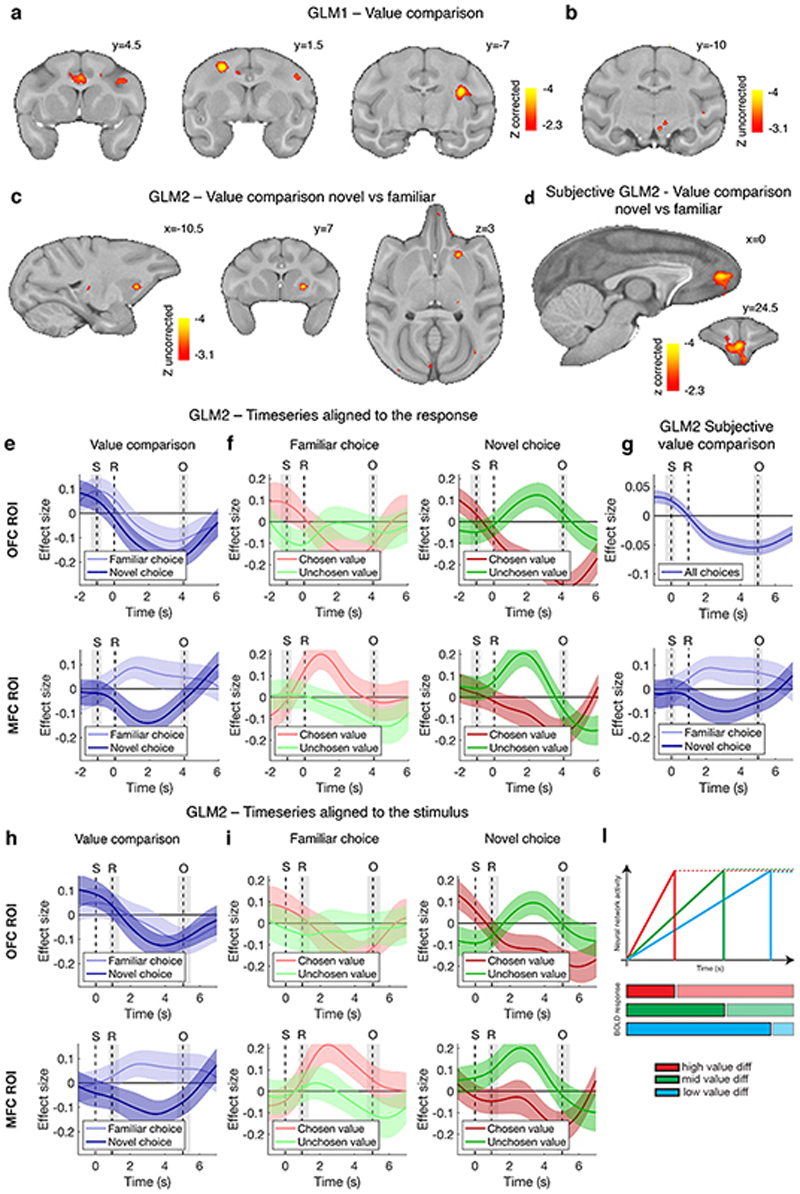
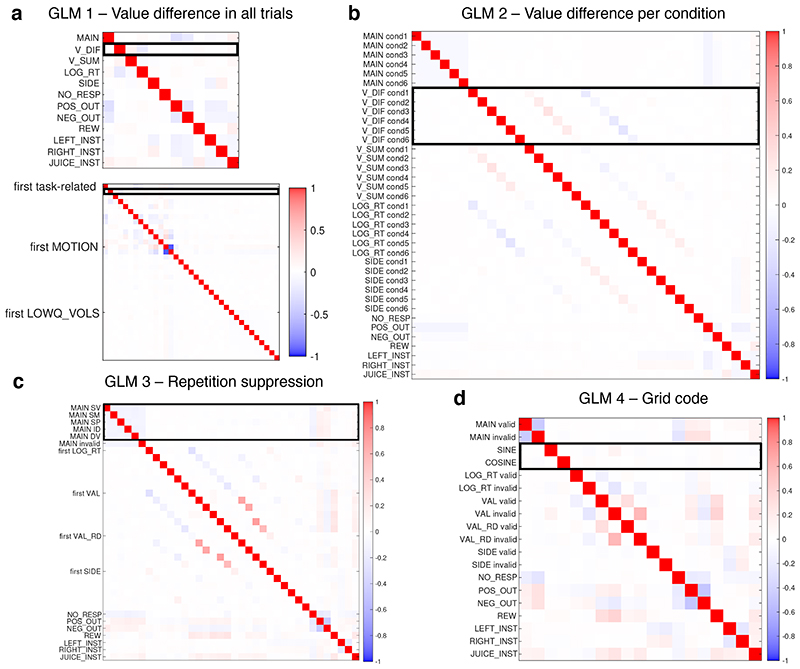
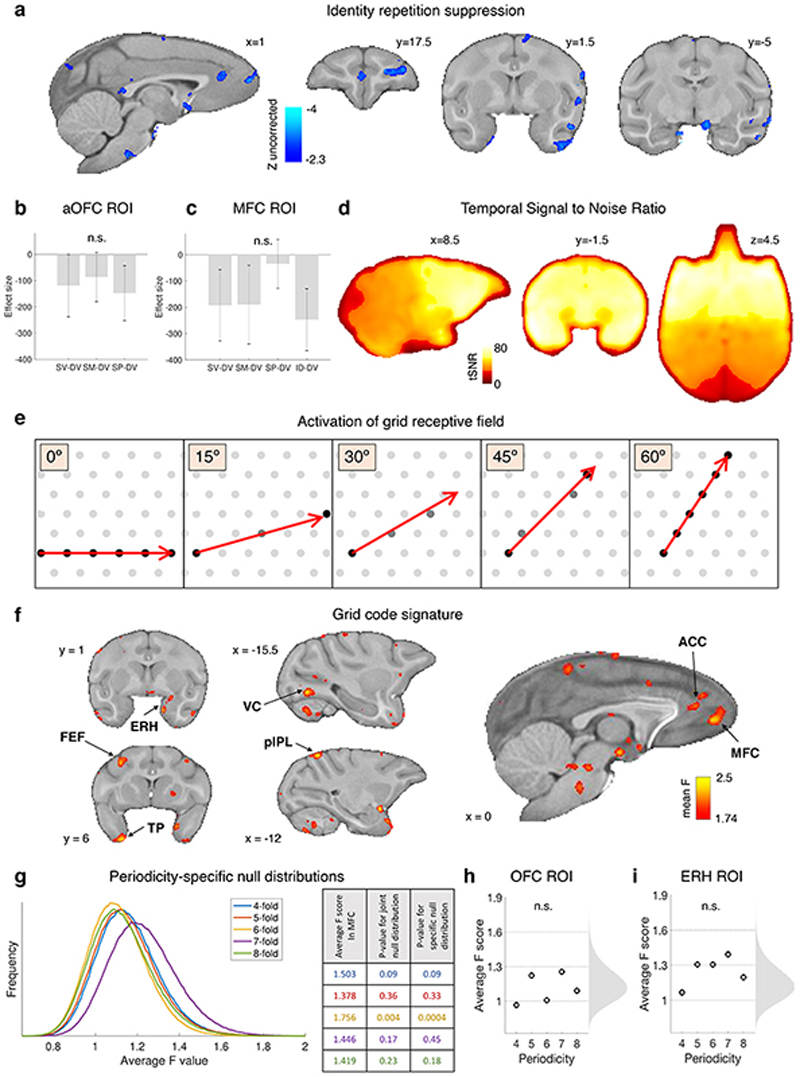
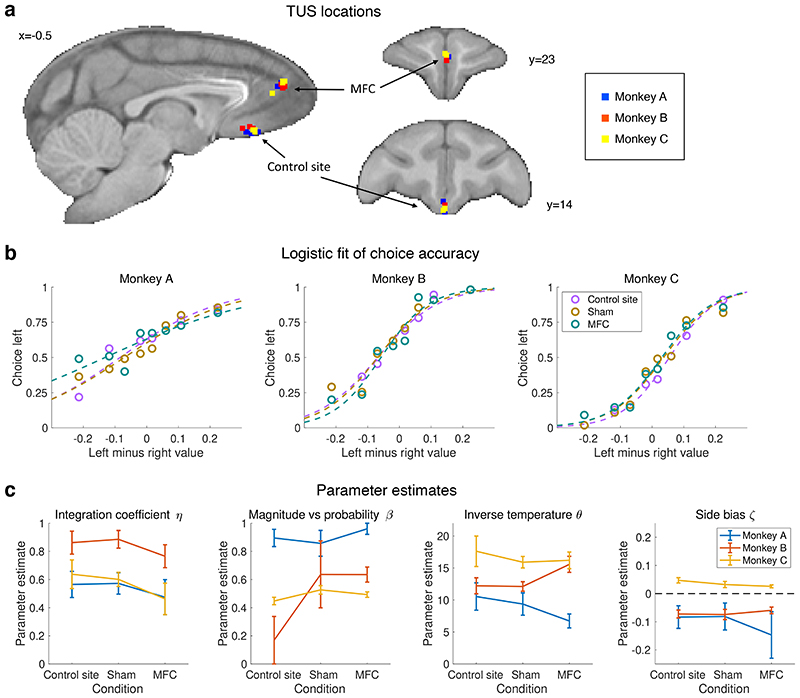
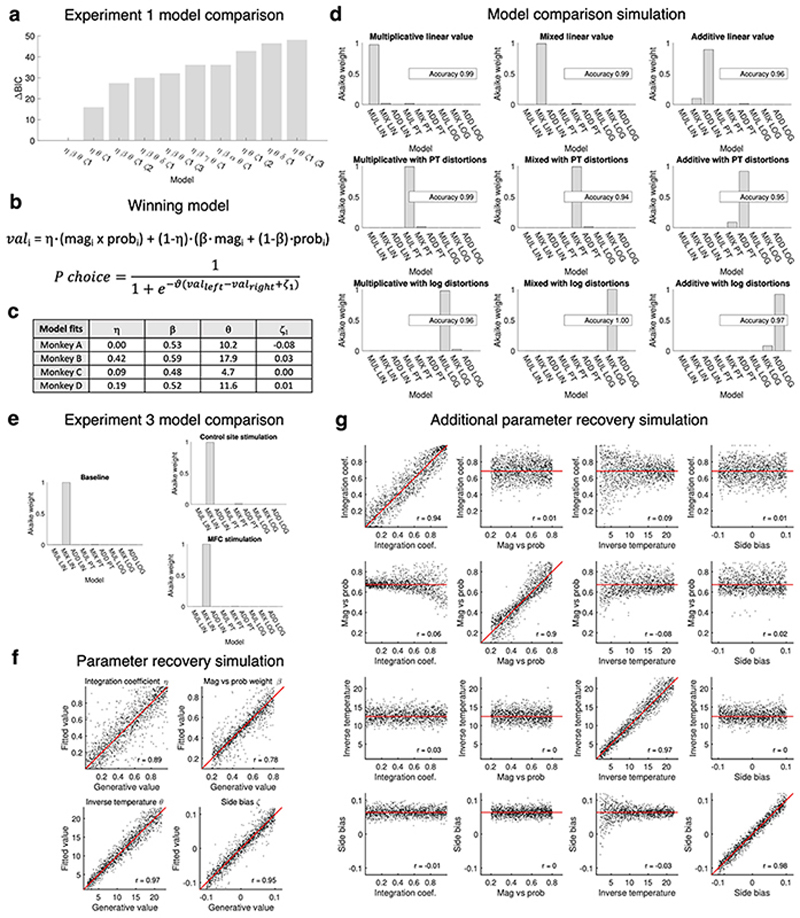
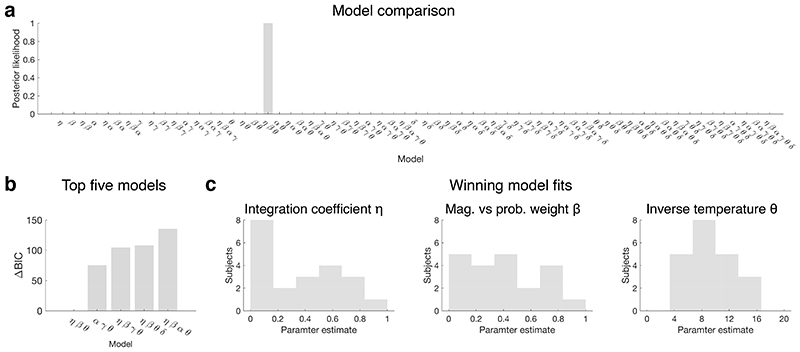
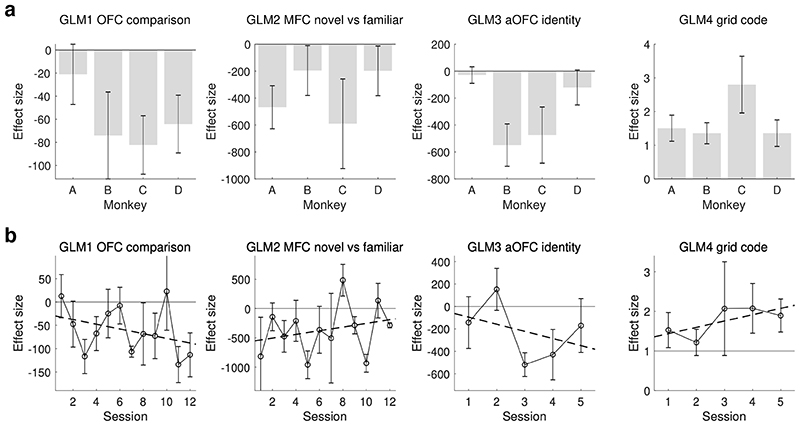
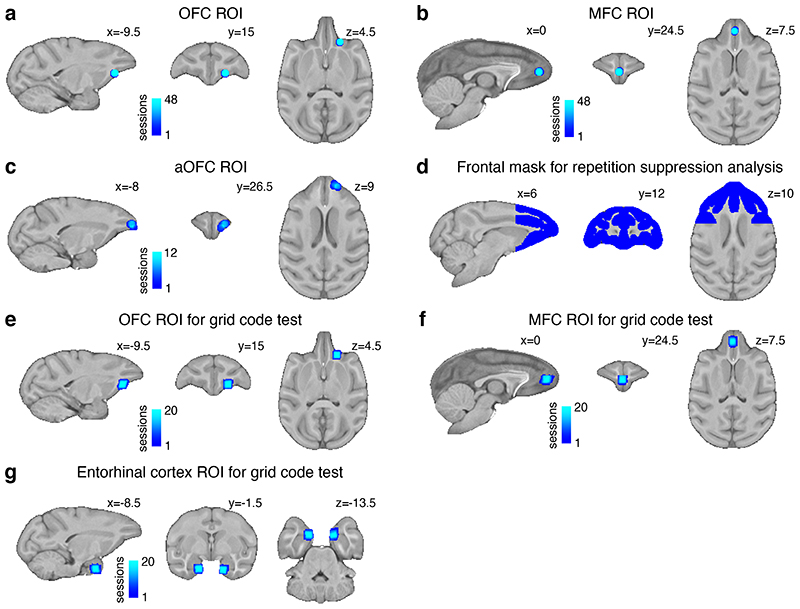
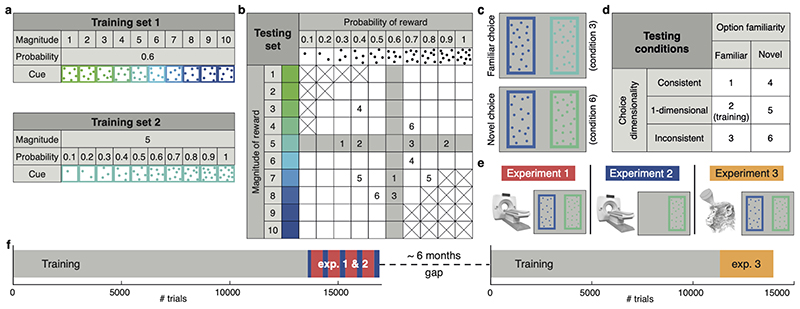
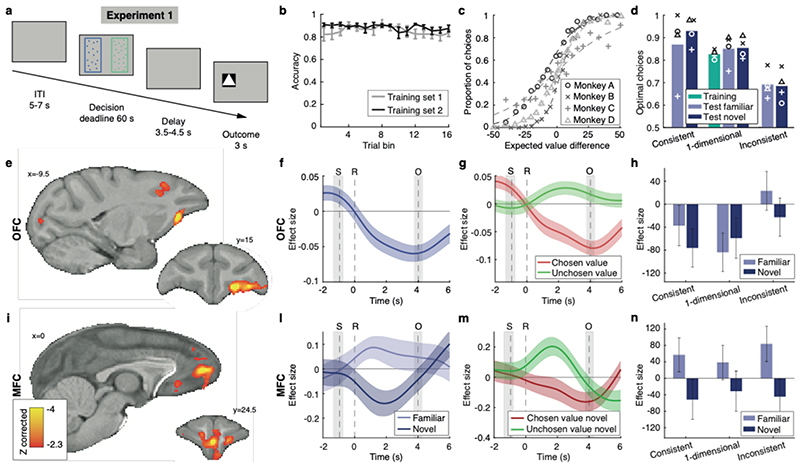
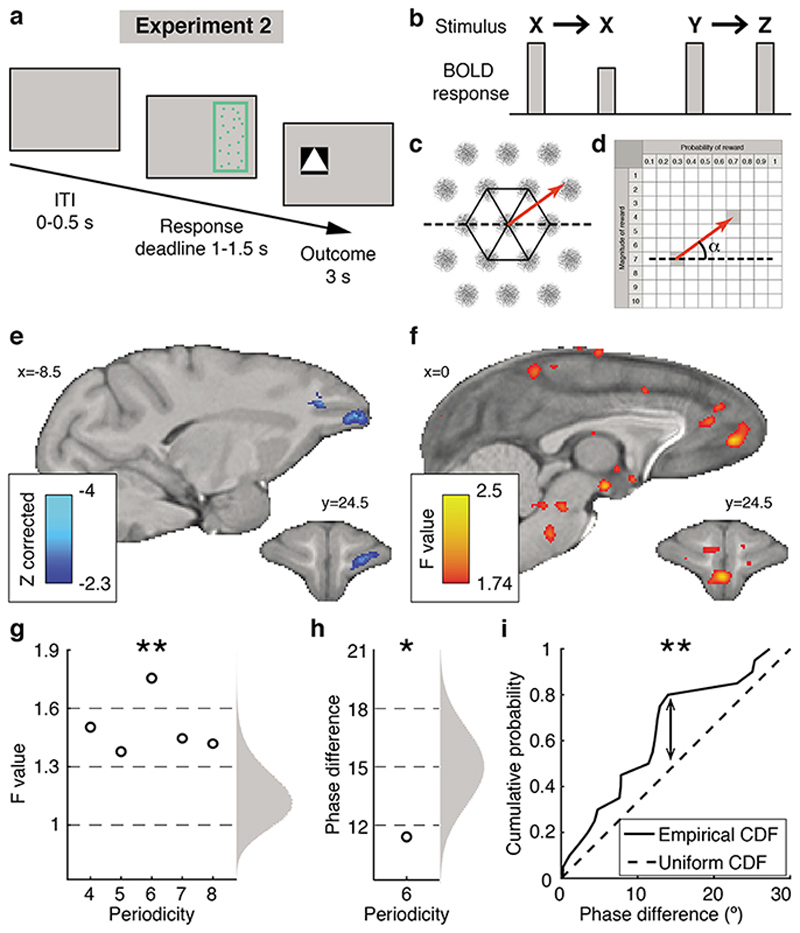
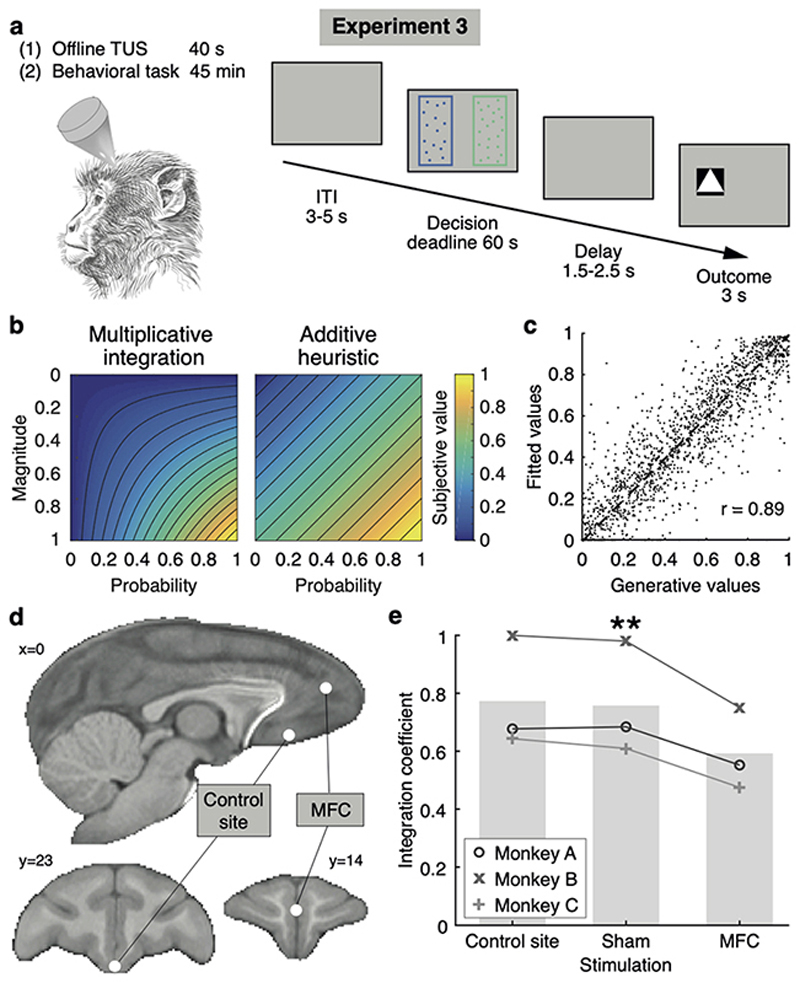
Neural mechanisms that mediate the ability to make value-guided decisions have received substantial attention in humans and animals1-6. Experiments in animals typically involve long training periods. By contrast, choices in the real world often need to be made between new options spontaneously. It is therefore possible that the neural mechanisms targeted in animal studies differ from those required for new decisions, which are typical of human imaging studies. Here we show that the primate medial frontal cortex (MFC)7 is involved in making new inferential choices when the options have not been previously experienced. Macaques spontaneously inferred the values of new options via similarities with the component parts of previously encountered options. Functional magnetic resonance imaging (fMRI) suggested that this ability was mediated by the MFC, which is rarely investigated in monkeys3; MFC activity reflected different processes of comparison for unfamiliar and familiar options. Multidimensional representations of options in the MFC used a coding scheme resembling that of grid cells, which is well known in spatial navigation8,9, to integrate dimensions in this non-physical space10 during novel decision-making. By contrast, the orbitofrontal cortex held specific object-based value representations1,11. In addition, minimally invasive ultrasonic disruption12 of MFC, but not adjacent tissue, altered the estimation of novel choice values.


Conflict of interest statement

Competing interests The authors declare no competing interests.

Figures

Extended Data Fig. 1
Extended Data Fig. 1. Experiment 1 behaviour.
(a-b) Number of times each stimulus was chosen within experiments 1 (a) and 2 (b). White: familiar options; grey: novel options (shading corresponds to relative frequency). Note that the same training trials were added to the familiar test trials in both panels a and b. (c) Response time (RT) distribution. Mean familiar and novel RT = 3.082 and 3.060 s respectively; median familiar and novel RTs = 0.931 s and 0.969 s respectively. (d) RTs by subject and condition. We found no difference between familiar and novel RTs (paired t-test for mean: t 11 = 0.1, P = 0.92 and median: t 11 = 1.4, P = 0.19). Each dot in the graphs represents one subject and one level of dimensionality. A Bayesian ANOVA over all trials (n=8511) with subject as mixed effect and familiarity as fixed effect supported the null hypothesis - no difference between familiar and novel RTs - with a posterior likelihood of 0.91. (e) Logistic fit of the probability of choosing the right-hand option as a function of right minus left subjective value, as in main Fig.2c for objective performance. (f) Subjective performance across conditions, as in Fig.2d. Performance is expressed as the proportion of choices in favour of the option with highest subjective value, as estimated by our model. Bars represent the mean of four subjects.
Extended Data Fig. 2
Extended Data Fig. 2. Additional fMRI results of experiment 1.
(a) The parametric modulation of BOLD signal by the difference in value between the unchosen and chosen options, estimated with GLM1, activated other clusters beyond the OFC depicted in Fig.2e. One cluster encompassed numerous areas including ACC, dlPFC, insula (corrected at Z > 2.3, P = 10-5, peak Z = 4.66 [11.5 2.5 17.5]); others were located in the visual cortex (not illustrated). (b) We also report an observation highlighting an area likely involved in our task in the midbrain in the vicinity of the ventral tegmental area, (P < 0.001, uncorrected). A similar observation has been made in a task resembling our familiar task in analyses of individual neuron firing rates in the ventral tegmental area (M Matsumoto, personal communication). (c) The contrast of BOLD modulation by the value comparison signal (chosen minus unchosen value) in novel versus familiar trials, estimated with GLM2, which activated MFC as depicted in Fig.2i, is also visible in the ventral striatum (P < 0.001, uncorrected). A similar observation has been made in a task resembling our familiar task in analyses of individual neuron firing rates in the ventral striatum53. (d) fMRI effect of value comparison as in main Fig.2i, but using a subjective estimate of value (whole-brain FWE cluster-corrected at Z > 2.3, P = 0.002, peak Z = 3.87 [0 24.5 7.5]). (e) Average timecourse of the value comparison signal from GLM2 in OFC (top) in familiar and novel trials separately, in analogy with what reported for MFC in Fig.2l, replicated here (bottom). (f) Timecourses of the component effects (value of chosen option; value of unchosen option) as in Fig.2g,m but separately for familiar, novel, MFC and OFC. Top row: orbitofrontal ROI; bottom row: medial frontal ROI. (g) Timecourse analysis of the value comparison signal, as in Fig.2l, but using a subjective definition of value. (h-i) Timecourses of the parametric modulation of the BOLD signal for the same contrasts as in panels e,f and ROIs defined in the same way, but time-locked to the stimulus presentation. (l) Relationship between network dynamic and BOLD response. This shows that in a driftdiffusion or an attractor model, if activity falls immediately after the threshold is reached (thick lines in the top panel and bright colours in the bottom panel), the BOLD response will be negatively correlated with value difference, as in macaques; but if the activity is maintained for longer (dotted lines in the top panel and shaded colours in the bottom panel), the BOLD response will be positively correlated with value difference, as in humans (Supplementary Information). Illustration reproduced with permission.
Extended Data Fig. 3
Extended Data Fig. 3. FMRI design matrices.
Correlations among task-related regressors (averaged across sessions) in all GLMs. Additionally, for GLM1 (a, bottom) the thirteen motion regressors and the first ten low-quality volume regressors are also illustrated. For all other GLMs, these regressors are not illustrated. Black line: regressors of interest. (a) GLM1: experiment 1 decision task, value comparison analysis, all trials. (b) GLM2: experiment 1 decision task, value comparison analysis, trials divided by condition depending on familiarity and dimensionality. There are six copies of each decision-related regressor. (c) GLM3: experiment 2 single-option task, repetition suppression analysis. There are six copies of each decision-related regressor, one per condition depending on the preceding stimulus. (d) GLM4: experiment 2 single-option task, grid-code analysis. There are two copies of each decision-related regressor: valid and invalid trials. Correlations here shown for 6-fold modulations of the BOLD signal; they were similar for other periodicities (4 to 8 fold), as well as for the two halves of the phase consistency design.
Extended Data Fig. 4
Extended Data Fig. 4. Additional fMRI results of experiment 2.
(a) Using whole-brain FWE cluster correction, no significant repetition suppression effects were found elsewhere in the brain. However, for the sake of completeness, we illustrate here the distribution of uncorrected effects throughout the brain indicating the locations of potential representations of specific identities of stimuli; contrast of BOLD activity elicited by stimuli preceded by identical stimuli vs stimuli preceded by different stimuli (ID-DV, GLM3). Outside the prefrontal mask (Extended Data Fig.9d), repetition suppression effects analogous with those reported in the main text for anterior OFC (Fig.3e), were observed in the anterior temporal lobe / perirhinal cortex, in entorhinal cortex and the perigenual ACC, in the principal sulcus and in medial frontal pole (Z > 2.3, uncorrected). (b) After Bonferroni correction (all t 11 < 1.42, all adjusted P > 0.28) there were no significant repetition suppression effects in aOFC when successive stimuli had the same value but different probability and magnitude components (SV) compared to successive stimuli with different values (DV), nor when successive stimuli sharing just the same magnitude component (SM) or the same probability component (SP) were compared to DV stimuli. Error bars represent standard error of the mean (SEM) in this panel and the next. As in main Fig.3e, this test is restricted to sessions 3-5 of experiment 2. (c) No significant effect of repetition suppression was observed in MFC (ROI identified in experiment 1) after Bonferroni correction (all t 11 < 2.1, all adjusted P > 0.09) for the same contrasts as shown in panel b, plus the effect of identical stimuli versus different stimuli (ID-DV). (d) Temporal signal to noise ratio; the tSNR was very good in the anterior part of brain, but slightly lower at the edges, which may potentially explain the weak grid effect in entorhinal cortex. (e) Illustration of the relationship between trajectory angle and response of grid cells. In grey, schema of the receptive field of an ideal grid cell (multiple neighbouring cells tend to align with each other). In red, trajectory from one location to the next one in a two-dimensional space. The amount of activation of the cell’s receptive field varies continuously with the trajectory angle and repeats itself every 60°. In this example, it is maximum at 0° and 60° and minimum at 30°, but in the general case the orientation of the grid is not known a priori. (f) Additional sections of the whole-brain distribution of quadrature test scores for a hexagonal grid code, also reported in main Fig.3f, averaged across 20 sessions and thresholded at F > 1.74 (P < 0.001 uncorrected). Consistent with previous results in humans, we observed a six-fold modulation of the BOLD signal in entorhinal cortex (ERH), visual cortex (VC), anterior cingulate cortex (ACC), frontal eye field (FEF), temporal pole (TP), and posterior intraparietal lobule pIPL. These results are presented without cluster correction (because of the non-normal distribution of the F statistics, standard cluster correction could not be performed). (g) Separate null distributions for each periodicity. Each distribution is based on all sessions and locations within the brain, for a given GLM. Non-parametric tests of each periodicity based on these distributions gave the same results as those based on the joint distribution. P-values are reported in the table. (h-i) Statistical results from the grid code test at different periodicities. No significant effect after Bonferroni correction in OFC (h), nor entorhinal cortex (ERH) (i). The results reported in panel i refer to right ERH; they were qualitatively the same as those from left ERH. The shuffled null distribution is shown to the right and the F values indexing grid effects for each periodicity are shown to the left in each panel. None of the periodicities reached significance in either region, even if some voxels in entorhinal cortex exceeded the P < 0.001 threshold for the 6-fold symmetry, as reported in panel f.
Extended Data Fig. 5
Extended Data Fig. 5. Additional data related to experiment 3.
(a) TUS locations recorded at end of each session. (b) Logistic fits of choices in experiment 3, divided by subject and condition. Each circle represents 55 choices. There was no effect of neurostimulation on the slope of the psychometric curve (repeated-measures ANOVA: F 2,4 = 0.05, P = 0.95). (c) Parameter estimates of all the subjective model parameters. Error bars represent SEM across the four sessions per subject per condition, fitted separately. A systematic effect of stimulation is present for the integration coefficient after Bonferroni correction (F 2,4 = 24.2, uncorrected P = 0.006, corrected P = 0.024), but no effects of magnitude vs probability (F 2,4 = 1.5, uncorrected P = 0.32); inverse temperature (F 2,4 = 0.2, uncorrected P = 0.83) or side bias (F 2,4 = 0.9, uncorrected P = 0.48). Post-hoc one-tailed paired t-tests on the integration coefficient confirmed a significant effect of ultrasound stimulation in novel trials specific to the MFC condition. MFC vs sham, t 2 = 5.17, Cohen’s d = -5.8, P = 0.018; MFC vs control site t 2 = 4.97, Cohen’s d = -2.6, P = 0.019. Note that the large error margins in the “magnitude vs probability” parameter β fits in monkey B are due to the fact that this parameter only affects behaviour when the integration coefficient β is lower than 1.
Extended Data Fig. 6
Extended Data Fig. 6. Subjective value modelling.
(a) Results of the full model comparison based on experiment 1 data (Methods). 512 models were tested, each one including or excluding 9 possible parameters corresponding to decision biases. The winning model includes 4 parameters: integration coefficient η, magnitude vs probability weight β, inverse temperature θ, fixed side bias ζ1, with a BIC difference of 15.9 relative to the second-best model, corresponding to a Schwarz weight = 0.999. (b) Equation defining the winning model (Methods, eq.1). (c) Parameter estimates for the four parameters of the winning subjective value model in experiment 1. (d) Simulation of a reduced model comparison, created to test whether the way individual dimensions (magnitude, probability) are represented by linear or non-linear functions can be dissociated from the way the dimensions are combined together. Nine models were used to generate artificial decisions and then they were compared to assess whether recovery was reliable. “MUL”: multiplicative dimension integration; “MIX”: mixed multiplicative and additive combination; “ADD”: additive dimension combination. “LIN”: linear basis functions; “PT”: non-linear distortions defined as in Prospect Theory; “LOG”: logarithmic basis functions. Each panel represents a separate model comparison based on artificial choices generated according to the model described in the panel title. 100 repetitions (with 3 simulated agents performing 440 decisions each) were run; in all cases the total Akaike weight indicated a strong conditional probability in favour of the true model; the accuracy values in the onsets refer to the proportion of repetitions in which the true model won the model comparison. (e) Results of the model comparison based on the real data from experiment 3, in which the same 9 models from the previous analysis (panel d) were compared. In the baseline condition and also in the ultrasound stimulation conditions, choices were best represented by a linear model (no saturating basis functions) with mixed multiplicative and additive dimension combination, which is consistent with the winning model in experiment 1 (panels a,b). (f) Results of a simulation using the winning model. This shows good recovery of all model parameters and most importantly the integration coefficient h: correlation between true and fitted value r = 0.89. Recovery based on 440 artificially generated choices; the red lines indicate ground-truth values (an equivalent result was obtained based on experiment 1 stimulus schedules). (g) Parameter recovery from a further simulation of experiment 3 with the same model: three parameters were fixed at realistic values and only one was varied at any time. Recovery based on 440 artificially generated choices; the red lines indicate ground-truth values. On-diagonal panels show recovery of each parameter as a function of itself (high accuracy), off-diagonal panels show recovery of each parameter as a function of the irrelevant ones (no cross-correlations).
Extended Data Fig. 7
Extended Data Fig. 7. Human decision-making data.
Both humans and macaques perform binary value-based decision-making in a similar manner. These human data were first reported by Chau and colleagues, but here they have been re-analysed (with permission) using the same approach as the one applied to the data obtained from macaques in experiment 1. (a) 21 subjects performed 300 choices each; a model comparison identified the same subjective value model (ηβθ) described above as the one best explaining their behaviour, with a Schwarz weight > 0.999. Side bias ζ was not tested. (b) The BIC score difference with the second-best model was 75. (c) The human subjects displayed a range of different behaviours, as revealed by the histograms of the integration, magnitude versus probability, and inverse temperature parameter fits. In particular, we noted how some subjects were fully additive (η=0) but others were very good at integrating the two dimensions of value (with η approaching 1).
Extended Data Fig. 8
Extended Data Fig. 8. fMRI effects split by subject and session.
(a) Effect sizes for key analyses are shown separately for each subject and GLM. Error bars represent SEM. (b) Key effects plotted session by session. The continuous horizontal line represents the absence of an effect. The dotted line is a linear fit. Error bars represent SEM. No trend was statistically significant (GLM1: t 10 = -1.30, P = 0.22; GLM2: t 10 = 0.63, P = 0.54; GLM4: t 3 = 1.57, P = 0.21). Note that the selection of the aOFC ROI for GLM3 (third graph in panel b) was biased towards finding a temporal trend, because it was based on the effect of the last three sessions of each subject. It was merely included here for completeness.
Extended Data Fig. 9
Extended Data Fig. 9. Masks and ROIs.
(a) Spherical (5 mm diameter) OFC ROI used for timecourse analysis of experiment 1 (Fig.2f,g,h, Extended Data Fig.2e,f,g,h,i top row), centred on the peak of the activation for GLM1, reported in Fig.2e, with a leave-one-out procedure. (b) Spherical (5 mm diameter) MFC ROI used for experiment 1 timecourse analysis and repetition suppression analysis (Fig.2l,m,n, Extended Data Fig.2e,f,g,h,i bottom row, Extended Data Fig.4c), centred on the peak of the activation for GLM2, reported in Fig.2i, with a leave-one-out procedure. (c) Spherical (5 mm diameter) aOFC ROI used for further repetition suppression analyses (Extended Data Fig.4b), centred on the peak of the activation for GLM3, reported in Fig.3e, with a leave-one-out procedure. (d) Frontal cortex mask used in the repetition suppression analysis (Fig.3e) defined as cortical gray matter anterior to y=4.5 and expanded by one voxel. (e) 3x3x3 voxel OFC ROI defined in acquisition space for the grid-code signature analysis (Extended Data Fig.4h), centred on the peak of the activation for GLM1. (f) 3x3x3 voxel MFC ROI defined in acquisition space for the grid-code signature analysis (Fig.3g,h,i), centred on the peak of the activation for GLM2. The locations in panels e-f are the same as in panels a-b and are therefore independent with respect to experiment 2. The only difference is that the ROIs in panels e-f are defined in acquisition space. (g) 3x3x3 voxel entorhinal cortex ROI used for grid-code signature analysis (Extended Data Fig.4i) defined a priori.
Fig. 1
Fig. 1. Experimental design.
(a) Training set 1: stimuli varied in reward magnitude (drops of juice), cued by colour. Training set 2: stimuli varied in reward probability, cued by dot numerosity. (b) Testing set: stimuli varied in both magnitude and probability. Grey: familiar options; white: novel options. Crossed squares were not tested. Pairs of numbers exemplify choices in different conditions. (c) Stimulus appearance in two example trials. (d) Diagram of the 2 (familiarity) by 3 (dimensionality) design. (e) Illustration of the experiments’ features. 1: fMRI and decision task; 2: fMRI and single option (no decision) task; 3: TUS and decision task. (f) Timeline. Grey: training with sets 1 and 2 on alternating days. Red: experiment 1. Blue: experiment 2. Yellow: experiment 3.
Fig. 2
Fig. 2. Experiment 1, neural correlates of familiar and novel decisions.
(a) Trial timeline. (b) Proportion of correct responses during training. Error bars represent standard error of the mean (SEM). (c) Test performance (probability of choosing right as a function of right minus left expected value). (d) Comparison of performance across training and testing conditions. Optimal choices maximise expected value. Bars represent mean of four subjects. (e) Value comparison signal, i.e. chosen value minus unchosen value, across all trials, whole-brain cluster-corrected. (f) Time-course of the parametric modulation of the BOLD signal in OFC for all trials, time-locked to response. S: stimulus, R: response, O: outcome. Coloured line: mean of all sessions; coloured shade: SEM across sessions. Grey shades: interquartile ranges of stimulus and outcome time distributions. Same conventions apply in panels g,l,m. (g) Value comparison signal in OFC split into its components. (h) Value comparison signal in OFC split by condition. Error bars represent SEM. (i) Comparison signal difference between novel and familiar conditions, whole-brain cluster-corrected. Scale bar applies to both panels e and i. (l) Parametric modulation of the BOLD signal in MFC for novel and familiar choices separately. (m) Chosen value and unchosen value contributions to the comparison signal in MFC for novel trials only. (n) Value comparison signal in MFC split by condition. Same conventions as panel h. In all panels n=4 monkeys x n=12 sessions.
Fig. 3
Fig. 3. Experiment 2, stimulus and value space neural representations.
(a) Trial timeline. (b) Illustration of repetition suppression effect. (c) Hexagonal symmetry (in black) of the receptive field of an ideal grid-cell (in grey) and a trajectory (in red) between two locations. (d) Illustration of the angle of the trajectory (in red) in value space from one option to the next. The angle is relative to a fixed orientation (dotted line). (e) Repetition suppression effect for option identity, cluster-corrected within frontal cortex. Test based on sessions 3 to 5. (f) Quadrature test for a hexagonal symmetry: average F values, P < 0.001 uncorrected (group level F-statistic cluster-correction is not possible). (g) Nonparametric test of the average F values for periodicities from four- to eight-fold; randomized null distribution on the right; a Bonferroni correction with factor 5 is applied; Results did not change with periodicity-specific null distributions (Extended Data Fig.4g). Data in panels g-h-i are from the MFC ROI defined independently in experiment 1. (h) Average phase difference between grid orientation estimates from two interleaved trial subsets from each session. Right: a priori null distribution. (i) Illustration of Kolmogorov-Smirnov test: empirical and a priori cumulative distribution functions (CDF) of phase differences across sessions. * P < 0.05, ** P < 0.01. In all panels (except e) n=4 monkeys x n=5 sessions.
Fig. 4
Fig. 4. Experiment 3, behavioural impact of neurostimulation.
(a) Trial timeline in the task following transcranial ultrasound stimulation (TUS). All trials were inconsistent trials. (b) Illustration of the difference in subjective value when using an optimal multiplicative approach (diml x dim2) or a simpler additive approach (dim1+dim2)/2. (c) Recovery of the integration coefficient (ratio of the two approaches) in a simulation with novel trials. (d) Stimulation sites in MFC (ROI identified in experiment 1) and a control site in more posterior frontal cortex. (e) Integration coefficient fits after sham TUS, control site TUS, and MFC TUS; n=3 monkeys x n=4 sessions per condition; ** P < 0.01.

References

    1. Rudebeck PH, Murray EA. The orbitofrontal oracle: cortical mechanisms for the prediction and evaluation of specific behavioral outcomes. Neuron. 2014;84:1143–1156. doi: 10.1016/j.neuron.2014.10.049. - DOI - PMC - PubMed
    1. Murray EA, Rudebeck PH. Specializations for reward-guided decision-making in the primate ventral prefrontal cortex. Nat Rev Neurosci. 2018;19:404–417. doi: 10.1038/s41583-018-0013-4. - DOI - PMC - PubMed
    1. Hunt LT, et al. Triple dissociation of attention and decision computations across prefrontal cortex. Nat Neurosci. 2018;21:1471–1481. doi: 10.1038/s41593-018-0239-5. - DOI - PMC - PubMed
    1. Papageorgiou GK, et al. Inverted activity patterns in ventromedial prefrontal cortex during value-guided decision-making in a less-is-more task. Nature communications. 2017;8:1886. doi: 10.1038/s41467-017-01833-5. - DOI - PMC - PubMed
    1. Rushworth MF, Noonan MP, Boorman ED, Walton ME, Behrens TE. Frontal cortex and reward-guided learning and decision-making. Neuron. 2011;70:1054–1069. doi: 10.1016/j.neuron.2011.05.014. S0896-6273(11)00395-3 [pii] - DOI - PubMed

Publication types