. 2021 Jan;589(7843):608-614.
doi: 10.1038/s41586-020-03086-7. Epub 2021 Jan 6.

In vivo base editing rescues Hutchinson-Gilford progeria syndrome in mice

Affiliations

In vivo base editing rescues Hutchinson-Gilford progeria syndrome in mice

Luke W Koblan et al. Nature. 2021 Jan.

Abstract

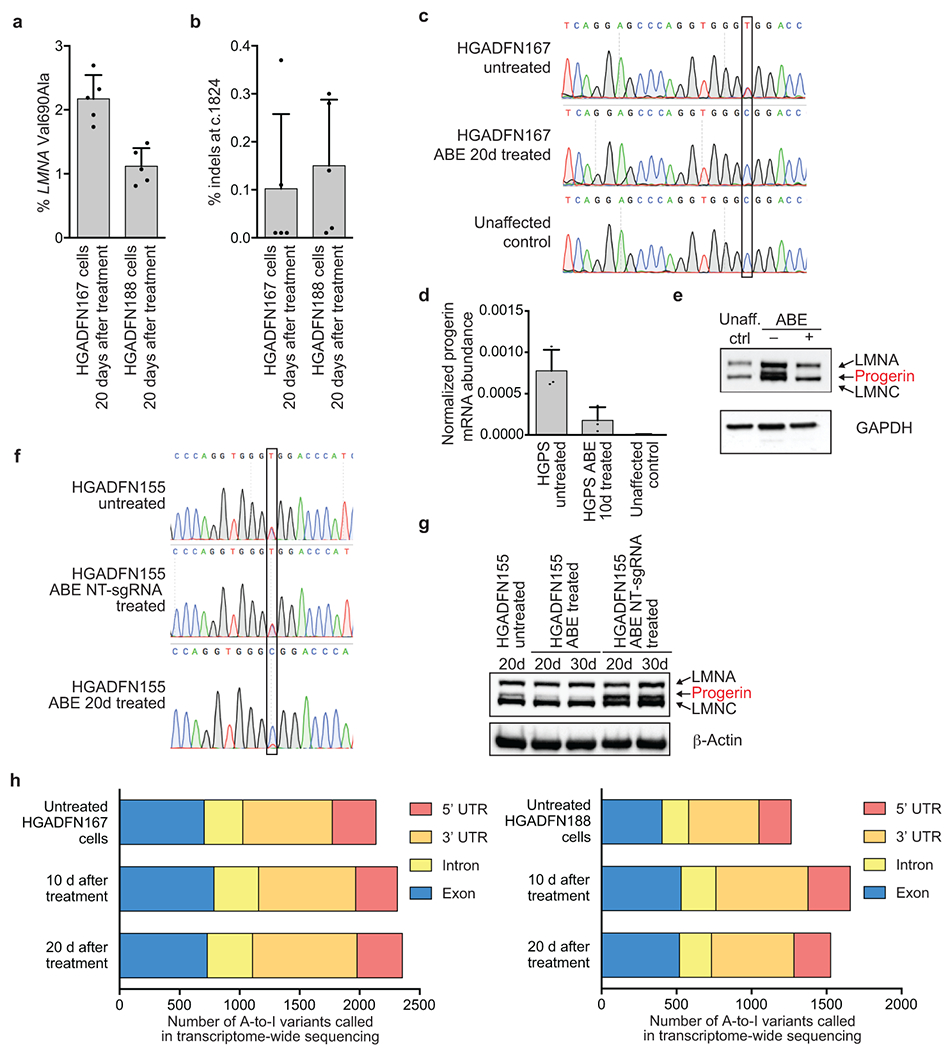
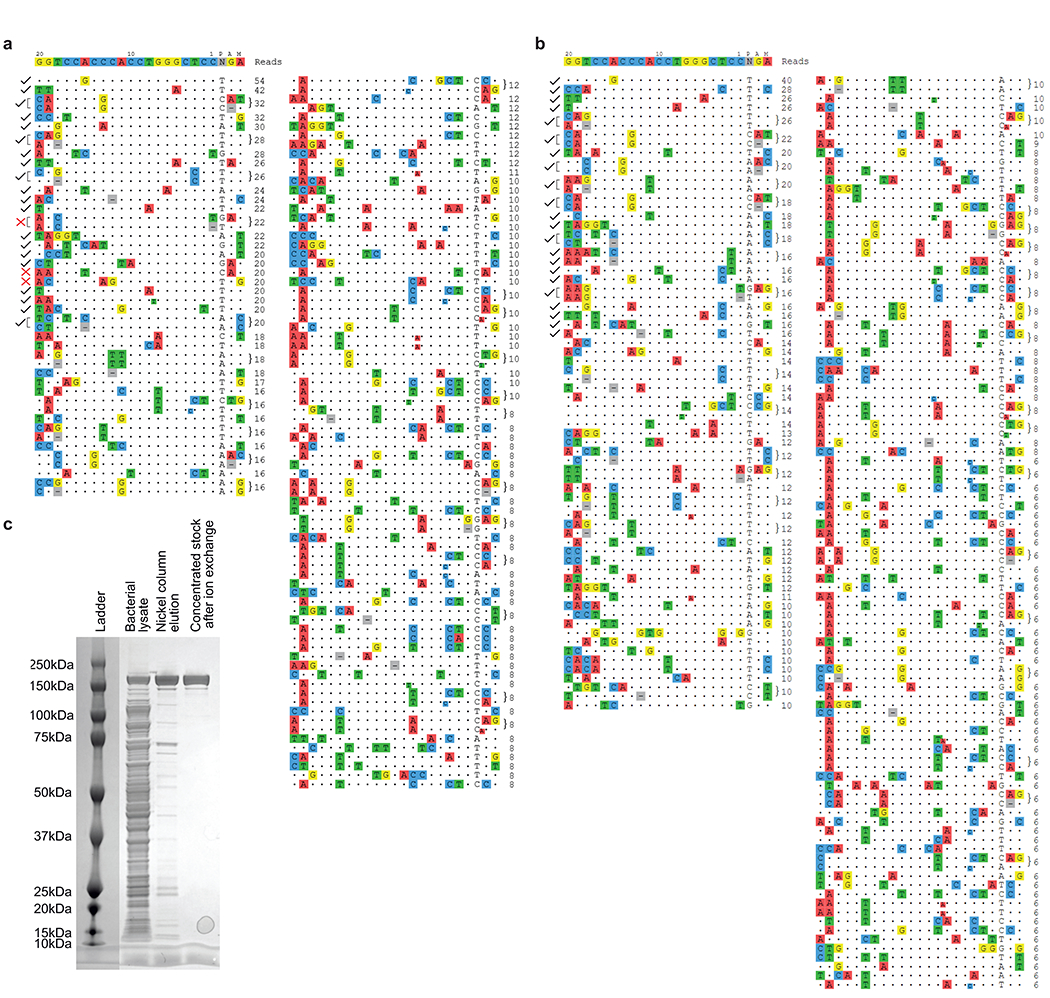
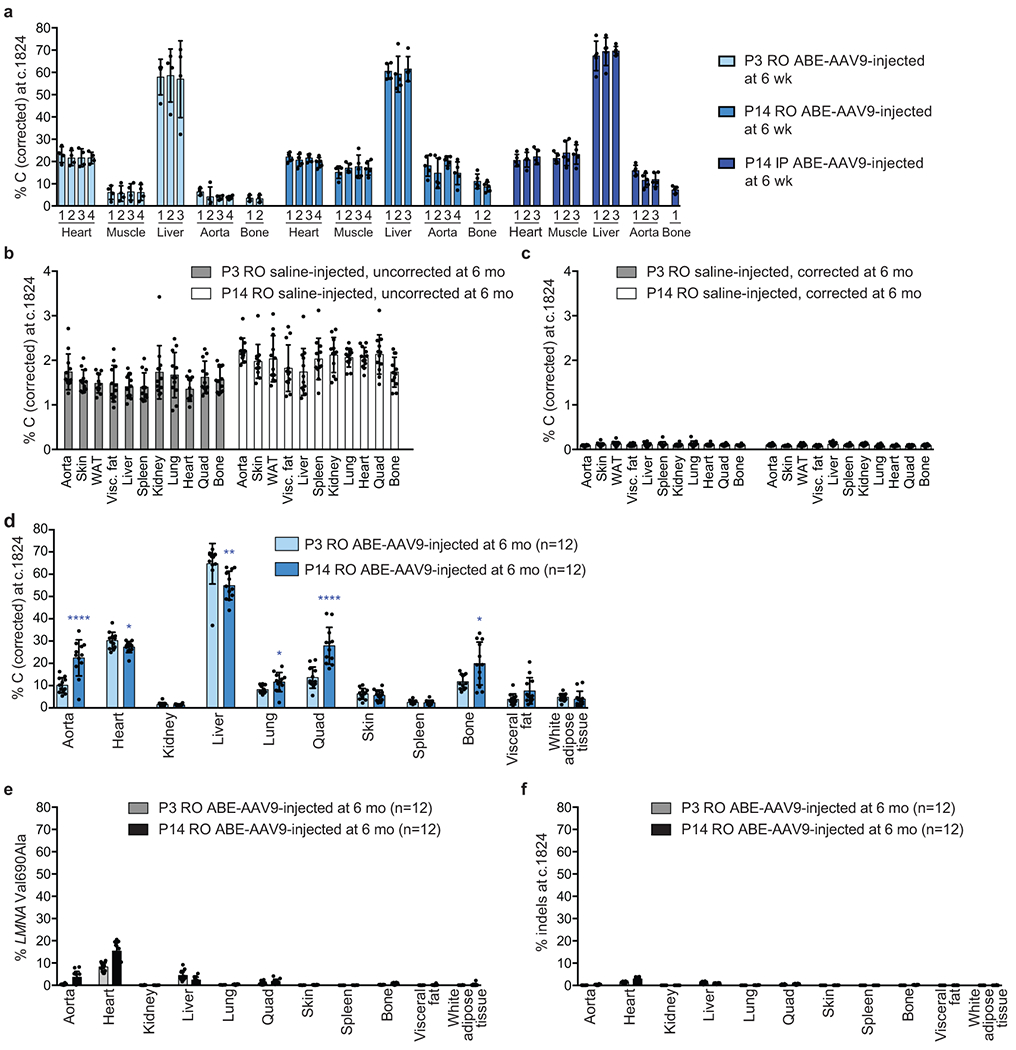
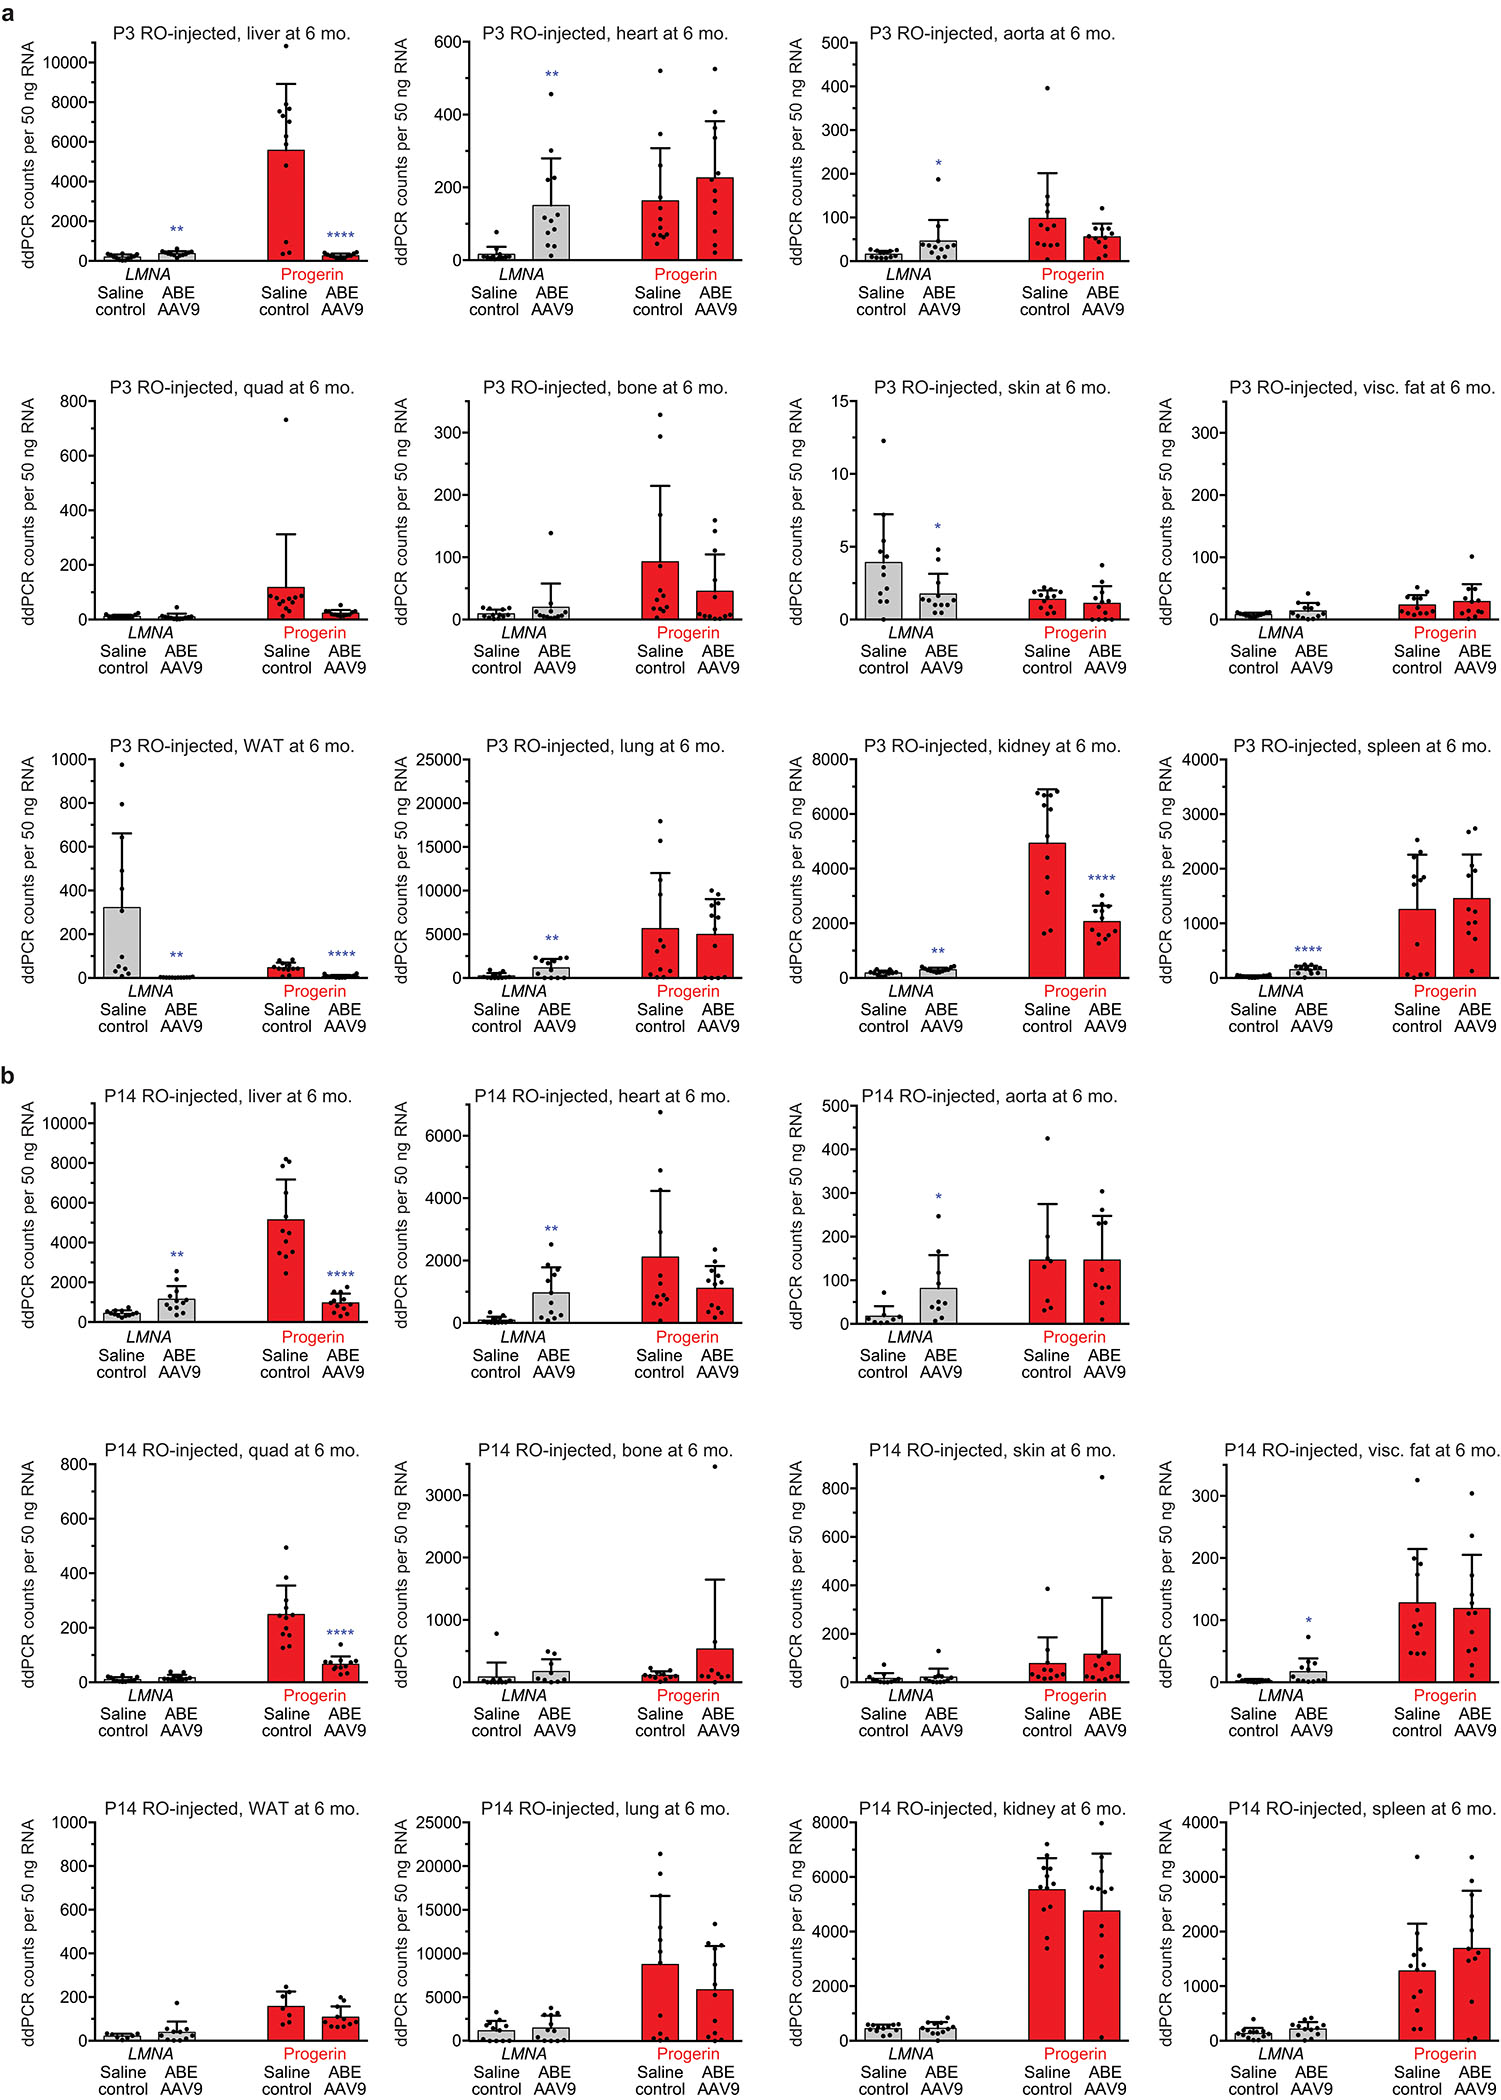
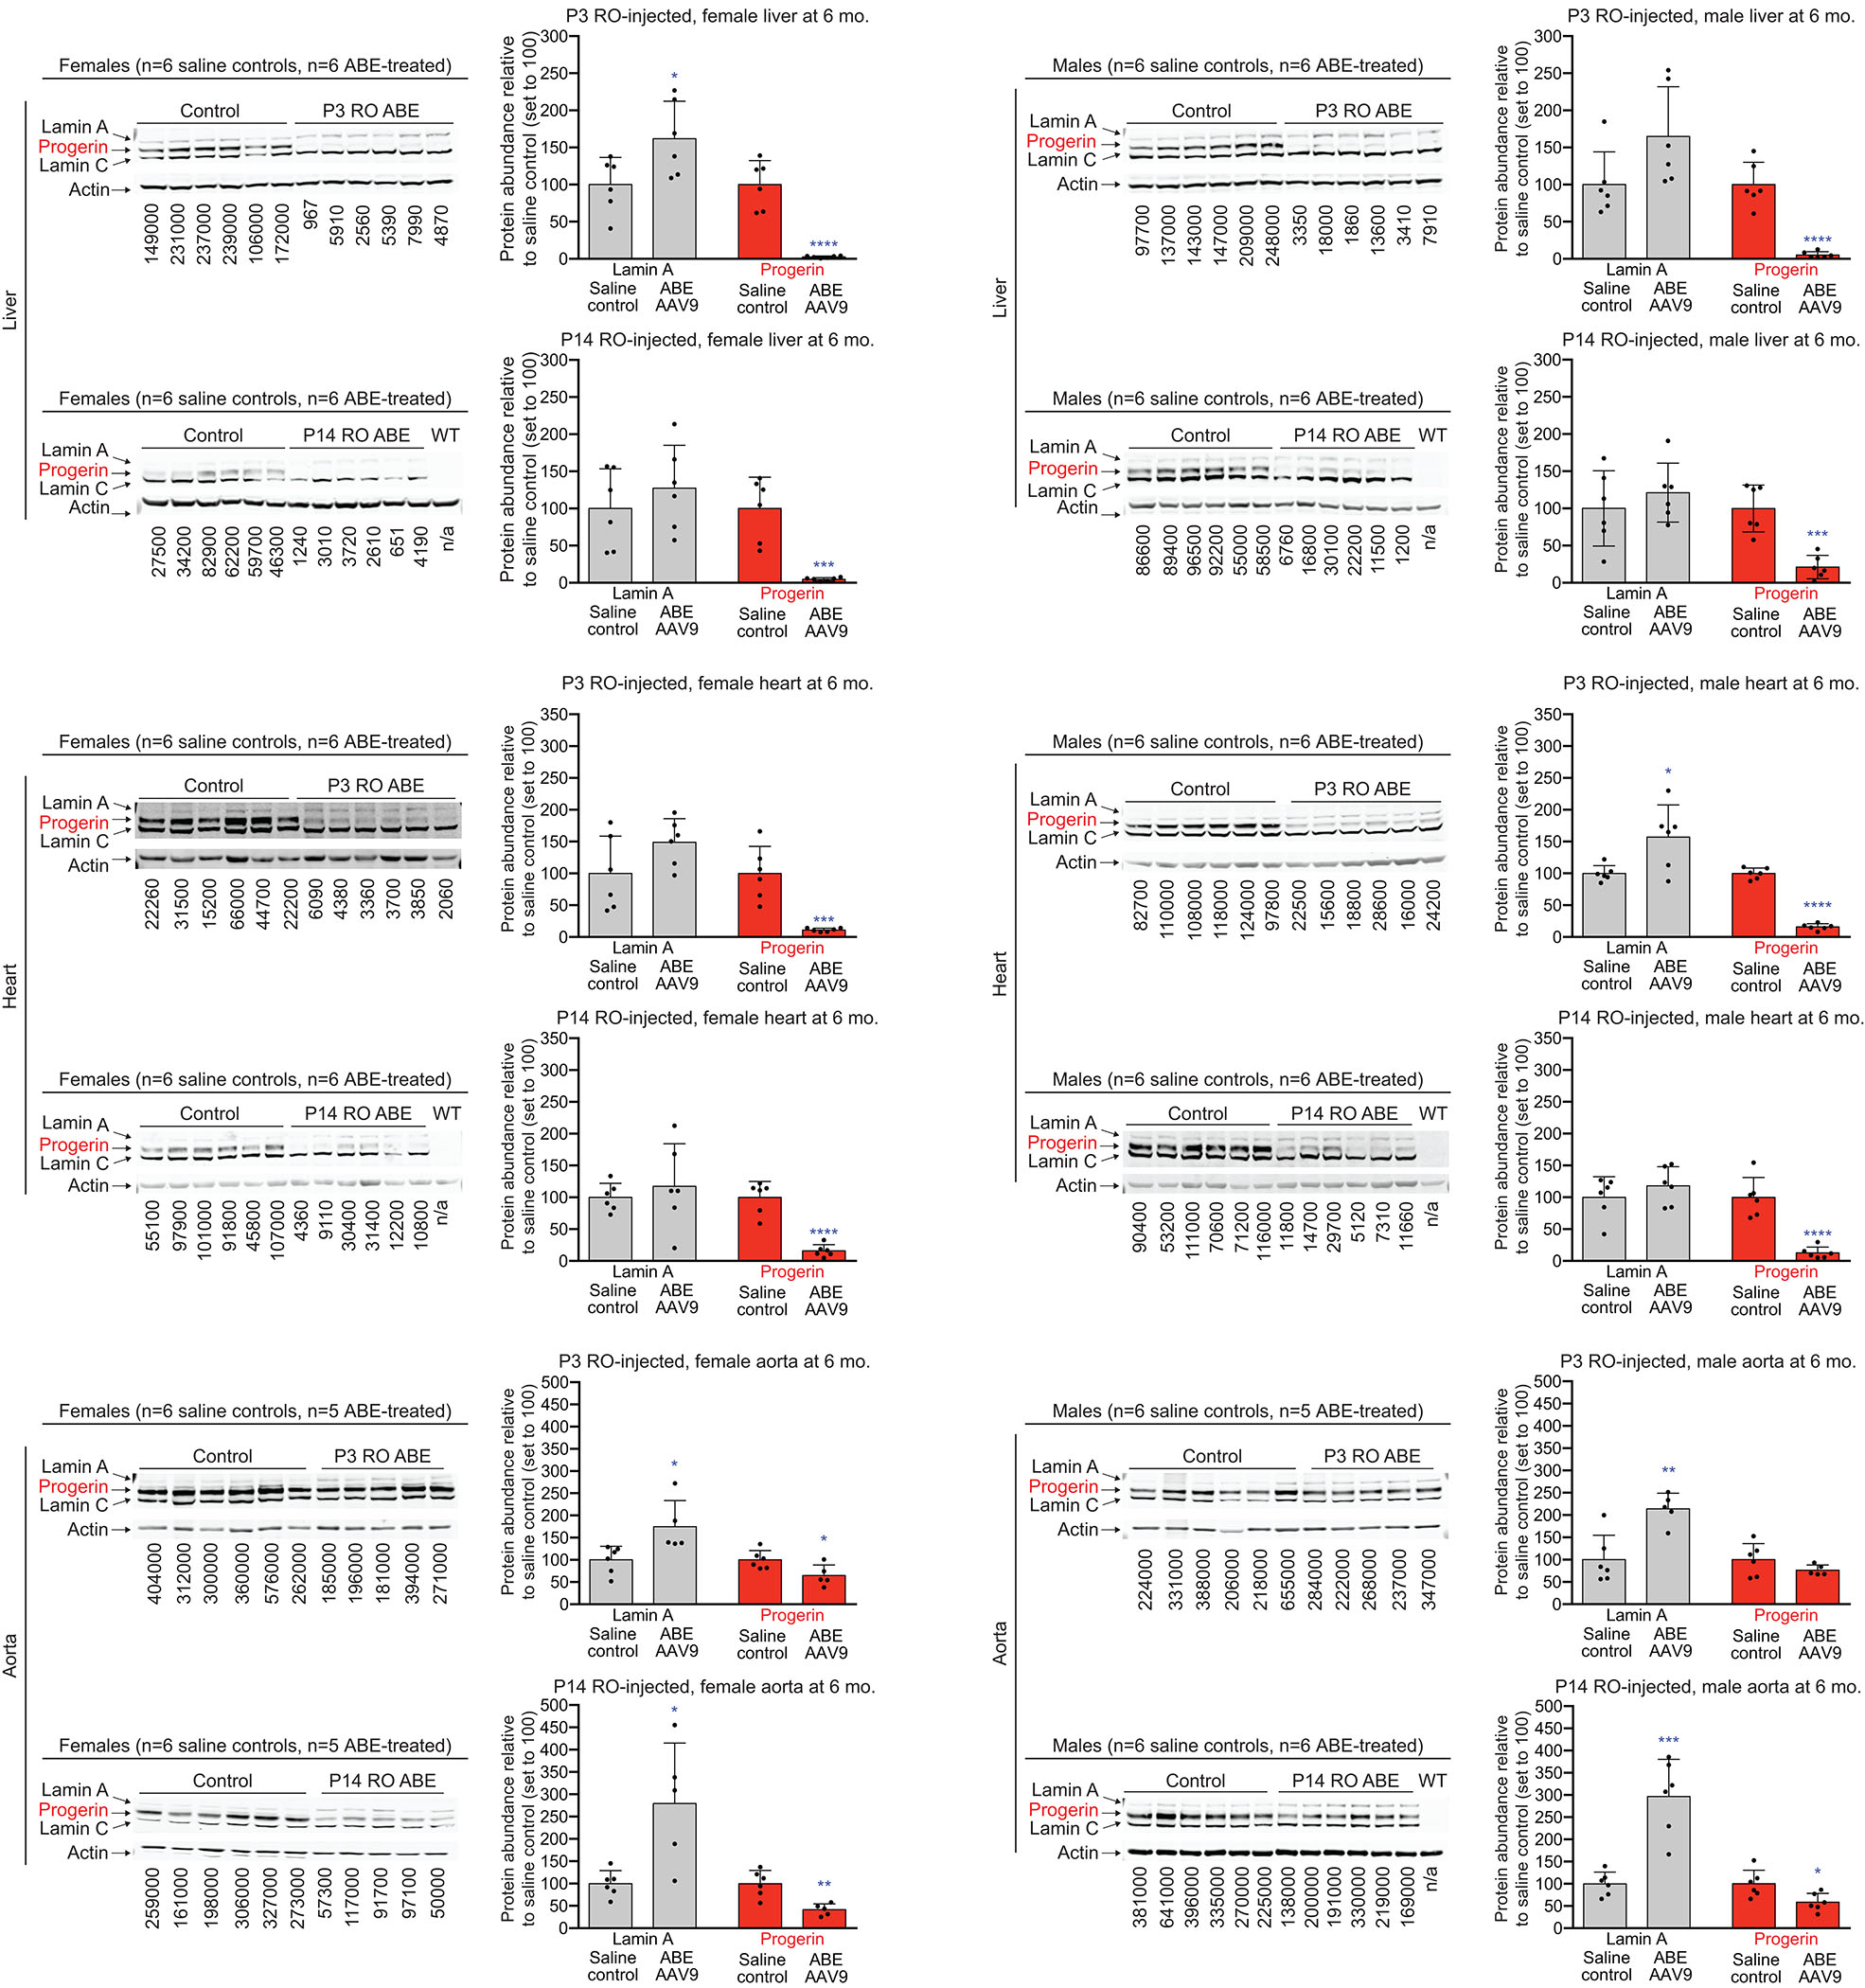
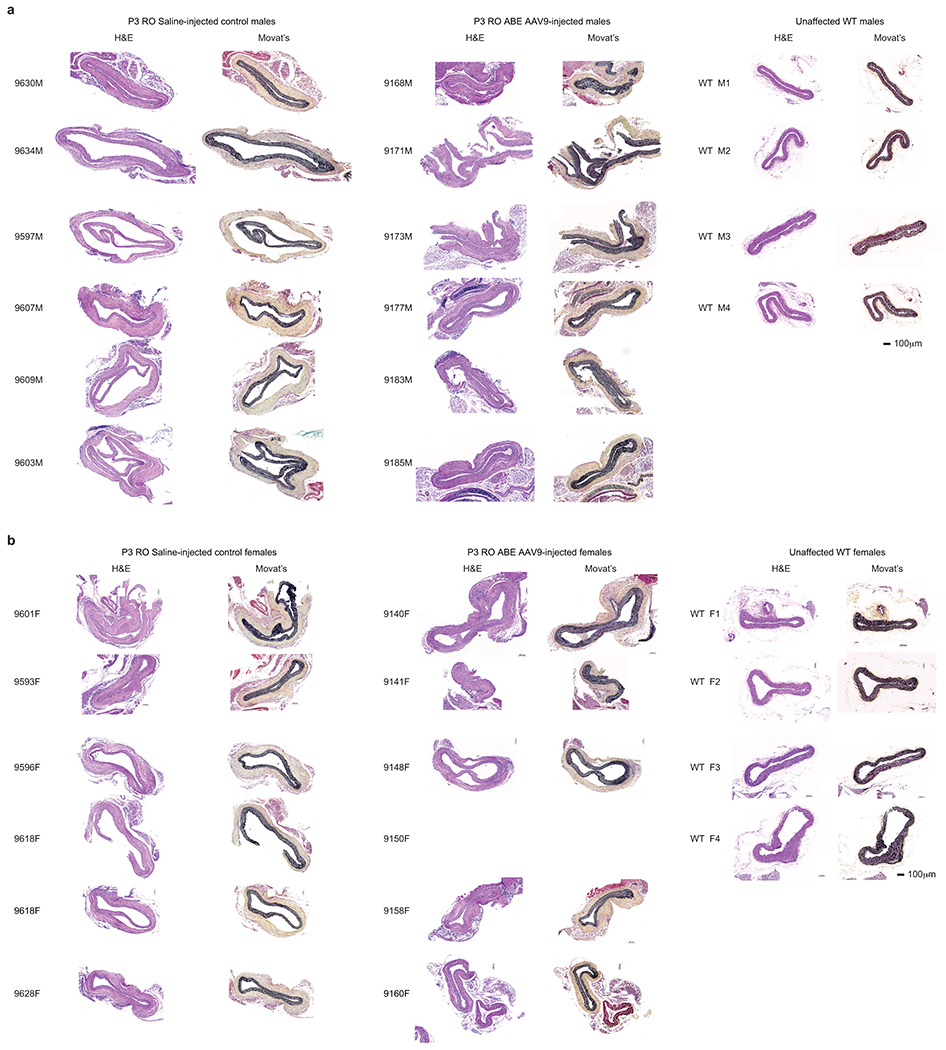
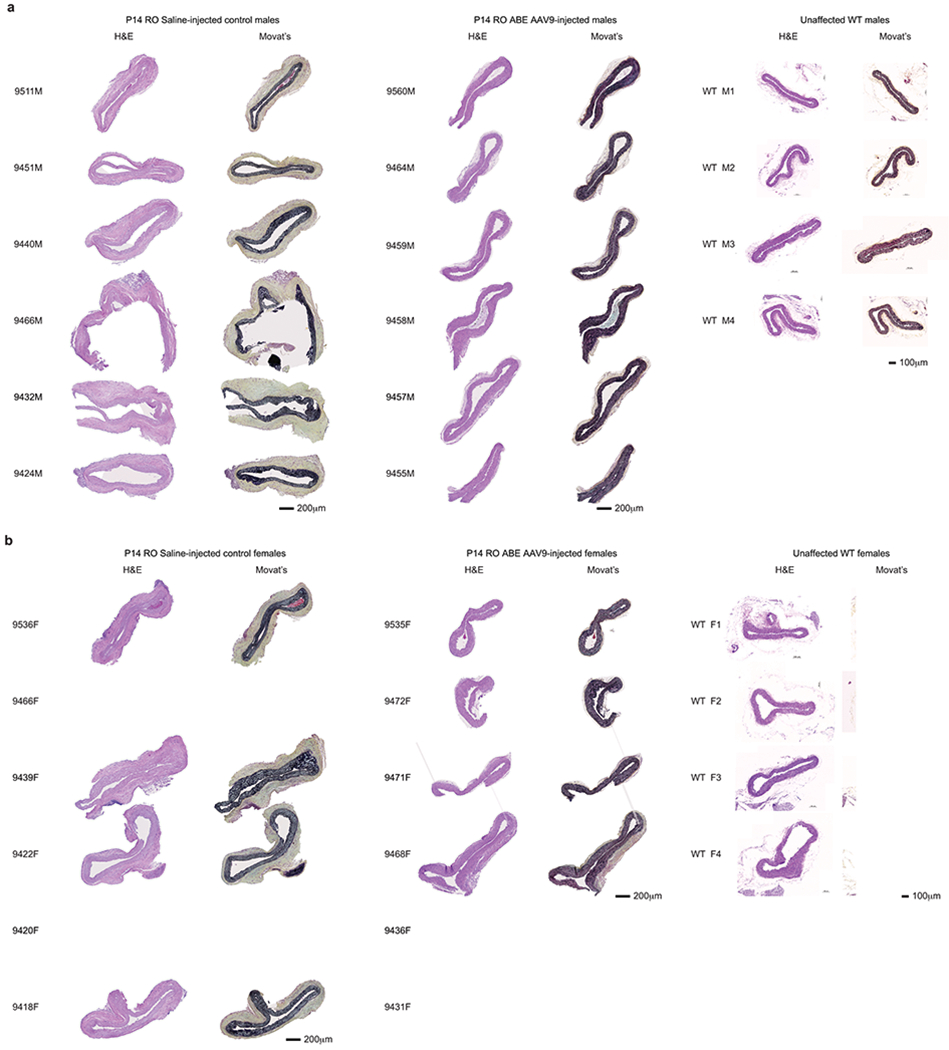
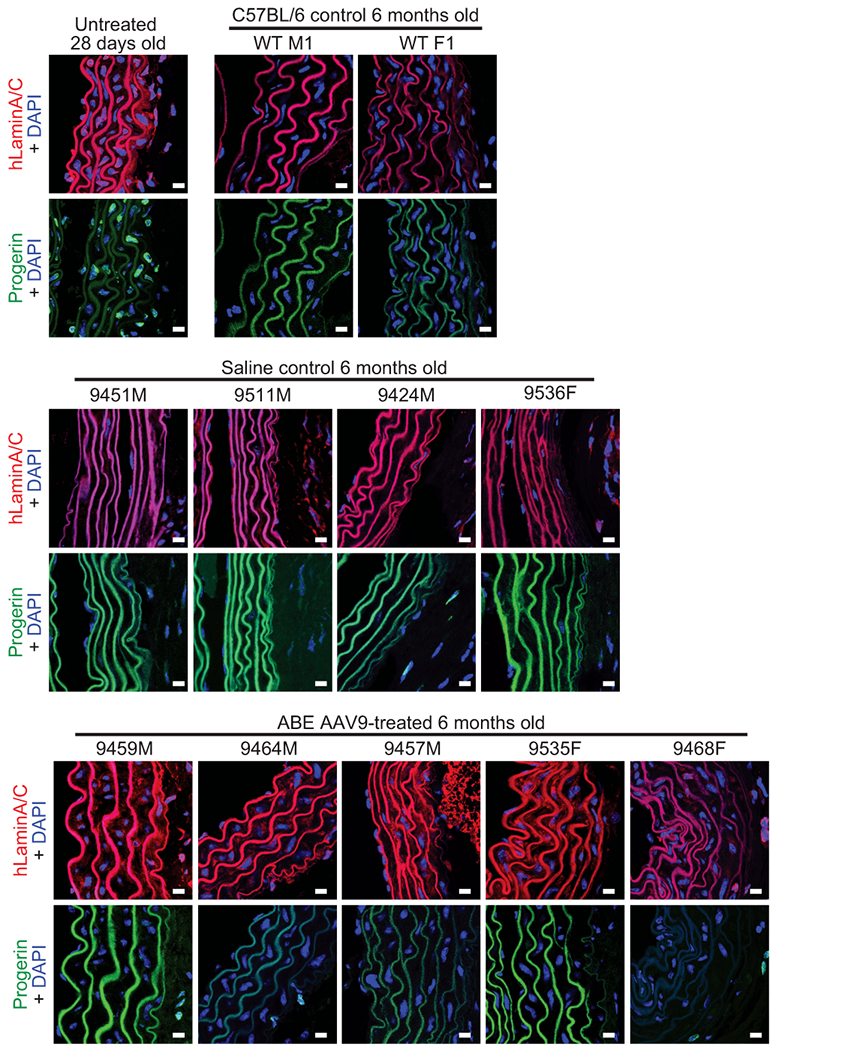
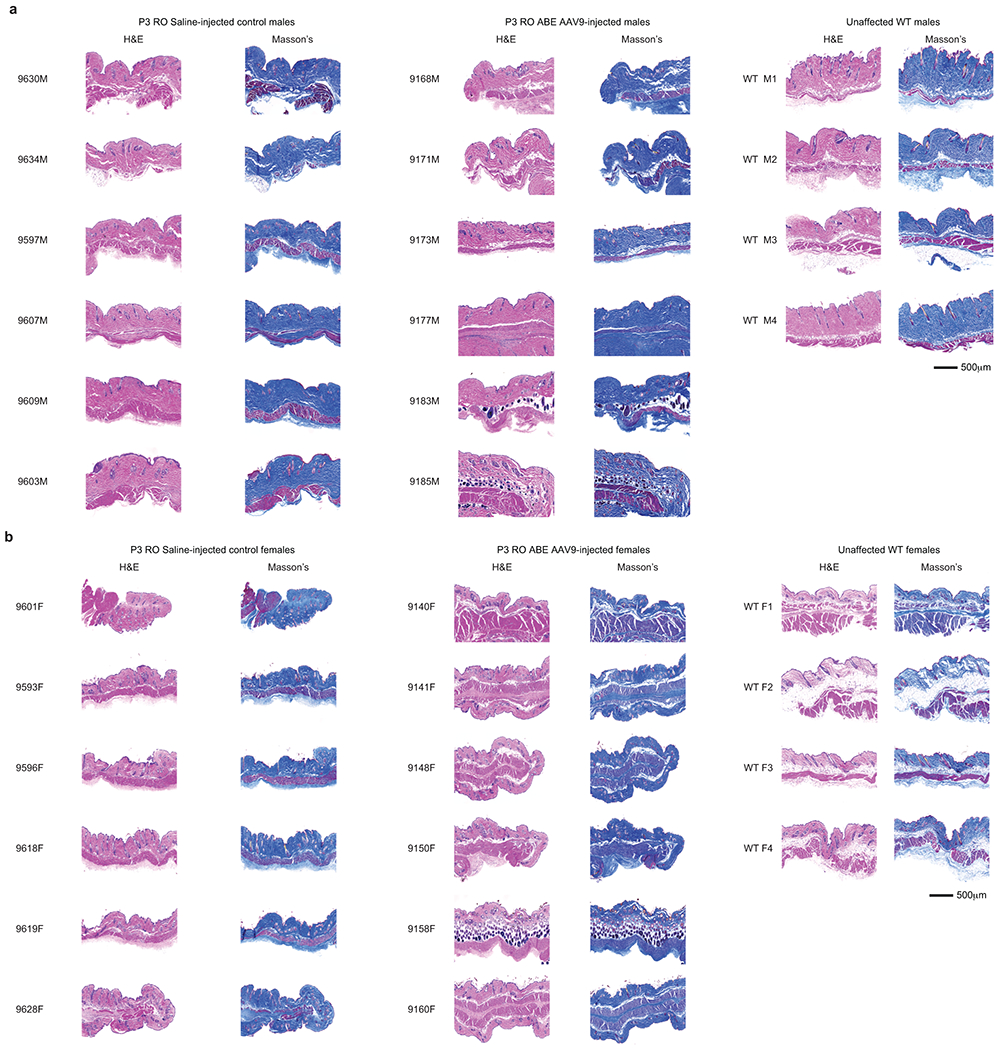
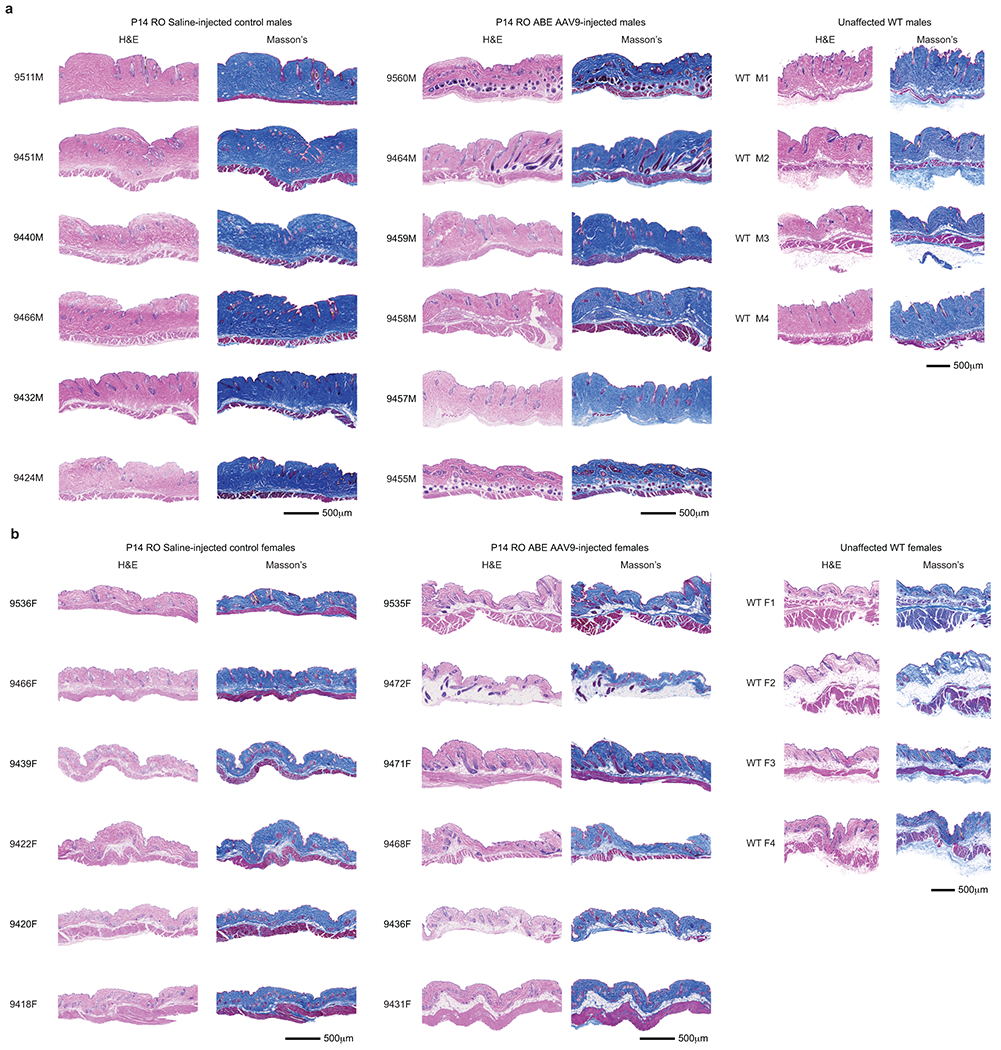
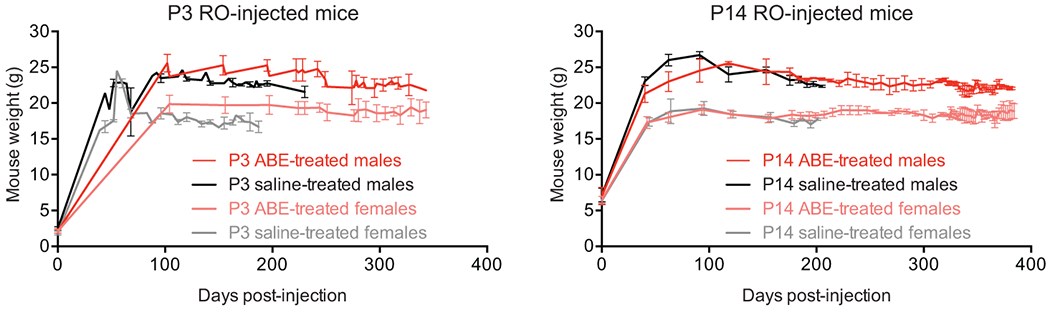
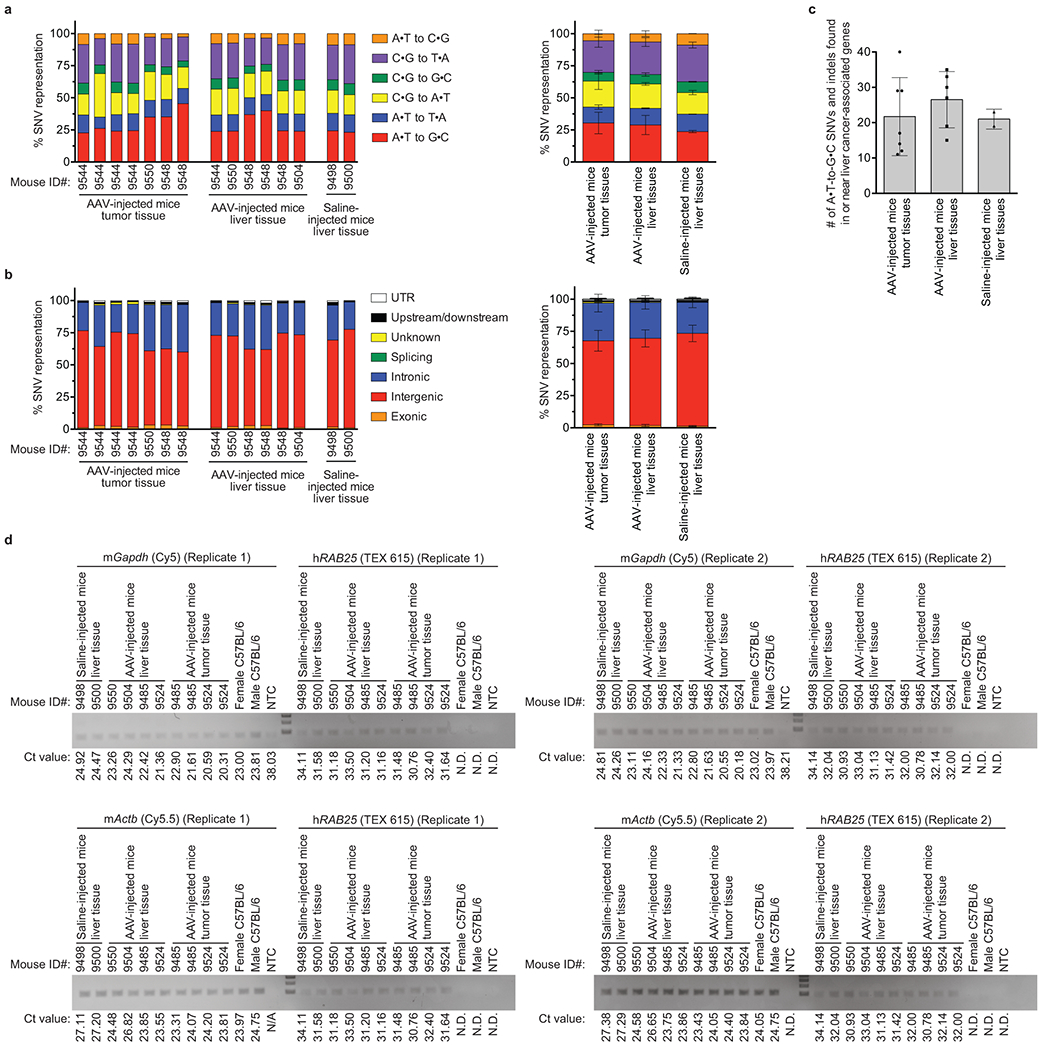
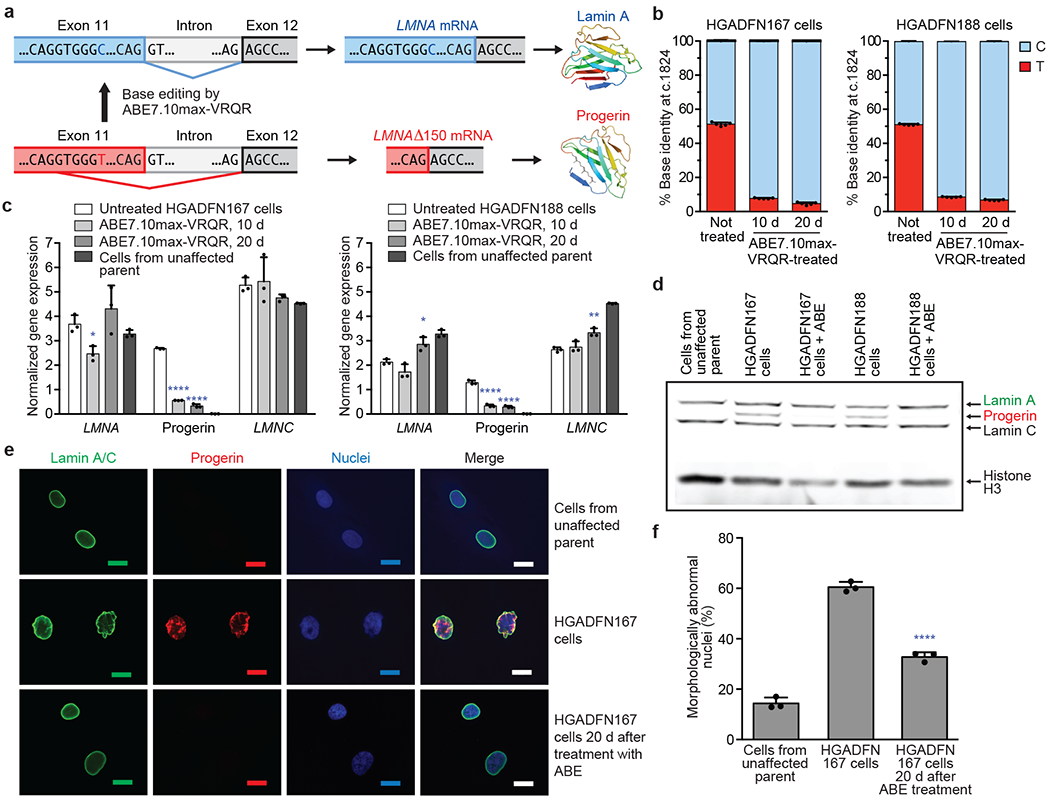
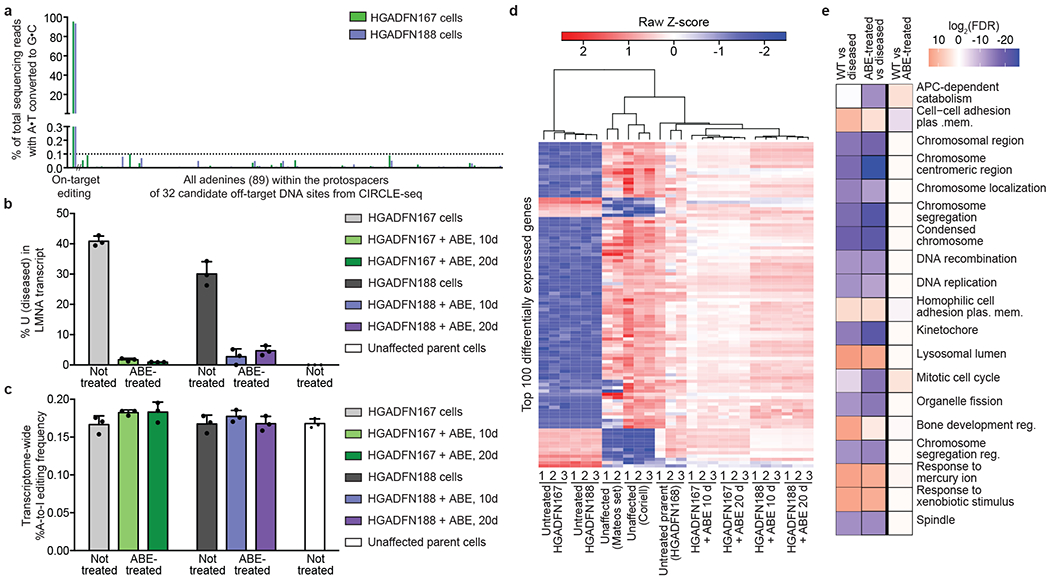
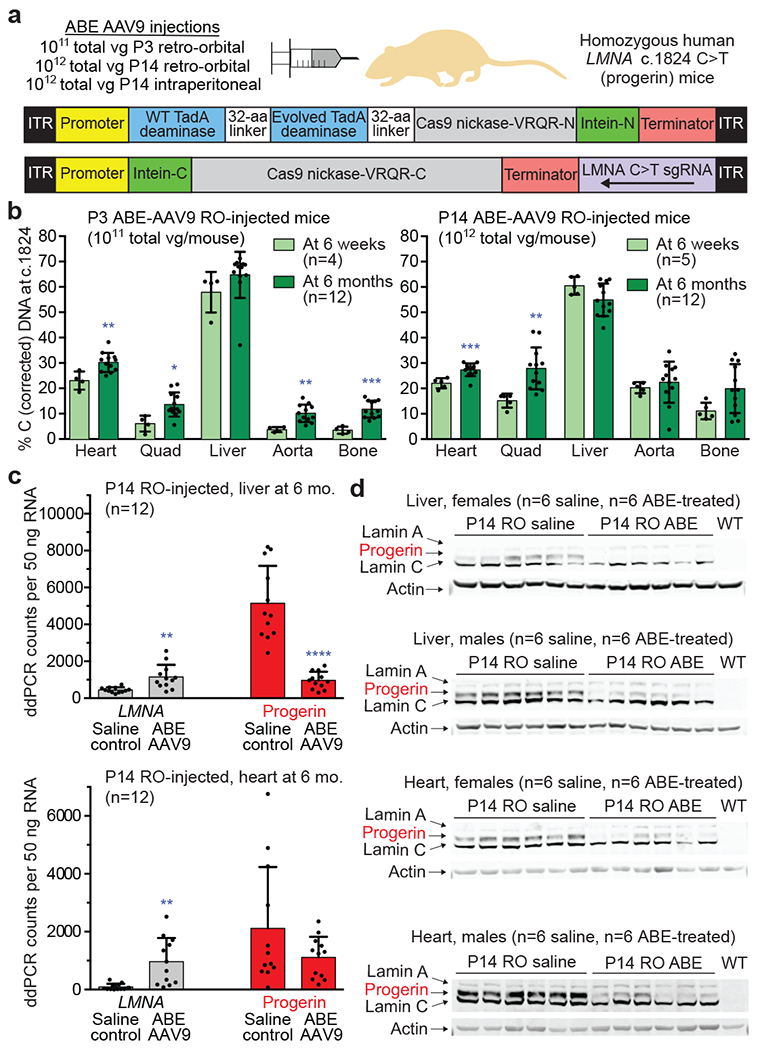
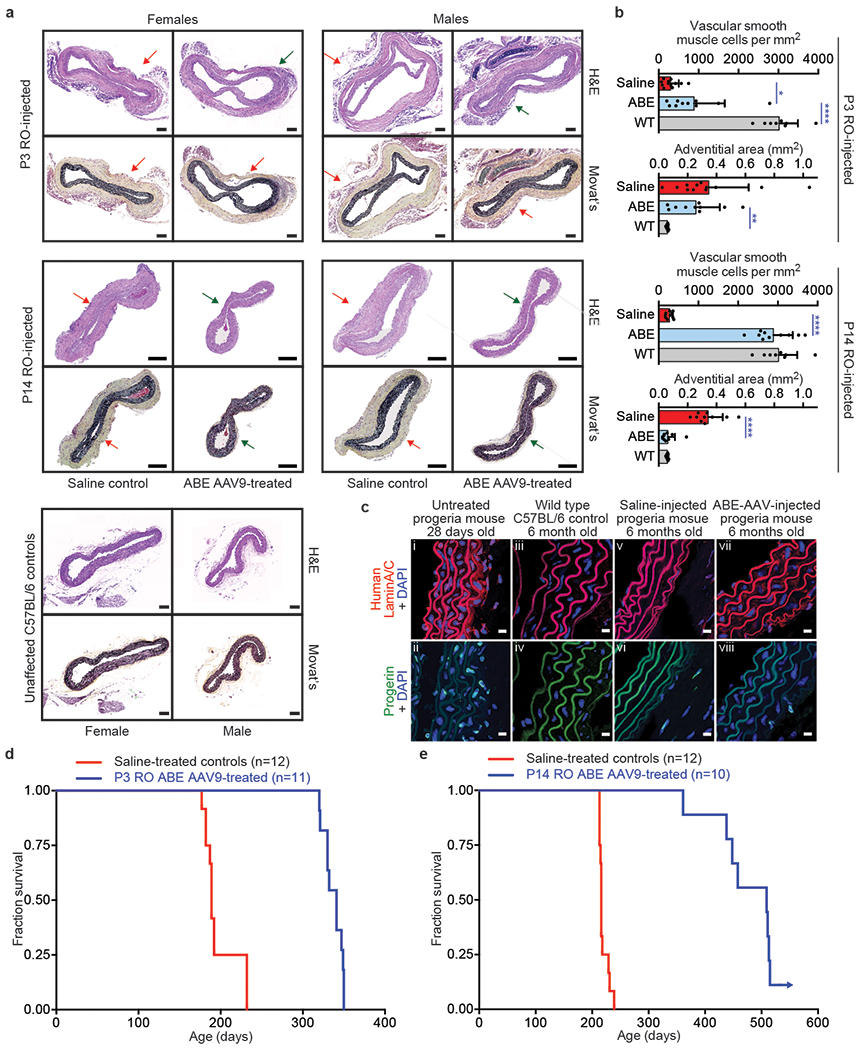
Hutchinson-Gilford progeria syndrome (HGPS or progeria) is typically caused by a dominant-negative C•G-to-T•A mutation (c.1824 C>T; p.G608G) in LMNA, the gene that encodes nuclear lamin A. This mutation causes RNA mis-splicing that produces progerin, a toxic protein that induces rapid ageing and shortens the lifespan of children with progeria to approximately 14 years1-4. Adenine base editors (ABEs) convert targeted A•T base pairs to G•C base pairs with minimal by-products and without requiring double-strand DNA breaks or donor DNA templates5,6. Here we describe the use of an ABE to directly correct the pathogenic HGPS mutation in cultured fibroblasts derived from children with progeria and in a mouse model of HGPS. Lentiviral delivery of the ABE to fibroblasts from children with HGPS resulted in 87-91% correction of the pathogenic allele, mitigation of RNA mis-splicing, reduced levels of progerin and correction of nuclear abnormalities. Unbiased off-target DNA and RNA editing analysis did not detect off-target editing in treated patient-derived fibroblasts. In transgenic mice that are homozygous for the human LMNA c.1824 C>T allele, a single retro-orbital injection of adeno-associated virus 9 (AAV9) encoding the ABE resulted in substantial, durable correction of the pathogenic mutation (around 20-60% across various organs six months after injection), restoration of normal RNA splicing and reduction of progerin protein levels. In vivo base editing rescued the vascular pathology of the mice, preserving vascular smooth muscle cell counts and preventing adventitial fibrosis. A single injection of ABE-expressing AAV9 at postnatal day 14 improved vitality and greatly extended the median lifespan of the mice from 215 to 510 days. These findings demonstrate the potential of in vivo base editing as a possible treatment for HGPS and other genetic diseases by directly correcting their root cause.


Conflict of interest statement

The authors declare competing financial interests: D.R.L. is a co-founder of Beam Therapeutics, Prime Medicine, Pairwise Plants, and Editas Medicine, companies that use genome editing.

Figures

Extended Data Figure 1.
Extended Data Figure 1.. Additional characterization of progeria patient-derived cells treated with ABE7.10max-VRQR.
(a) Bystander Val690Ala editing in progeria patient-derived HGADFN167 and HGADFN188 cells 20 days after treatment with lentiviral ABE7.10max-VRQR. (b) Indel formation frequency at the c.1824 target locus in HGADFN167 and HGADFN188 cells 20 days after treatment with lentiviral ABE7.10max-VRQR. Values and error bars represent mean±SD for n=5 technical replicates (individual points) for (a) and (b). (c) Sanger DNA sequencing traces of untreated HGADFN167 cells, 20-day treated HGADFN167 cells, and unaffected control cells. The target nucleotide is boxed. (d) qPCR-normalized progerin mRNA abundance in cells described in c. Values and error bars represent mean±SD for n=3 biological replicates. (e) Western blot analysis of HGADFN167 cells described in c. LMNA, progerin, and LMNC protein are all stained on the gel, A GAPDH loading control is shown below. An additional replicate is provided in Fig. 1d. Unaff. ctrl, control cells from an unaffected parent. (f) Sanger DNA sequencing traces of untreated, non-targeting (NT) sgRNA treated, and ABE treated HGADFN155 fibroblasts at 20d and 30d time-points to ensure NT-sgRNA did not lead to DNA editing. (g) Western blot analysis of cells described in f. LMNA, progerin, and LMNC proteins are all stained on the gel, A β-actin loading control is shown below. Expected molecular weights: lamin A, 74 kDa; progerin, 69 kDa; lamin C, 65 kDa. Complete blots are available in Supplementary Figure 1. Additional replication was not performed. (h) HGADFN167 (left) and HGADFN188 (right) cell lines untreated or treated with lentiviral ABE7.10max-VRQR after 10 or 20 days show similar relative distributions of A-to-I single-nucleotide variants (SNVs) in their transcriptomes compared with the hg38 human genome reference sequence. On average, 36±3.6% of SNPs in these samples occur with ~100% frequency, suggesting they arise from genomic sequence variations; however, we cannot explicitly exclude them from consideration since no whole genome sequence is available for these cell lines. Raw counts of 100% edited SNPs per sample are: Untreated HGADFN167 cells (849), HGADFN167 10 d after treatment (883), HGADFN167 20 d after treatment (871), Untreated HGADFN188 cells (488), HGADFN188 10 d after treatment (501), HGADFN188 20 d after treatment (510).
Extended Data Figure 2.
Extended Data Figure 2.. CIRCLE-seq analysis of HGADFN167 and HGADFN188 cells using Cas9-VRQR and the progeria-targeting sgRNA.
CIRCLE-seq read counts for Cas9-VRQR nuclease-treated genomic DNA from HGADFN167 (a) and HGADFN188 (b) cell lines. Targeted amplicon sequencing was used to assess the off-target base editing for 36 noted total loci distributed across both cell lines. DNA at 32 of 35 loci amplified efficiently from both cell lines (denoted by black check marks), DNA at 3 loci failed to amplify (denoted by red X marks). Complete CIRCLE-seq data is provided in Supplementary Data 4. (c) SDS-PAGE gel stained with InstantBlue to follow protein purification of Cas9-VRQR. 0.5 μL of clarified lysate, 0.25 μL of nickel column elution, or 0.1 μL of the concentrated protein stock following His-tag purification and ion exchange chromatography were added to 5 μL of NuPAGE loading buffer. Samples were denatured at 98 °C for 5 minutes before loading onto the 4-12% acrylamide gel. Precision Plus Protein Kaleidoscope pre-stained Ladder (Bio-Rad) was used as reference. The desired Cas9-VRQR has a predicted molecular weight of 161.9 kDa. Additional replication was not performed.
Extended Data Figure 3.
Extended Data Figure 3.. DNA on-target editing, bystander editing, and indel efficiencies across tissues from in vivo injection route optimization experiments.
(a) Dual AAV9 encoding split-intein ABE7.10max-VRQR base editor halves and the LMNA-targeting sgRNA were injected into homozygous human LMNA c.1824 C>T mice. P3 retro-orbital (RO) injections (5×10¹⁰ of each AAV vg, 1×10¹¹ vg total), P14 RO injections (5×10¹¹ of each AAV vg, 1×10¹² vg total), and P14 intraperitoneal (IP) injections (5×10¹¹ of each AAV vg, 1×10¹² vg total) were tested. At 6-weeks of age, mice were harvested and heart, muscle, liver, aorta, and bone were isolated for sequencing analysis. Tissues were sub-sectioned for sequencing analysis to ensure sub-sections did not show differences in editing efficiencies for downstream analyses. Each bar represents a different tissue subsection. DNA editing efficiencies correcting LMNA c.1824 from T (pathogenic) to C (wild-type) for P3 RO-injected mice (left, n=4), P14 RO-injected mice (middle, n=5), and P14 RO-injected mice (right, n=5) at 6 weeks of age are shown for five disease-relevant tissues. Values and error bars represent mean±SD. (b) Apparent LMNA c.1824 T (pathogenic) to C (wild-type) mutations from tissue samples of saline-injected P3 RO (left) and P14 RO (right) control mice at 6 months of age show background signal due to amplicon crossover during PCR between the human diseased allele and the wild-type mouse allele, which share 90% overall sequence identity within the amplified region. Similar crossover levels were observed across 11 tissues in both P3 RO and P14 RO saline-injected mice. Values and error bars represent mean±SD for n=12 mice (6 male, 6 female). (c) Computational filtering of same sequencing reads shown in (b) after removing any reads containing any mouse-specific sequence variations, analyzing only reads containing exclusively human sequence. The script used to remove mouse-containing sequencing reads is in Supplementary Note 3 and is described in the methods. WAT white adipose tissue. (d) DNA editing for P3- and P14-injected mice at 6 months of age across 11 tissues. Each point represents a biological replicate of a tissue harvested from a unique mouse (n=12 for each group). (e) Val690➔Ala bystander editing frequency across eleven tissues for P3 RO and P14 RO ABE-treated mice at 6 months of age (n=12 for each group). (f) Indel frequencies at the c.1824 target locus across 11 tissues for P3 RO and P14 RO ABE-treated mice at 6 months of age. Values and error bars represent mean±SD for the indicated number of biological replicates. *p<0.05, **p<0.01, ***p<0.001, ****p<0.0001 by Student’s unpaired two-sided t-test.
Extended Data Figure 4.
Extended Data Figure 4.. Quantification of LMNA and progerin transcript abundance by ddPCR in P3- and P14-injected mice.
(a) ddPCR counts for LMNA (grey bars) and progerin (red bars) RNA transcript abundance in P3 RO saline- and ABE-AAV9-injected mice. Values and error bars represent mean±SD for n=12 mice. (b) ddPCR counts for LMNA (grey bars) and progerin (red bars) RNA transcript abundance in P14 RO saline- and ABE-AAV9-injected mice. Values and error bars represent mean±SD for n=12 biological replicates for all samples except for saline-injected mouse skin (n=11), WAT (n=7), visceral fat (n=11), tibia (n=11), aorta (n=8); and ABE-AAV9-injected mouse WAT (n=11), tibia (n=9), and aorta (n=10). WAT white adipose tissue. Visc. fat, Visceral fat. *p<0.05, **p<0.01, ***p<0.001, ****p<0.0001 by Student’s unpaired two-sided t-test for (a) and (b). Liver and heart values are reproduced from Fig. 3c for ease of comparison.
Extended Data Figure 5.
Extended Data Figure 5.. Quantification of western blots.
Liver, heart, and aorta tissue western blots for P3-injected (top half of each tissue set) and P14-injected mice (bottom half of each tissue set) were quantified by western blot. Samples from females appear in the left column, and samples from males are in the right column. Each lane represents the tissue type specified on the left taken from a different mouse. Control mice were treated with saline instead of ABE-AAV9. WT indicates C57BL/6 mouse lacking the transgene, showing that the antibody is specific to human lamin proteins and progerin. The abundance of lamin A or progerin protein relative to β-actin in saline- or ABE-treated mouse tissues was quantified by normalizing the fluorescence signal from the secondary antibody for each band (800 nm for progerin and lamins, and 680 nm for actin; see Methods). The normalized protein abundance relative to saline-treated samples (set to 100) is shown in the bar graphs. Control mice were treated identically to the corresponding ABE-treated mice except injected with saline instead of ABE-AAV9. Raw fluorescent signal for progerin protein measured at the 800nm wavelength (using licor,IRDye labeled antibody) displayed under each lane. Values and error bars represent mean±SD for n=5 or 6 biological replicates, as indicated. The n for each sample type is listed in each figure panel. *p<0.05, **p<0.01, ***p<0.001, ****p<0.0001 by Student’s unpaired two-sided t-test. Expected molecular weights: lamin A, 74 kDa; progerin, 69 kDa; lamin C, 65 kDa. Liver and heart blots are reproduced from Fig. 3c for ease of comparison. Complete blots are available in Supplementary Figure 1.
Extended Data Figure 6.
Extended Data Figure 6.. P3 RO saline- and ABE AAV9-injected male and female mouse aortic histology assessed by H&E and Movat’s staining.
(a) Representative aorta cross-sections for P3 RO saline- or ABE-AAV9-injected males at 6 months of age. Left images were stained with hematoxylin and eosin (H&E); right images were stained with Movat’s stain. (b) Representative aorta cross-sections for P3 RO saline- or ABE-AAV9-treated females at 6 months of age. Left images were stained with hematoxylin and eosin (H&E); right images were stained with Movat’s pentachrome. Unaffected WT are wild-type C57BL/6 mice. WT M2, 9609M, 9177M, WT F3, 9628F, and 9148F are replicated from the main figure for ease of comparison. These sections each represent replicates from different mice.
Extended Data Figure 7.
Extended Data Figure 7.. P14 RO saline- and ABE AAV9-injected male and female mouse aortic histology assessed by H&E and Movat’s staining.
(a) Representative aorta cross-sections for P14 RO saline- or ABE-AAV9-injected males at 6 months of age. Left images were stained with hematoxylin and eosin (H&E); right images were stained with Movat’s stain. (b) Representative aorta cross-sections for P14 RO saline- or ABE-AAV9-treated females at 6 months of age. Left images were stained with hematoxylin and eosin (H&E); right images were stained with Movat’s pentachrome. Unaffected WT are wild-type C57BL/6 mice, reproduced from Extended Data Fig. 9a,b for ease of comparison. Images from the following mice are reproduced from Fig. 4 for ease of comparison: WT M2, 9440M, 9459M, WT F3, 9536F, and 9535F. These sections each represent replicates from different mice.
Extended Data Figure 8.
Extended Data Figure 8.. C57BL/6 control, untreated homozygous human LMNA c.1824 C>T mice, P14 RO saline- and ABE AAV9-injected male and female aorta immunofluorescence staining.
Immunofluorescence staining of C57BL/6 (n=2), untreated P28 homozygous human LMNA c.1824 C>T (n=1), saline-treated homozygous human LMNA c.1824 C>T (n=4), and ABE-treated homozygous human LMNA c.1824 C>T (n=5) mouse aortas stained for human lamin A/C + DAPI or for progerin + DAPI. Scale bar=10 μm. Images from untreated 28 day-old, WT M1, 9424M, and 9464M are replicated from Fig. 4 for ease of comparison.
Extended Data Figure 9.
Extended Data Figure 9.. P3 RO saline- and ABE AAV9-injected male and female mouse skin histology assessed by H&E and Masson staining.
(a) Representative skin cross-sections for P3 RO saline-injected (left), ABE-AAV9-injected (middle), and wild-type C57BL/6 males at 6 months of age. Left images were stained with hematoxylin and eosin (H&E); right images were stained with Masson stain. (b) Representative skin cross-sections for P3 RO saline-injected (left), ABE-AAV9-injected (middle), and wild-type C57BL/6 females at 6 months of age. Left images were stained with hematoxylin and eosin (H&E); right images were stained with Masson stain. Unaffected WT are wild-type C57BL/6 mice. These sections each represent replicates from different mice.
Extended Data Figure 10.
Extended Data Figure 10.. P14 RO saline- and ABE AAV9-injected male and female skin histology assessed by H&E and Masson staining.
(a) Representative skin cross-sections for P14 RO saline-injected (left), ABE-AAV9-treated (middle), and wild-type C57BL/6 males at 6 months of age. Left images were stained with hematoxylin and eosin (H&E); right images were stained with Masson stain. (b) Representative skin cross-sections for P14 RO saline-injected (left), ABE-AAV9-treated (middle), and wild-type C57BL/6 females at 6 months of age. Left images were stained with hematoxylin and eosin (H&E); right images were stained with Masson stain. Unaffected WT are wild-type C57BL/6 mice, reproduced from Extended Data Figure 12a,b for ease of comparison. These sections each represent replicates from different mice.
Extended Data Figure 11.
Extended Data Figure 11.. P3 RO and P14 RO saline- and ABE-AAV9-injected mouse weights.
Weights of homozygous human LMNA c.1824 C>T mice taken across animal lifespans for cohorts of P3 RO (left) and P14 RO (right) saline- and ABE-AAV9-injected cohorts. Mouse weights are shown by gender. The X-axis shows days post-injection, rather than age. Values and error bars represent mean±SD for the number of surviving mice at each time point, complete data can be accessed in Supplementary Data 5.
Extended Data Figure 12.
Extended Data Figure 12.. Whole-genome sequencing analysis of single-nucleotide variants and indels from mouse tissue samples, and quantification of RAB25 transcript levels in mouse tissue samples.
(a) Distribution of all possible single-nucleotide variant (SNV) types in non-tumor liver tissue and liver tumor tissue samples isolated from ABE AAV9-injected and saline-injected mice. Values from individual tissue samples are shown on the left. Aggregated values from all AAV-injected mouse tumor tissue samples, all AAV-injected mouse liver tissue samples, and all saline-injected mouse liver tissue samples are shown on the right, where values represent the mean of each sample type and error bars reflect the standard deviation with each tissue section treated as a different sample: AAV-injected tumor tissue (n=7), AAV-injected liver tissue (n=6), and saline-injected liver tissue (n=2). (b) Genomic classification of A•T-to-G•C SNVs. Values from individual tissue samples are shown on the left. Aggregated values from AAV-injected mouse tumor tissue samples, AAV-injected mouse liver tissue samples, and saline-injected mouse liver tissue samples from all tissue types are shown on the right, where values represent the mean of each sample type and error bars reflect the standard deviation with each tissue section treated as a different sample: AAV-injected tumor tissue (n=7), AAV-injected liver tissue (n=6), saline-injected liver tissue (n=2). (c) A•T-to-G•C SNVs and indels found in or near genes that are recurrently mutated in human liver cancers, including introns, exons, and at ATAC-seq-defined cis-regulatory regions within 100-kb of each gene’s transcription start site, in AAV-injected mouse tumor tissue samples, AAV-injected mouse liver tissue samples, and saline-injected mouse liver tissue samples. Values represent the mean of individual tissue samples and error bars represent standard deviation. Individual data points are shown for each sample. The complete list of SNVs from ANNOVAR analysis is provided as Supplementary Data 6. Summary statistics for SNV calls are in Supplementary Data 2. (d) RNA isolated from mouse liver tissue samples was reverse transcribed and amplified with primer sets specific to mouse Gapdh (detected with Cy5), mouse Actb (detected with Cy5.5), and human RAB25 (detected with TEX 615). Ct values were determined by quantitative PCR and are shown below each lane. N.D. = not detected.
Figure 1.
Figure 1.. ABE-mediated correction of the LMNA c.1824 C>T mutation in progeria patient-derived cell lines.
(a) The LMNA c.1824 C>T mutation potentiates a cryptic splice site in exon 11 of the LMNA gene, resulting in the pathogenic progerin protein. (b) LMNA c.1824 nucleotide identity in HGADFN167 and HGADFN188 patient-derived cells untreated or treated with ABE7.10max-VRQR lentivirus after 10 or 20 days. Values and error bars reflect mean±SD of five technical replicates. (c) Quantification by digital droplet PCR (ddPCR) of LMNA, progerin, and LMNC (a normal alternative splice form) transcripts in untreated cells, cells 10 or 20 days after ABE lentivirus treatment, and cells from an unaffected parent. Gene expression levels were normalized to transferrin receptor (TRFC) expression levels. Data from the unaffected parent is shown in both graphs for ease of comparison. Values and error bars reflect mean±SD of three technical replicates. (d) Western blot of cells from an unaffected parent, HGADFN167 cells, or HGADFN188 cells untreated or 20 days after ABE lentiviral treatment using the JOL2 antibody specific for human lamin A, progerin, and lamin C. Complete blots with molecular weight markers are available in Supplementary Figure 1. Additional replicates are provided in Extended Data Fig. 1. (e) Nuclear morphology of cells stained with a lamin A-specific antibody, with a progerin-specific antibody, or with DAPI. Scale bar=20 μm. Additional replicates were not performed. (f) Frequency of morphologically abnormal nuclei in samples of cells shown in (e). Values and error bars reflect mean±SD from three counts of independent images from the experiment in (e). *p<0.05, **p<0.01, ***p<0.001, ****p<0.0001 by Student’s unpaired two-sided t-test.
Figure 2.
Figure 2.. Off-target DNA and RNA editing analysis and gene expression changes upon ABE7.10max-VRQR treatment of progeria patient-derived fibroblasts.
(a) DNA sequencing for the top 32 CIRCLE-seq-identified candidate off-target loci from HGADFN167 and HGADFN188 progeria patient-derived cells 20 days post-treatment with lentiviral ABE. (b) Uncorrected LMNA transcript frequency by RNA-seq in unaffected parental cells, untreated patient-derived cells, and ABE lentivirus-treated cells 10 or 20 days post-treatment. Values and error bars reflect mean±SD of three technical replicates. (c) Transcriptome-wide cellular A-to-I RNA editing levels in unaffected parental cells, untreated patient-derived cells, and in ABE lentivirus-treated cells 10 or 20 days post-treatment. Values and error bars reflect mean±SD of three technical replicates. (d) Heatmap of Z-scores for the top 100 differently expressed genes between unaffected control fibroblasts (Coriell and the Mateos dataset; see Methods) and untreated or lentiviral ABE-treated progeria patient-derived cells. Expression Z-scores across each gene are scaled so mean expression=0 and SD=1. Samples and genes are ordered by hierarchical clustering. Progeria patient-derived cells treated with lentiviral ABE for 10 and 20 days cluster with unaffected fibroblasts. (e) Gene ontology molecular function analysis of differentially-expressed genes. The 19 most significantly enriched gene sets in the Broad Institute molecular signatures database were identified between differentially-expressed genes in WT cells (Mateos, Coriell, and unaffected parent), disease cells (untreated HGADFN167 and HGADFN188), and treated cells (lentiviral ABE-treated HGADFN 167 and 188 at 10 and 20 days). A heat map of log2 FDR values for these 19 gene sets is shown, with overexpressed gene sets in red and underexpressed gene sets in blue.
Figure 3.
Figure 3.. Pathogenic DNA, RNA, and protein correction from a single in vivo ABE-AAV9 injection of a mouse model of human progeria.
(a) Dual AAV9 encoding split-intein ABE7.10max-VRQR base editor halves and the LMNA-targeting sgRNA were injected into progeria mice. P3 retro-orbital (RO) injections (5×10¹⁰ of each AAV vg, 1×10¹¹ vg total), P14 RO injections (5×10¹¹ vg of each AAV vg, 1×10¹² vg total), or P14 intraperitoneal (IP) injections (5×10¹¹ vg of each AAV, 1×10¹² vg total) were administered. (b) DNA editing efficiencies correcting LMNA c.1824 from T (pathogenic) to C (wild-type) for P3 RO-injected mice (left) or P14 RO-injected mice (right) in 6-week- or 6-month-old mice. Editing in P14 IP-injected mice is in Extended Data Fig. 3a. (c) ddPCR counts for human LMNA (grey bars) and progerin (red bars) RNA transcript abundance in P14 RO saline- or ABE-AAV9-injected mice in liver and heart. See Extended Data Fig. 4 for additional data. (d) Western blot analysis of human lamin A, progerin, and lamin C proteins in liver and heart of P14 RO saline- or ABE-AAV9-injected mice. Each lane shows tissue from a different mouse. WT is a C57BL/6 mouse lacking the transgene, showing that the antibody is specific to human lamin proteins. See Extended Data Fig. 5 for additional data. Values and error bars represent mean±SD for the indicated number of biological replicates. *p<0.05, **p<0.01, ***p<0.001, ****p<0.0001 by Student’s unpaired two-sided t-test.
Figure 4.
Figure 4.. Aortic histopathology and lifespan of progeria mice following a single in vivo ABE-AAV9 injection.
(a) Representative aorta cross-sections from 6-month-old mice showing vascular smooth muscle cell (VSMC) nuclei and adventitia in saline- or ABE-AAV9-treated mice injected at P3 or P14. Upper images were stained with hematoxylin and eosin (H&E); lower images were stained with Movat’s pentachrome. Red arrows emphasize decreased VSMC counts and adventitial fibrosis; green arrows indicate preserved VSMC counts and less adventitial fibrosis. P3 and C57BL/6 scale bar=100 μm, P14 scale bar=200 μm. Additional replicates are shown in Extended Data Figs. 6 and 7. (b) Quantification of VSMC nuclei counts and adventitia area in mouse cohorts. Values and error bars reflect mean±SD of n=12 (P3 saline), n=10 (P3 ABE-AAV9, P14 saline, and P14 ABE-AAV9), or n=8 (WT) replicates. Data from WT samples are shown in both graphs for ease of comparison. Replicates analyzed are provided in Extended Data Figs. 6 and 7. (c) Representative fixed aortas stained for human lamin A/C + DAPI and progerin + DAPI for untreated progeria mice at P28 (i and ii), wild-type C57BL/6 mice at 6 months (iii and iv), saline-injected progeria mice at 6 months (v and vi), and ABE-treated progeria mice at 6 months (vii and viii). Autofluorescent elastin fibers in the tunica media appear as wavy lines. Scale bar=10 μm. Additional replicates are shown in in Extended Data Fig. 8. (d) Kaplan-Meier curve for P3 RO saline- and ABE-AAV9-injected progeria mice. Median lifespans: P3 saline-injected mice=189 days, P3 ABE-AAV9-injected mice=337 days (1.8-fold longer, p<0.0001). (e) Kaplan-Meier curve for P14 RO saline- and ABE-AAV9-injected progeria mice. Median lifespans: P14 saline-injected mice=215 days, P14 ABE-AAV9-injected mice=510 days (2.4-fold longer, p<0.0001). *p<0.05, **p<0.01, ***p<0.001, ****p<0.0001 by Student’s unpaired two-sided t-test for (b). Mantel-Cox test for (d) and (e).

Comment in

References

    1. Eriksson M et al. Recurrent de novo point mutations in lamin A cause Hutchinson-Gilford progeria syndrome. Nature 423, 293–298, doi: 10.1038/nature01629 (2003). - DOI - PMC - PubMed
    1. De Sandre-Giovannoli A et al. Lamin a truncation in Hutchinson-Gilford progeria. Science 300, 2055, doi: 10.1126/science.1084125 (2003). - DOI - PubMed
    1. Gordon LB et al. Impact of farnesylation inhibitors on survival in Hutchinson-Gilford progeria syndrome. Circulation 130, 27–34, doi: 10.1161/CIRCULATIONAHA.113.008285 (2014). - DOI - PMC - PubMed
    1. Gordon LB, Brown WT & Collins FS Hutchinson-Gilford progeria syndrome. GeneReviews (2019).
    1. Gaudelli NM et al. Programmable base editing of A•T to G•C in genomic DNA without DNA cleavage. Nature 551, 464–471, doi: 10.1038/nature24644 (2017). - DOI - PMC - PubMed

Publication types

MeSH terms