. 2021 Feb;590(7846):473-479.
doi: 10.1038/s41586-020-03116-4. Epub 2021 Jan 6.

Gut-licensed IFNγ+ NK cells drive LAMP1+TRAIL+ anti-inflammatory astrocytes

Affiliations

Gut-licensed IFNγ+ NK cells drive LAMP1+TRAIL+ anti-inflammatory astrocytes

Liliana M Sanmarco et al. Nature. 2021 Feb.

Abstract

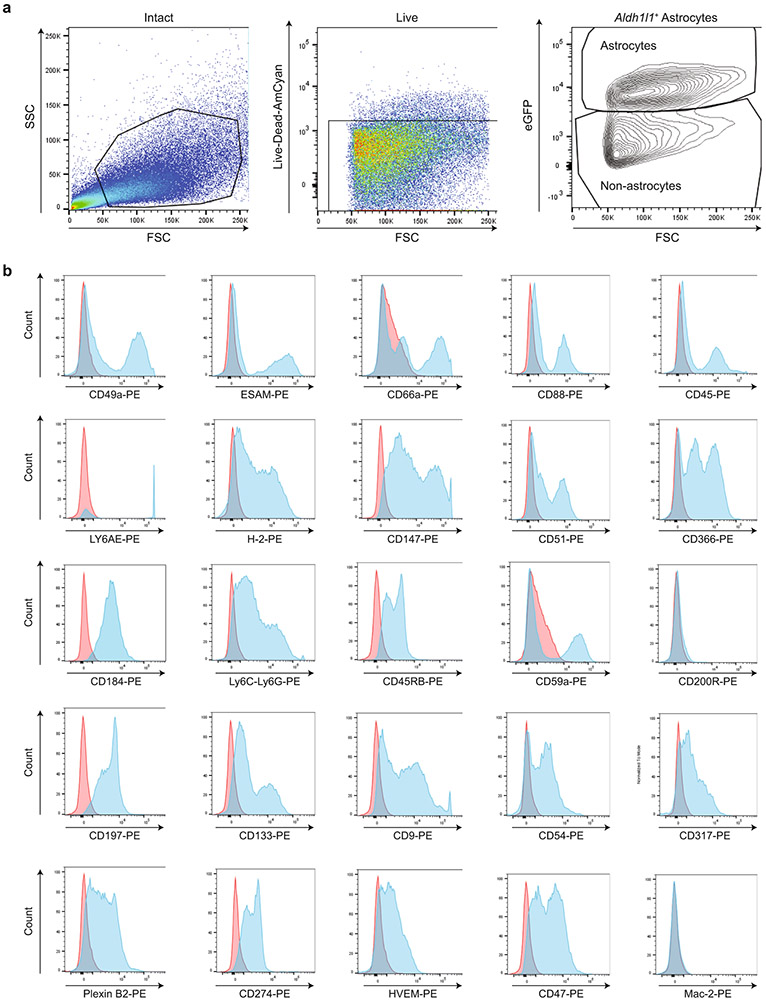
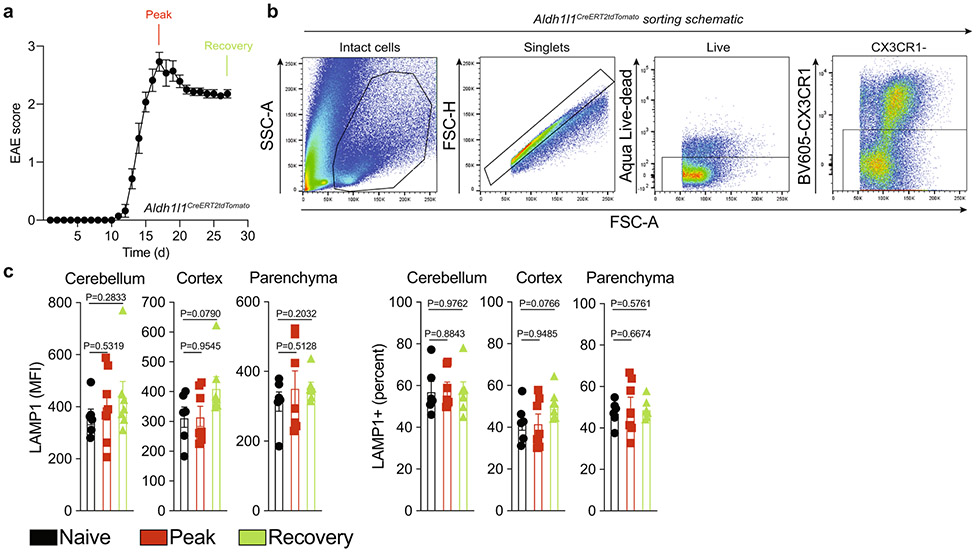
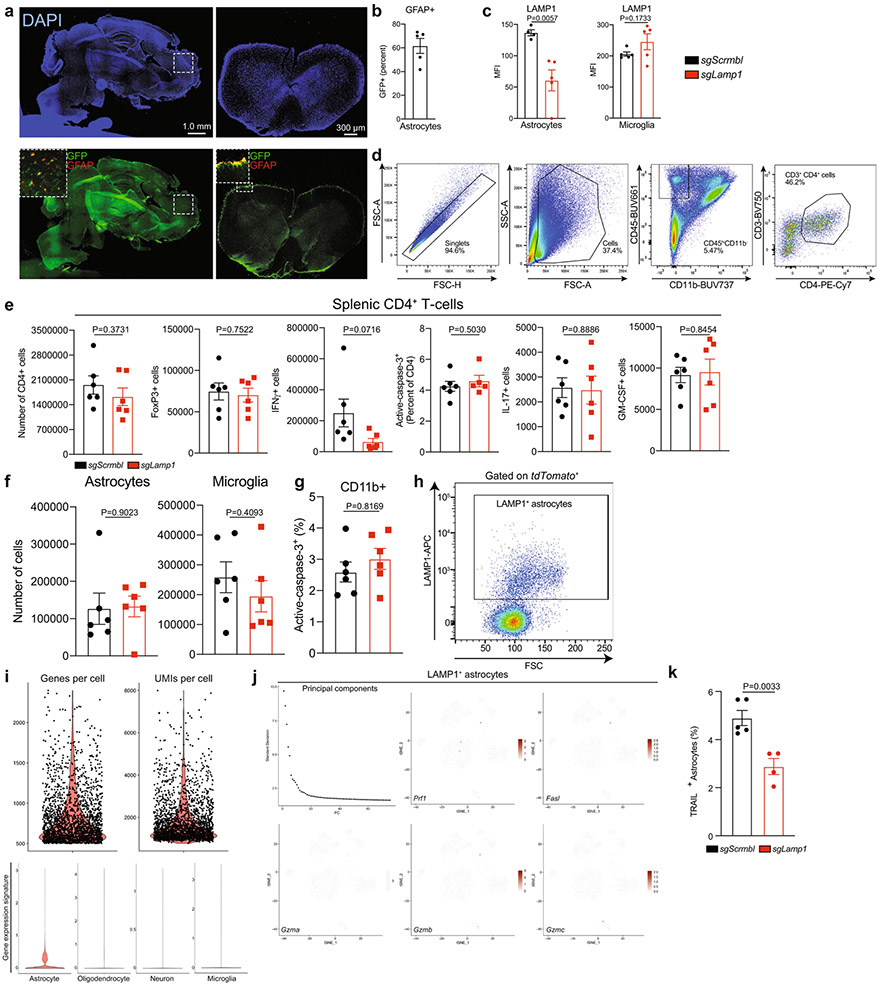
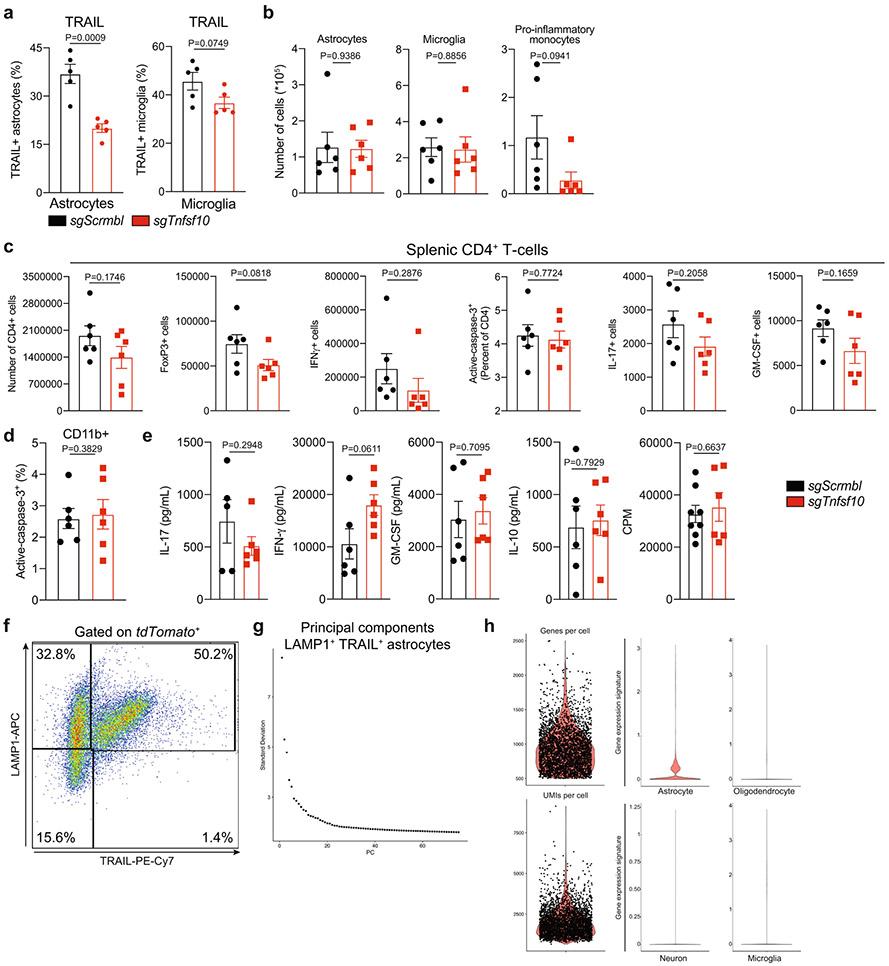
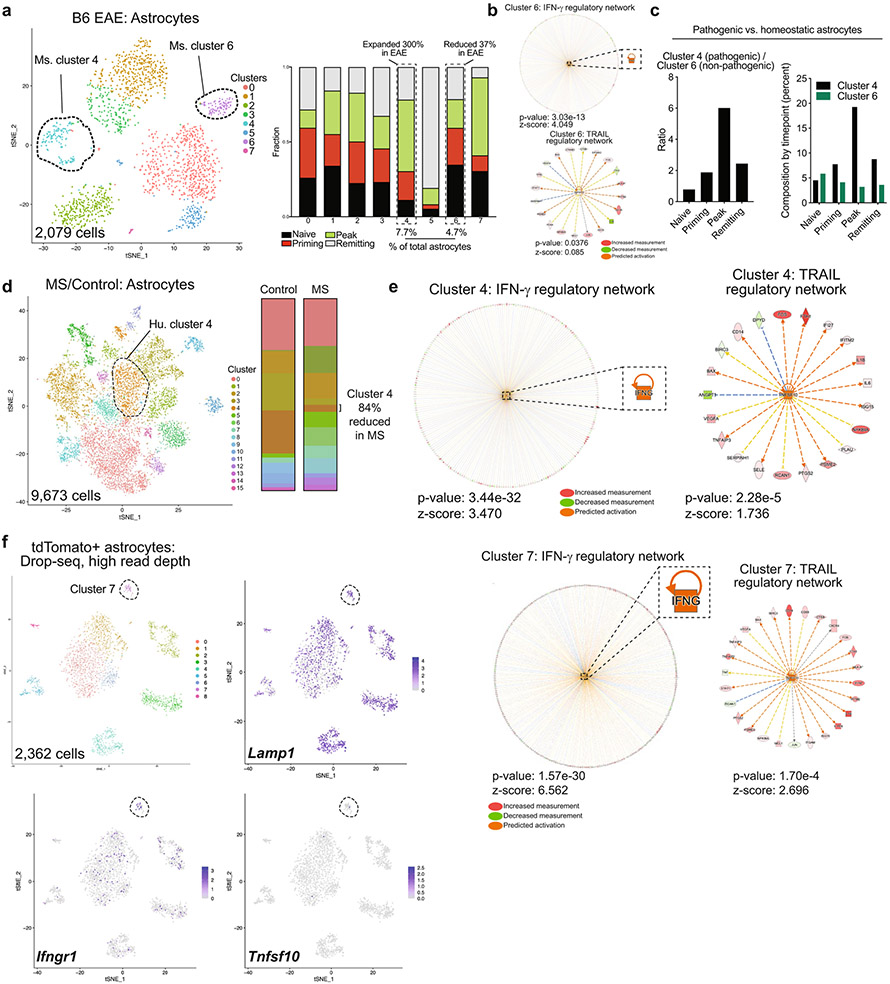
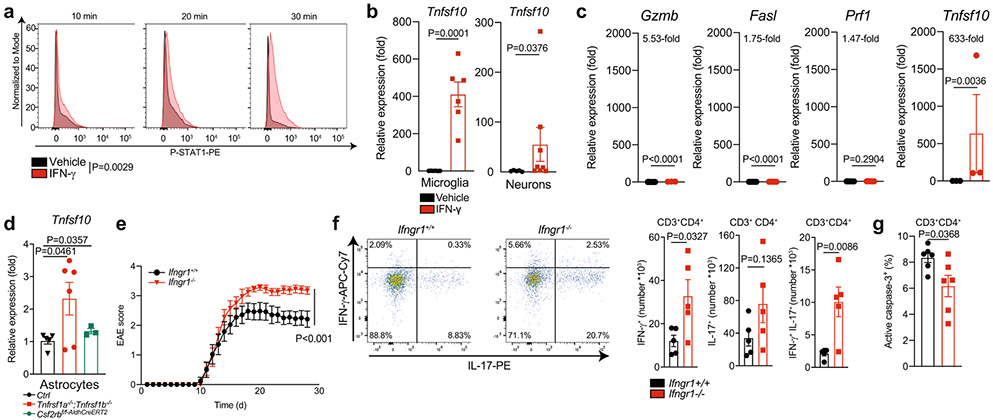
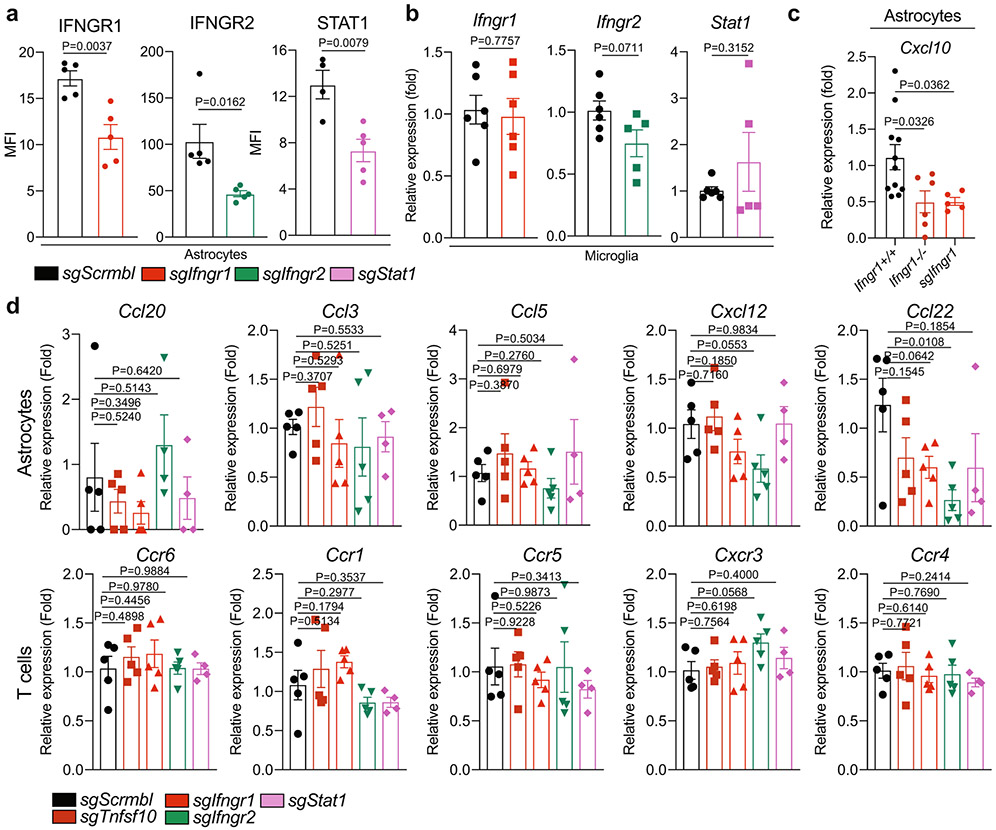
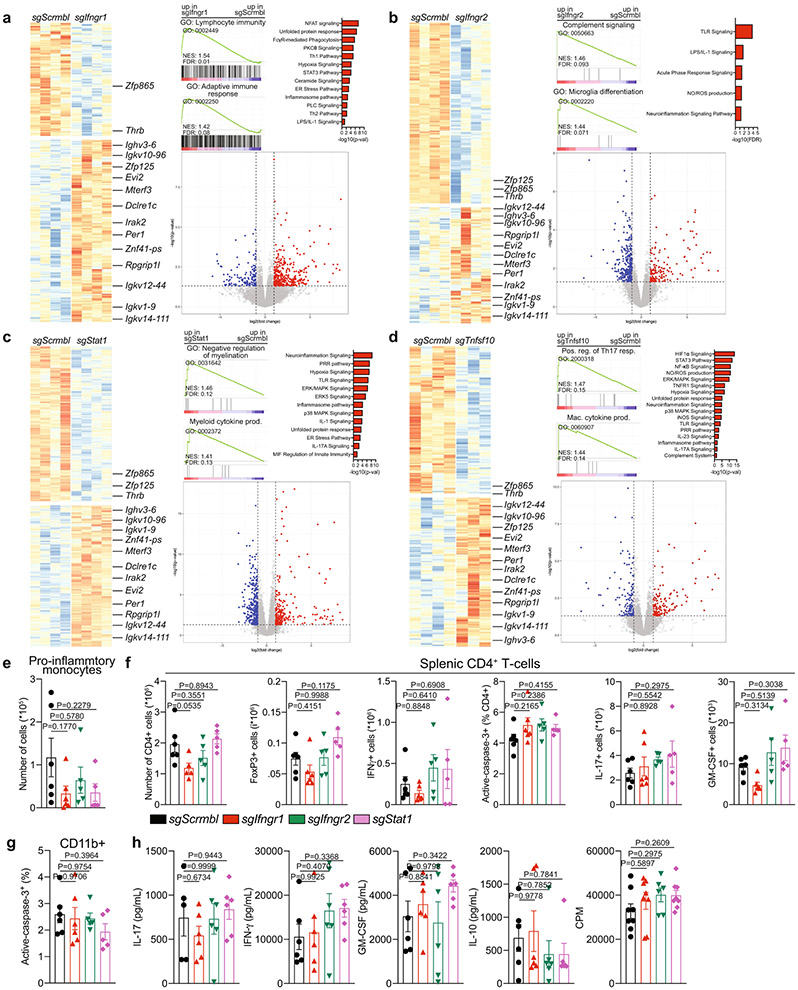
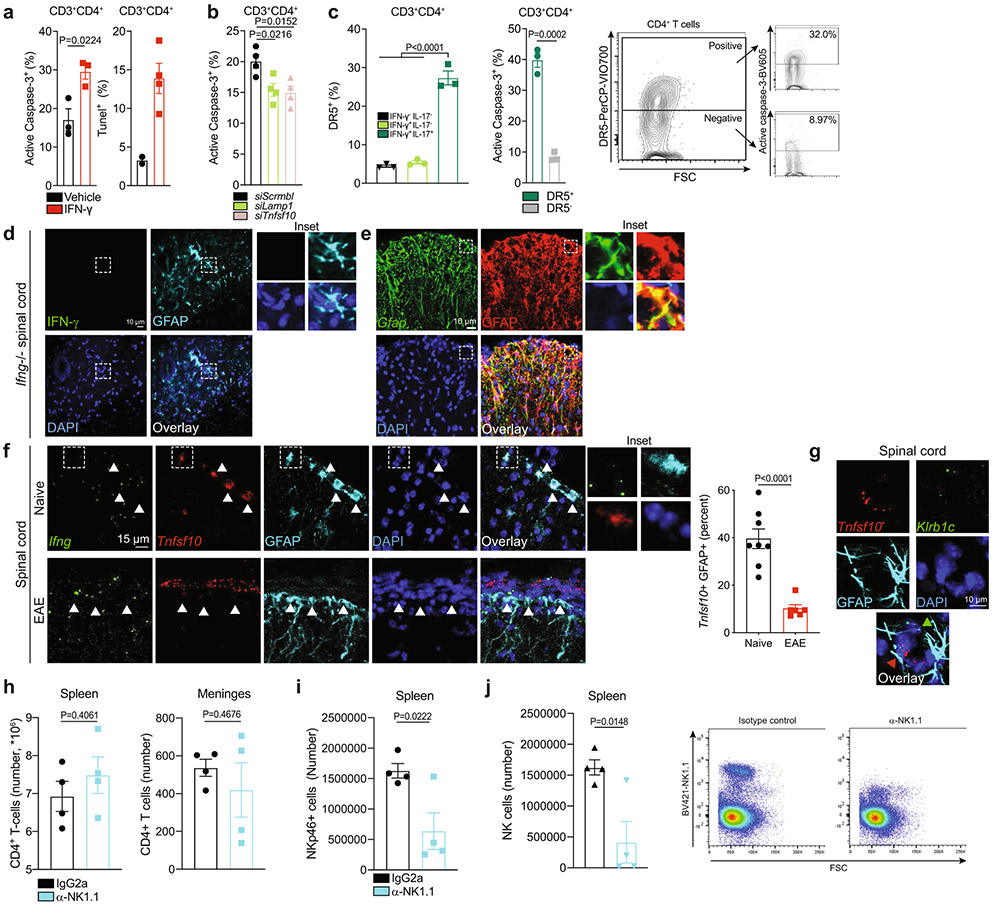
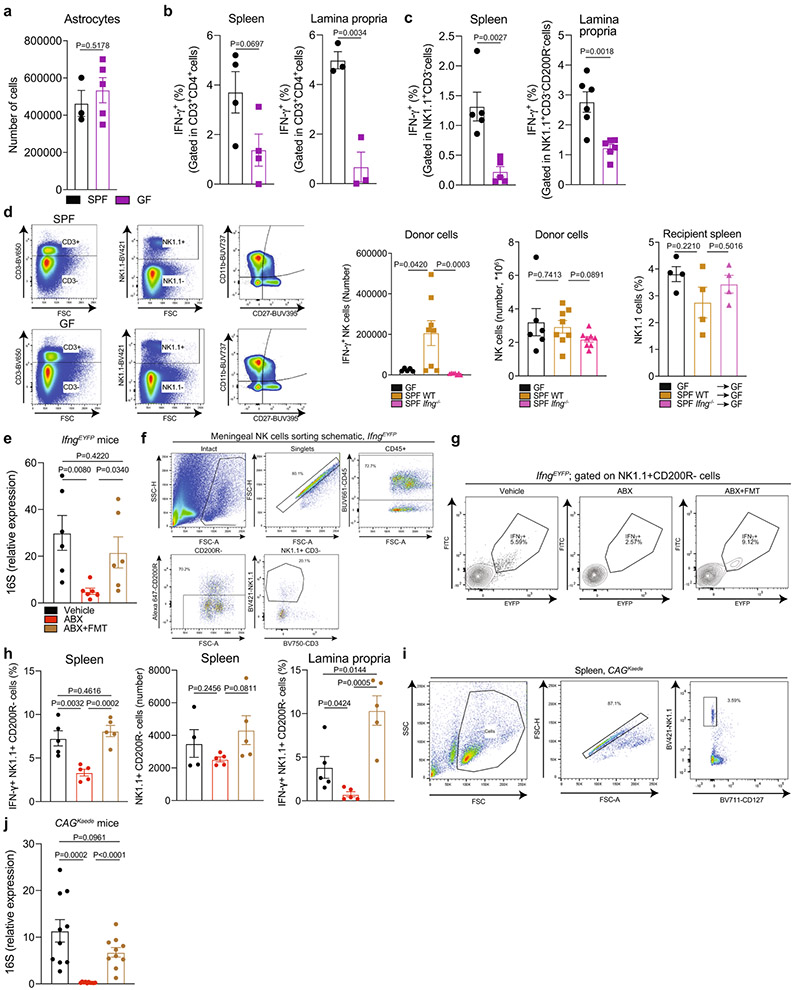
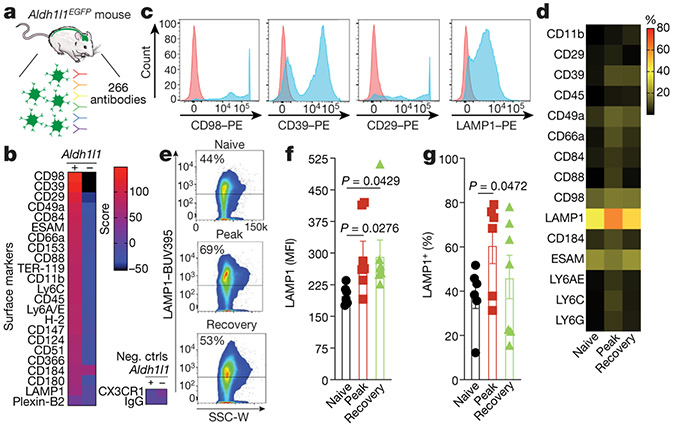
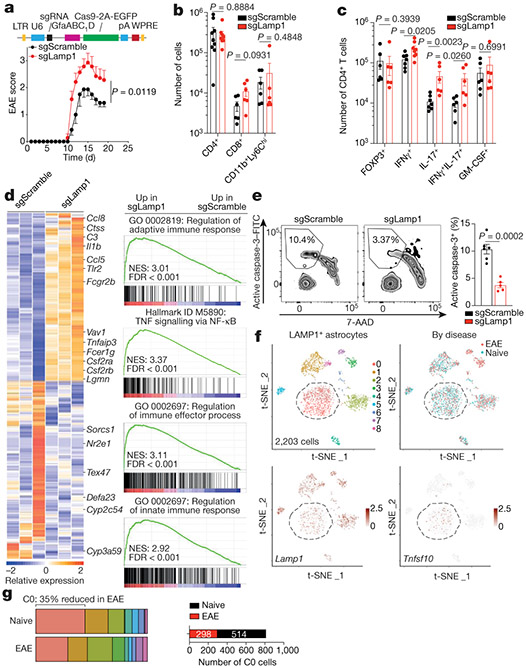
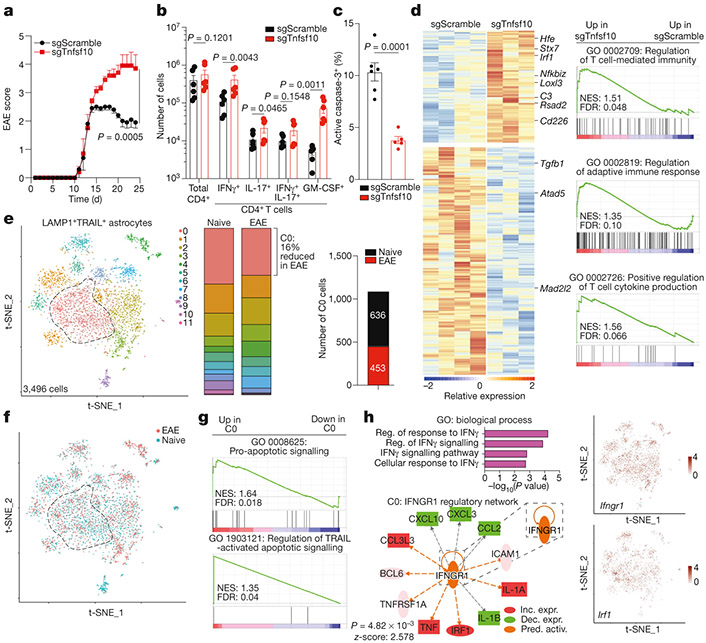
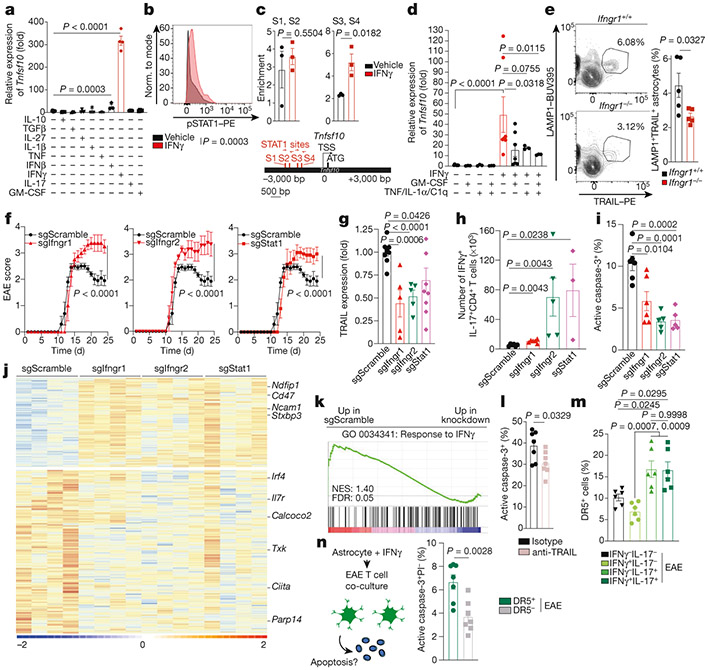
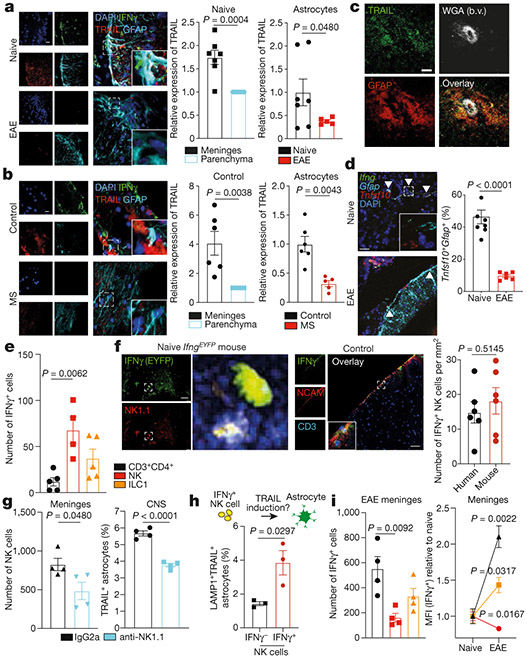
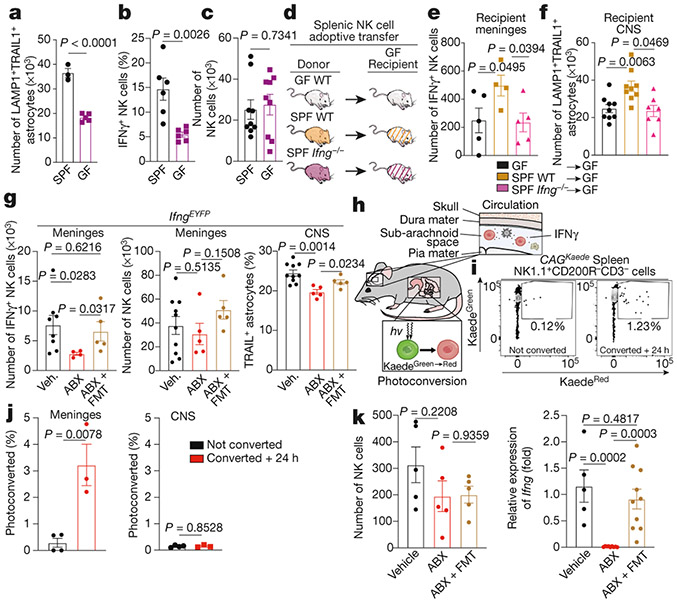
Astrocytes are glial cells that are abundant in the central nervous system (CNS) and that have important homeostatic and disease-promoting functions1. However, little is known about the homeostatic anti-inflammatory activities of astrocytes and their regulation. Here, using high-throughput flow cytometry screening, single-cell RNA sequencing and CRISPR-Cas9-based cell-specific in vivo genetic perturbations in mice, we identify a subset of astrocytes that expresses the lysosomal protein LAMP12 and the death receptor ligand TRAIL3. LAMP1+TRAIL+ astrocytes limit inflammation in the CNS by inducing T cell apoptosis through TRAIL-DR5 signalling. In homeostatic conditions, the expression of TRAIL in astrocytes is driven by interferon-γ (IFNγ) produced by meningeal natural killer (NK) cells, in which IFNγ expression is modulated by the gut microbiome. TRAIL expression in astrocytes is repressed by molecules produced by T cells and microglia in the context of inflammation. Altogether, we show that LAMP1+TRAIL+ astrocytes limit CNS inflammation by inducing T cell apoptosis, and that this astrocyte subset is maintained by meningeal IFNγ+ NK cells that are licensed by the microbiome.


Figures

Extended Data Fig. 1 ∣
Extended Data Fig. 1 ∣. Profiling of astrocyte surface markers.
a, Sample FACS gating strategy. b, Histogram depicting the expression of surface markers in astrocytes.
Extended Data Fig. 2∣
Extended Data Fig. 2∣. Analysis of differentially expressed astrocyte surface markers.
a, EAE in Aldh1l1creERT2tdTomato mice. n = 6 naive, n = 7 peak, n = 7 recovery mice. b, Sorting schematic for tdTomato+ astrocytes. c, MFI of LAMP1 expression from screening. n = 6 naive, n = 7 peak, n = 7 recovery mice. Unpaired two-tailed t-test. Data are mean ± s.e.m.
Extended Data Fig. 3 ∣
Extended Data Fig. 3 ∣. Analysis of LAMP1+ astrocytes.
a, Immunostaining of brain and spinal cord of mice transduced with Gfap-driven Cas9-2A-EGFP lentivirus. Representative images from n = 5 mice analysed. b, Percentage of GFP+GFAP+ cells by FACS. n = 5 mice. c, Quantification of astrocyte LAMP1 knockdown in astrocytes and microglia by FACS. n = 4 mice (sgScramble astrocyte); n = 5 mice otherwise. Unpaired two-tailed t-test. d, Gating strategy of CD4+ T cells from CNS. e, Analysis of splenic T cells from sgScramble- or sgLamp1-transduced mice. n = 5 mice sgLamp1 active-caspase 3; n = 6 mice otherwise. Unpaired two-tailed t-test. f, Analysis of CNS cells isolated from sgScramble- or sgLamp1-transduced mice. n = 6 per group. Unpaired two-tailed t-test. g, Analysis of CD11b+ cell apoptosis in sgScramble- or sgLamp1-transduced mice. n = 6 per group. Unpaired two-tailed t-test. h, Example gating used to sort LAMP1+ astrocytes from Aldh1l1creERT2tdTomato mice for scRNA-seq. i, Violin plots of genes, UMIs and cell-type markers for cells analysed by scRNA-seq from naive and EAE mice 17 days after induction. Astrocyte markers include Aqp4, Aldh1l1, Gfap, S100b, Aldoc, Slc1a3, Slc1a2 and Mfge8. j, Principal components used and gene expression scatterplots of LAMP1+ astrocytes isolated from Aldh1l1creERT2tdTomato mice. k, TRAIL expression on astrocytes from sgScramble- and sgLamp1-transduced mice 28 days after EAE induction. n = 5 sgScramble, n = 4 sgLamp1 mice. Unpaired two-tailed t-test. Data are mean ± s.e.m.
Extended Data Fig. 4 ∣
Extended Data Fig. 4 ∣. Analysis of TRAIL+ astrocytes.
a, Quantification of TRAIL knockdown using FACS in astrocytes and microglia. n = 5 mice per group. Unpaired two-tailed t-test. b, Analysis of CNS cell numbers in sgScramble- or sgTnfsf10-transduced mice. n = 6 mice per group. Unpaired two-tailed t-test. c, Control analyses of splenic T cells from knockdown mice. n = 6 mice per group. Unpaired two-tailed t-test. d, Analysis of CD11b+ cell apoptosis in sgScramble- or sgTnfsf10-transduced mice. n = 6 mice per group. Unpaired two-tailed t-test. e, Cytokine production and recall response of splenic T cells isolated from knockdown mice. n = 6 mice per group. n = 8 sgScramble CPM, n = 5 sgScramble IL-17 mice. Unpaired two-tailed t-test. f, Sorting schematic of LAMP1+TRAIL+ astrocytes from Aldh1l1creERT2tdTomato mice for scRNA-seq. g, Principal components used in scRNA-seq analysis of LAMP1+TRAIL+ astrocytes isolated from Aldh1l1creERT2tdTomato mice from naive and EAE mice at 17 days after induction. h, Violin plots of genes, UMIs and cell-type markers for cells analysed. Astrocyte markers include Aqp4, Aldh1l1, Gfap, S100b, Aldoc, Slc1a3, Slc1a2and Mfge8. Data are mean ± s.e.m.
Extended Data Fig. 5 ∣
Extended Data Fig. 5 ∣. IFNγ–TRAIL signalling in other datasets.
a, b, Identification of an IFNγ–TRAIL signalling network in a population of mouse astrocytes (cluster 6) previously analysed during the course of EAE in a previous study. c, Comparison of the relative abundance of homeostatic vs pathogenic glia over the course of EAE. Compared to a pathogenic astrocyte population, astrocytes regulated by IFNγ and characterized by TRAIL are de-enriched during EAE. d, e, Identification of an IFNγ–TRAIL signalling network in a patient with MS or control astrocytes previously analysed by scRNA-seq during MS in a previous study. n = 25 mice. n = 48 humans. f, Analysis by Drop-seq of tdTomato+ astrocytes isolated by flow cytometry. Data shown as mean ± s.e.m.
Extended Data Fig. 6 ∣
Extended Data Fig. 6 ∣. IFNγ signalling in LAMP1+TRAIL+ astrocytes.
a, STAT1 phosphorylation determined by flow cytometry in mouse astrocytes in culture treated with IFNγ or vehicle. n = 4 per condition. Unpaired two-tailed t-test. Experiment repeated three times. b, Analysis of Tnfsf10 expression in primary microglia and neurons in response to IFNγ. n = 8 for neuron IFNγ-treated, n = 5 neuron veh, n = 6 otherwise. Unpaired two-tailed t-test, data log-normalized for neuron Tnfsf10. c, Analysis of other apoptosis-promoting molecules expressed by astrocytes. n = 14 Fasl vehicle; n = 13 Gzmb vehicle; n = 12 Prf1 vehicle.; n = 7 Fasl IFNγ; n = 7 Prf1 IFNγ; n = 3 Gzmb IFNγ; n = 3 for Tnfsf10. Unpaired two-tailed t-test. Tnfsf10 data In-transformed. Note the consistent axis scale. d, Analysis of Tnfsf10 expression by qPCR in astrocytes isolated from mice null for the indicated genes 29 days after EAE induction. n = 5 Ctrl, n = 3 csf2rbf/f-Aldh1l1creERT2, n = 6 Tnfrsf1a−/−;Tnfrsflb−/−mice. Unpaired two-tailed t-test (Tnfrsf1a−/−;Tnfrsf1b−/−) and Mann–Whitney test (Csf2rbf/f-Aldh1l1creERT2). e, EAE in Ifngr1+/+ (n = 12 mice) or Ifngr1−/− (n = 10 mice). Two-way repeated measures ANOVA. f, Flow cytometry analysis of T cells in the CNS of Ifngr1+/+ or Ifngr1−/− mice. n = 5 mice per group. Unpaired two-tailed t-test. g, Caspase-3 activation in CD4+ T cells isolated from the CNS of Ifngr1+/+ or Ifngr1−/− mice. n = 6 per group. Unpaired two-tailed t-test. Data are mean ± s.e.m.
Extended Data Fig. 7 ∣
Extended Data Fig. 7 ∣. Effects of astrocyte-specific knockdown of IFNγ signalling.
a, Knockdown analyses by FACS of mice transduced with sgScramble, sgIfngr1, sgIfngr2 and sgStat1. n = 5 mice per group. n = 4 sgScramble STAT1 mice. Unpaired two-tailed t-test. b, Control analyses of microglial expression following astrocyte knockdown. n = 5 sgIfngr2, n = 5 sgStat1, n = 6 mice otherwise. Unpaired two-tailed t-test. c, Analysis of Cxcl10 expression in astrocytes isolated from Ifngr1+/+, Ifngr1−/− or sgIfngr1 mice 29 days after EAE induction. n = 11 Ifngr1+/+, n = 6 Ifngr1−/−, n = 5 sgIfngr1. Unpaired two-tailed t-test. d, Analysis of astrocyte chemokine and T cell chemokine receptor expression from knockdown mice 29 days after EAE induction. n = 4 sgStat1, n = 4 sgIfngr2 Ccl20, n = 5 mice otherwise. Unpaired two-tailed t-test per condition. Data are mean ± s.e.m.
Extended Data Fig. 8 ∣
Extended Data Fig. 8 ∣. Microglia monocyte, and peripheral T cell responses to astrocyte perturbation.
ad, Bulk RNA-seq analyses of microglia (CD11b+CD45+Ly6Clow) isolated by flow cytometry from mice transduced with the indicated astrocyte-targeting CRISPR–Cas9 lentivirus 24 days after EAE induction. Heat map of differentially expressed genes, GSEA analysis, Qiagen IPA and volcano plot shown per group. n = 4 mice per group, n = 3 mice for sgTnfsf10. e, Control analyses of CNS-recruited pro-inflammatory monocytes. n = 6 sgScramble, sgIfngr1; n = 5 mice otherwise. One-way ANOVA, Sidak post-hoc test. f, Control analyses of splenic T cells. n = 6 sgScramble, sgIfngr1; n = 5 sgIfngr1 CD4+, n = 5 mice otherwise. One-way ANOVA, Dunnett post-hoc test. g, Analysis of active-caspase 3 expression in CD11b+ cells. n = 6 sgScramble, sgIfngr1; n = 5 mice otherwise. One-way ANOVA, Dunnett post-hoc test. h, Cytokine production and recall response of splenic T cells isolated from knockdown mice. n = 6 per group. n = 5 sgScramble IL-17, n = 8 sgScramble, sgIfngr1, sgStat1 CPM mice. One-way ANOVA, Dunnett post-hoc test. Data are mean ± s.e.m.
Extended Data Fig. 9 ∣
Extended Data Fig. 9 ∣. Control analyses of in vitro apoptosis and anti-NK1.1 antibody depletion.
a, Active caspase-3 and TUNEL FACS analysis In CD4+ T cells co-cultured with astrocytes pre-treated with vehicle or IFNγ. n = 3 for active-caspase 3, n = 2 for TUNEL vehicle, n = 4 for TUNEL IFNγ. Unpaired two-tailed t-test. b, Active caspase-3 expression in CD4+ T cells co-cultured with astrocytes transfected with the indicated siRNA. n = 4 per condition. Unpaired two-tailed t-test. c, Left, DR5 expression in cultured IFNγ+, IFNγ+IL-17+ and IFNγIL-17 CD4+ T cells activated in vitro. n = 3 per group. One-way ANOVA, Dunnett post-hoc test. Right, active-caspase 3 expression in DR5+ or DR5 CD4+ T cells co-cultured with IFNγ-pre-treated astrocytes. n = 3 per group. Unpaired two-tailed t-test. d, Negative control images of IFNγ immunostaining using Ifng−/− mice. Repeated twice. e, Fluorescent in situ hybridization (FISH) of Gfap co-stained with anti-GFAP antibody. Repeated three times. f, FISH of Tnfsf10 and Ifng in naive or EAE mouse spinal cord co-stained with anti-GFAP antibody. n = 8 images (naive), n = 6 images (EAE). Unpaired two-tailed t-test. Repeated three times. g, FISH of Ifng, Tnfsf10, and Klrb1c in naive or EAE mouse spinal cord. Green arrowhead, NK cell; red arrowhead, astrocyte. Repeated twice. h, Control analyses for anti-NK1.1 antibody depletion experiment. n = 4 per group. Unpaired two-tailed t-test. i, Quantification of splenic NKp46+ cells during α-NK1.1 antibody depletion experiment. n = 4 per group. Unpaired two-tailed t-test. j, Quantification of NK1.1+CD200RȒ NK cells in the spleen during α-NK1.1 antibody depletion experiment. n = 4 per group. Unpaired two-tailed t-test. Data are mean ± s.e.m.
Extended Data Fig. 10 ∣
Extended Data Fig. 10 ∣. Control analyses of microbial regulation of NK cells and astrocytes.
a, Quantification of astrocytes from SPF (n = 3) or GF (n = 5) mice. Unpaired two-tailed t-test. b, Quantification of CD4+ T cells in SPF and GF mice. Splenic T cells: n = 4 per group; lamina propria T cells: n = 3 per group. Unpaired two-tailed t-test. c, IFNγ+ NK cells in spleen and lamina propria of SPF and GF mice. n = 5 per group (spleen), n = 6 per group (lamina propria). Unpaired two-tailed t-test. d, Sorting schematic (left) and splenic cell numbers (right) from donors and recipients in NK cell adoptive transfer experiments. Quantification left-to-right: glow cytometry quantification of splenic IFNγ+ NK cells from donor mice. n = 5 GF, n = 8 SPF WT, n = 7 SPF Ifng−/− mice. Total number of NK cells from donor mice. n = 6 GF, n = 8 mice otherwise. Unpaired two-tailed t-test. Total number of NK cells in recipient spleens: n = 4 mice per group. One-way ANOVA, Tukey’s post-hoc test. e, Analysis by qPCR of 16S rRNA abundance as a function of two-week antibiotic treatment (ABX) and ABX treatment followed by faecal microbiota transplant (FMT) in IfngEYFP mice. n = 6 mice per group. Unpaired two-tailed t-test. f, Gating schematic for the meninges of IfngEYFP mice. g, FACS plots of IFNγ expression during three-week antibiotic depletion of commensal bacteria (ABX) or two-week ABX followed by 1-week reconstitution by faecal microbiota transplant (FMT) using IfngEYFP reporter mice. h, Analysis of NK cells in the spleen and lamina propria as a function of ABX and ABX + FMT treatment using IfngEYFP reporter mice. n = 6 mice for total NK cells ABX and ABX + FMT, n = 10 mice for vehicle meninges condition, n = 5 mice otherwise. Unpaired two-tailed t-test. i, Gating schematic of NK cell sorting from the spleen of CAGKaede mice. j, Analysis by qPCR of bacterial 16S rRNA abundance as a function of ABX and ABX + FMT in CAGKaede mice. n = 9 mice per group. Unpaired two-tailed t-test. Data are mean ± s.e.m.
Fig. 1 ∣
Fig. 1 ∣. Profiling astrocyte surface markers in EAE.
a, Analysis of CNS samples from naive Aldh1l1EGFP mice (n = 32). b, Top 42 surface markers and negative controls (neg. ctrls) expressed by astrocytes (Aldh1l1+) versus non-astrocytes (Aldh1l1). c, Histograms depicting staining of surface-molecule antibodies (blue) and isotype control (red) gated on astrocytes (Aldh1l1+). d, Fluorescence-activated cell sorting (FACS) analysis of tdTomato+CX3CR1 astrocytes from the spinal cord of naive and EAE peak or EAE recovery Aldh1l1creERT2tdTomato mice (n = 7 for the EAE recovery group (except n = 6 for CD29); n = 6 mice otherwise). e, FACS plots of LAMP1+ astrocytes during EAE. f, g, LAMP1 expression in astrocytes from the spinal cord, measured as mean fluorescence intensity (MFI) (f) and as a percentage (g) from the screen in d (n = 6 mice for the naive group in f and the EAE peak group in g; n = 7 mice otherwise). Unpaired two-tailed t-test. Data are mean ± s.e.m. (f, g).
Fig. 2 ∣
Fig. 2 ∣. LAMP1+ astrocytes limit CNS inflammation and express TRAIL.
a, Top, schematic of lentivirus vector. Bottom, EAE curves in mice treated with sgRNA against Lamp1 (sgLamp1) or control scramble sgRNA (sgScramble) (n = 19 sgScramble; n = 15 sgLamp1 mice). Experiment repeated three times. Two-way repeated measures analysis of variance (ANOVA). b, Quantification of immune cells in sgScramble- or sgLamp1-transduced mice (n = 9 sgScramble CD4+; n = 8 sgLamp1 CD4+; n = 6 mice otherwise). Two-tailed Mann–Whitney test. c, Quantification of the CD4+ T cell subset in sgScramble- or sgLamp1-transduced mice (n = 8 IFNγ+; n = 7 sgScramble IFNγ+IL-17+; n = 6 mice otherwise). Two-tailed Mann–Whitney test. d, Left, differential gene expression determined by bulk RNA-seq in sgScramble- or sgLamp1-transduced mice. Right, gene set enrichment analysis (GSEA) comparing sgScramble- and sgLamp1-transduced mice (day 19 after EAE induction; n = 3 mice per group). Gene Ontology (GO) terms are shown. FDR, false discovery rate; NES, normalized enrichment score. e, FACS analysis of activation of caspase-3 in CNS CD4+ T cells (n = 6 sgScramble; n = 5 sgLamp1 mice). Unpaired two-tailed t-test. f, Top, t-distributed stochastic neighbour embedding (t-SNE) plots of LAMP1+ astrocytes from naive or EAE Aldh1l1creERT2tdTomato mice (day 17 after EAE induction; n = 3 mice per group) analysed by scRNA-seq. Bottom, t-SNE plots of Lamp1 and Tnfsf10. g, Left, distribution of scRNA-seq clusters by condition. Right, number of cluster 0 (C0) cells (n = 812 cells). Data are mean ± s.e.m. (ac, e).
Fig. 3 ∣
Fig. 3 ∣. TRAIL+ astrocytes limit EAE development.
a, EAE curves in sgScramble (n = 24) and sgTnfsf10 (n = 25) mice. Experiment repeated three times. Two-way repeated measures ANOVA. b, Quantification of T cell subsets (day 24 after EAE induction; n = 6 mice per group). One-tailed Mann–Whitney test. c, Activation of caspase-3 in CNS CD4+ T cells (n = 6 sgScramble; n = 5 sgTnfsf10 mice). Unpaired two-tailed t-test. d, Left, differential gene expression determined by bulk RNA-seq in astrocytes isolated from sgScramble (n = 4) or sgTnfsf10 (n = 3)-transduced mice (left) at 24 days after EAE induction. Right, GSEA comparing sgScramble- and sgTnfsf10-transduced mice. e, f, Left, t-SNE plots of LAMP1+TRAIL+ astrocytes from naive or EAE Aldh1l1creERT2tdTomato mice (day 17 after EAE induction; n = 3 mice per group) analysed by scRNA-seq. e, Right, number of cluster 0 cells (n = 1,089 cells). g, GSEA of C0 astrocytes. h, Top left, GO analysis of differentially upregulated pathways in C0 astrocytes. Reg., regulation. Bottom left, predicted upstream regulation of the C0 transcriptional signature using Ingenuity Pathway Analysis (Qiagen). Inc. expr., increased expression; dec. expr., decreased expression; pred. activ., predicted activation. Right, t-SNE plots of Ifngr1 and Irf1. Data are mean ± s.e.m. (ac).
Fig. 4 ∣
Fig. 4 ∣. IFNγ induces TRAIL expression in astrocytes.
a, Quantitative PCR (qPCR) of Tnfsf10 expression in mouse primary astrocytes (n = 11 vehicle; n = 3 IL-1β; n = 3 TNF; n = 3 IFNβ; n = 4 biological replicates otherwise). Unpaired two-tailed t-test. b, Levels of pSTAT1 in mouse primary astrocytes after 60-min treatment with IFNγ or vehicle (n = 4 biological replicates per condition). Experiment repeated three times. Unpaired two-tailed t-test. c, Bottom, STAT1-binding motifs (STAT1 sites 1–4; S1–S4) in the Tnfsf10 promoter. Top, STAT1 chromatin immunoprecipitation (ChIP)-qPCR after IFNγ or vehicle treatment. n = 3 per condition. Unpaired two-tailed t-test. d, qPCR of Tnfsf10 expression in mouse primary astrocytes (n = 7 vehicle, IFNγ, IFNγ + GM-CSF; n = 3 mice otherwise). Welch’s two-tailed t-test, In-normalized data. e, FACS analysis of LAMP1+TRAIL+ astrocytes (day 28 after EAE induction; n = 5 per group). Unpaired two-tailed t-test. f, EAE curves (n = 24 sgScramble; n = 18 sgIfngr1; n = 14 sgIfngr2; n = 12 sgStat1 mice). Experiment repeated three times. Two-way repeated measures ANOVA. g, TRAIL expression in astrocytes of knockdown mice (n = 9 sgScramble; n = 5 sgIfngr1; n = 5 sgIfngr2; n = 9 sgStat1 mice). Unpaired two-tailed t-test. h, FACS analysis of CNS IFNγ+IL-17+CD4+ T cells in knockdown mice (n = 6 sgScramble, n = 6 sgIfngr1, n = 5 sgIfngr2, n = 3 sgStat1 mice). Two-tailed Mann–Whitney test. i, Activation of caspase-3 in CNS CD4+T cells (n = 6 sgScramble, sgIfngr1; n = 5 mice otherwise). Unpaired two-tailed t-test. j, k, Heat map (j) and GSEA (k) of astrocyte gene expression (day 24 after EAE induction; n = 4 mice per group). l, Activation of caspase-3 in CD4+T cells co-cultured with astrocytes and anti-TRAIL blocking antibody (n = 7 biological replicates) per condition. Unpaired two-tailed t-test. m, Expression of DR5 in CD4+ T cells in peak EAE mice (day 18 after EAE induction; n = 6 mice per group). One-way ANOVA, Tukey’s post-hoc test. n, Schematic (left) and quantification (right) of active caspase-3 expression in DR5+ and DR5 CD4+ T cells isolated from peak EAE mice (day 18 after EAE induction), co-cultured with IFNγ-pre-treated astrocytes (n = 7 biological replicates per group) PI, propidium iodide. Unpaired two-tailed t-test. Data are mean ± s.e.m. (a, c, di, ln).
Fig. 5 ∣
Fig. 5 ∣. Meningeal IFNγ+ NK cells promote homeostatic astrocyte TRAIL expression.
a, Left, immunostaining of spinal cord sections from naive and EAE mice (n = 7 sections (naive); n = 5 sections (EAE); n = 3 mice per group). Right, quantification of TRAIL expression normalized to control or parenchyma within images. Unpaired two-tailed t-test (left) and Kolmogorov–Smirnov test (right). Scale bar, 20 μm. b, Left, immunostaining of meninges from healthy control individuals (control) and from patients with MS (n = 6 sections (control); n = 5 sections (MS); n = 3 patients per group). Right, TRAIL expression quantified as in a. Unpaired two-tailed t-test (left) and Kolmogorov–Smirnov test (right). Scale bar, 20 μm. c, Immunostaining of TRAIL+ astrocytes in mouse CNS after peripheral intravenous injection of fluorescent WGA. b.v., blood vessel. Experiment repeated twice. Scale bar, 15 μm. d, RNAscope analysis of mouse spinal cord (n = 8 images (naive); n = 6 images (EAE)). Unpaired two-tailed t-test. Experiment repeated three times. Scale bar, 15 μm. e, IFNγ expression determined by flow cytometry in meninges from naive mice. NK cells, NK1.1+CD200R; type-1 innate lymphoid cells (ILC1), NK1.1+CD200R+ (n = 4 mice (NK); n = 5 mice otherwise). One-way ANOVA, Tukey’s post-hoc test. f, Quantification of IFNγ+ NK cells in meninges from IfngEYFP mice (left) or in meninges from healthy control individuals (right) (n = 6 mice; n = 6 individuals). Unpaired two-tailed t-test. Scale bars, 100 μm. g, FACS analysis of meningeal NK cells (left) and TRAIL+ astrocytes (right) 72 h after treatment with anti-NK1.1 or isotype control antibody (n = 4 mice per group). Unpaired two-tailed t-test. h, FACS analysis of LAMP1+TRAIL+ astrocytes co-cultured with IFNγ+or IFNγ NK cells from IfngEYFP mice (n = 3 per group). Unpaired two-tailed t-test. i, FACS analysis of IFNγ+ cells (left) and MFI (right) in meninges from naive and EAE (day 22 after EAE induction) mice. Left: n = 4 mice per group. One-way ANOVA, Tukey’s post-hoc test. Right: n = 3 naive; n = 5 EAE mice. Unpaired two-tailed t-test per cell type by condition. Data are mean ± s.e.m. (a, b, d, ei).
Fig. 6 ∣
Fig. 6 ∣. The microbiome modulates LAMP1+TRAIL+ astrocytes through meningeal IFNγ+ NK cells.
ac, FACS analysis of LAMP1+TRAIL+ astrocytes (a), meningeal IFNγ+NK (NK1.1+CD200R) cells (b) and meningeal NK cells (c) in SPF and germ-free (GF) mice (n = 3 SPF mice; n = 5 GF mice (a); n = 6 mice per group (b); n = 9 mice per group (c)). Unpaired two-tailed t-test. d, Schematic of adoptive transfer experiment. WT, wild type. e, f, FACS analysis of meningeal IFNγ+ NK cells (e) and LAMP1+TRAIL+ astrocytes (f) in mice receiving 1 × 10⁶ NK cells (e: n = 4 SPF wild type; n = 5 mice otherwise; one-way ANOVA, Fisher’s test; f: n = 10 SPF wild type; n = 9 Ifng−/− mice; Kolmogorov–Smirnov two-tailed test). Ifng−/− data are log-normalized in f. g, FACS analysis of IFNγ+NK1.1+CD200R cells in the meninges (left), total NK1.1+CD200R cells in the meninges (middle) and TRAIL+ astrocytes in the CNS (right) of mice treated as indicated (left: n = 8 vehicle, n = 4 ABX, n = 5 ABX + FMT mice; middle: n = 10 vehicle, n = 5 mice otherwise; right: n = 10 vehicle, n = 5 mice otherwise). Two-tailed Mann–Whitney test (left, middle); unpaired two-tailed t-test (right). h, Schematic of Kaede photoconversion experiment. i, Representative analysis of splenic NK1.1+CD200RCD3 cells after photoconversion in the small intestine. Conv, converted. j, Quantification of NK cells in meninges and CNS parenchyma after photoconversion in the small intestine (n = 4 mice not converted; n = 3 mice converted + 24 h). Unpaired two-tailed t-test. k, Quantification of splenic NK cells (left) and Ifng expression in splenic NK cells (right) in mice after small intestine photoconversion and indicated treatments (left: n = 5 mice per group; right: n = 5 vehicle; n = 9 ABX; n = 10 ABX + FMT mice). Unpaired two-tailed t-test. Data are mean ± s.e.m. (ac, eg, ik).

Comment in

References

    1. Linnerbauer M, Wheeler MA & Quintana FJ Astrocyte crosstalk in CNS inflammation. Neuron 108, 608–622 (2020). - PMC - PubMed
    1. de Saint Basile G, Ménasché G & Fischer A Molecular mechanisms of biogenesis and exocytosis of cytotoxic granules. Nat. Rev. Immunol 10, 568–579 (2010). - PubMed
    1. Aggarwal BB Signalling pathways of the TNF superfamily: a double-edged sword. Nat. Rev. Immunol 3, 745–756 (2003). - PubMed
    1. Chao CC et al. Metabolic control of astrocyte pathogenic activity via cPLA2-MAVS. Cell 179, 1483–1498 (2019). - PMC - PubMed
    1. Mächler P et al. In vivo evidence for a lactate gradient from astrocytes to neurons. Cell Metab. 23, 94–102 (2016). - PubMed

Publication types

MeSH terms

LinkOut - more resources