. 2021 Feb;590(7844):129-133.
doi: 10.1038/s41586-020-03085-8. Epub 2021 Jan 6.

Control of osteoblast regeneration by a train of Erk activity waves

Affiliations

Control of osteoblast regeneration by a train of Erk activity waves

Alessandro De Simone et al. Nature. 2021 Feb.

Abstract

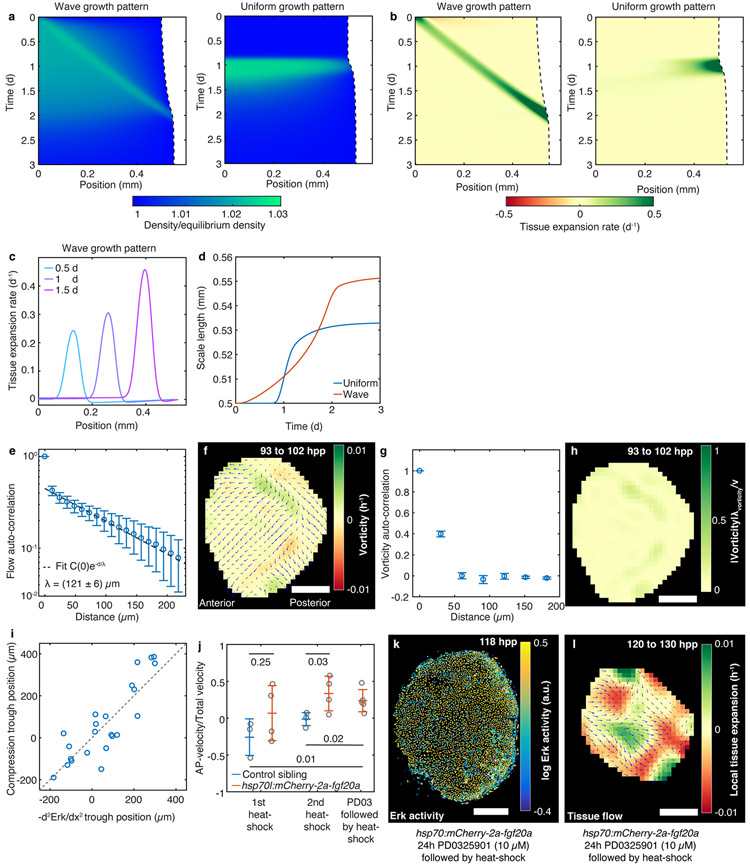
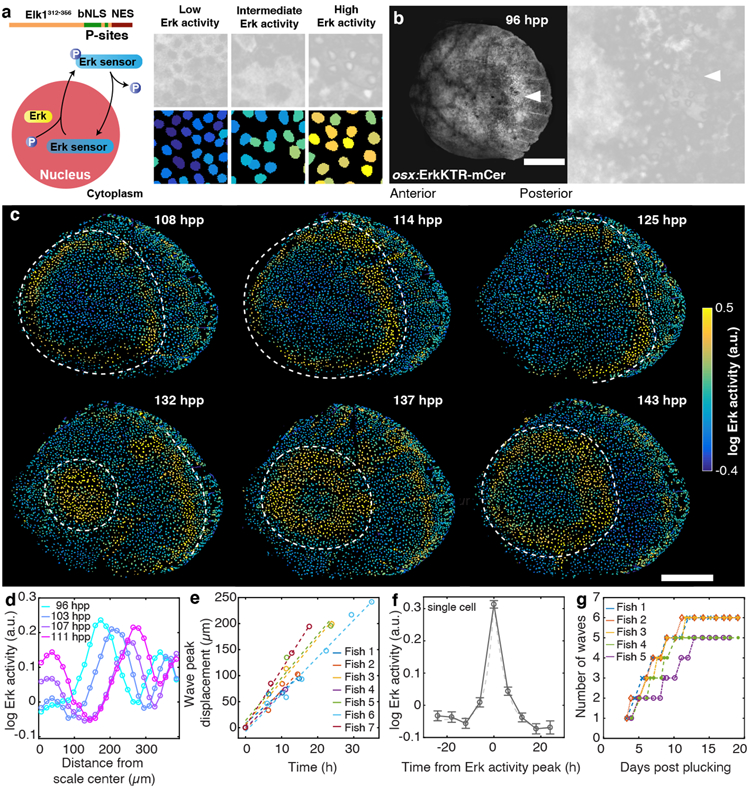
Regeneration is a complex chain of events that restores a tissue to its original size and shape. The tissue-wide coordination of cellular dynamics that is needed for proper morphogenesis is challenged by the large dimensions of regenerating body parts. Feedback mechanisms in biochemical pathways can provide effective communication across great distances1-5, but how they might regulate growth during tissue regeneration is unresolved6,7. Here we report that rhythmic travelling waves of Erk activity control the growth of bone in time and space in regenerating zebrafish scales, millimetre-sized discs of protective body armour. We find that waves of Erk activity travel across the osteoblast population as expanding concentric rings that are broadcast from a central source, inducing ring-like patterns of tissue growth. Using a combination of theoretical and experimental analyses, we show that Erk activity propagates as excitable trigger waves that are able to traverse the entire scale in approximately two days and that the frequency of wave generation controls the rate of scale regeneration. Furthermore, the periodic induction of synchronous, tissue-wide activation of Erk in place of travelling waves impairs tissue growth, which indicates that wave-distributed Erk activation is key to regeneration. Our findings reveal trigger waves as a regulatory strategy to coordinate cell behaviour and instruct tissue form during regeneration.


Figures

Extended Data Figure 1
Extended Data Figure 1. Scale regeneration in zebrafish.
This Figure contains data indicating that osteoblasts display minimal proliferation after 4 dpp and that their hypertrophic growth is patterned. a) Array of regenerating scales on the trunk of a fish (n > 50 fish from > 5 independent experiments). b) Osteoblasts form a continuous monolayer in zebrafish scales (see also Supplementary Video 2; n > 50 fish from > 5 independent experiments). Scale-bar: 250 μm. c) Average cell area (error-bars: mean with SEM; n = 4 scales in 4 fish in a single trial) in scale regeneration. d) Fraction of EdU-positive nuclei during the proliferative and hypertrophic phases (error-bars: mean with SD; each circle represents the fraction of positive nuclei among 500-2000 nuclei from an individual scale; 1-4 dpp: n = 4 fish; 1-7 dpp: n = 2 fish; 4-7 dpp: n = 4 fish; single trial; two-sided Wilcoxon’s rank-sum test P is indicated). Proliferative phase: fish are injected at 1 dpp and scales are collected at 4 dpp or 7 dpp, as indicated. Hypertrophic phase: fish are injected at 4.5 dpp and scales are collected at 7 dpp. e) Osteoblast nuclei tagged with the photo-convertible protein mEos2 are photo-converted during the hypertrophic phase (4.5 dpp), imaged daily and tracked thereafter. No nuclei were observed to divide, and almost all could still be detected after 4 days (n = 55/58 cells from 5 fish tracked from 4.5 to 8 dpp pooled from 2 independent experiments. Probability of cell division is less than 2%/day at 95% confidence. Scale bar: 50 μm). f) High magnification of e. Scale bar: 25 μm. g) Osteoblast nuclei tagged with the photo-convertible protein mEos2 are photo-converted during the proliferative phase (3 dpp) and imaged the day after. Cell division can be detected (9 divisions, scored by the increase of converted nuclei, from 3 to 4 dpp in 55 converted cells from 5 scales from 2 fish (single trial); compatible with a total proliferation rate of 0.156 ± 0.003 per cell per day for the entire scale; white arrows indicates likely division events). Scale bar: 50 μm. h) High magnification of g. Scale bar: 25 μm. i) Examples of tissue velocity field v¯ (tissue flow, blue arrows) and its divergence v¯ (heat-map) indicating the pattern of tissue expansion and contraction (n > 10 fish from 5 independent experiments). Tissue flows are calculated tracking individual cell movements for ~9 h (one frame every 3 h). Scale bar: 250 μm. Dpp(hpp): days(hours) post plucking.
Extended Data Figure 2
Extended Data Figure 2. Manipulation of Erk signalling during scale regeneration. Erk activity at 2-3 dpp.
a) Scale area increase (left) and average cell area increase (right) in fish treated with the Mek inhibitor PD0325901 and DMSO control (with SEM; n = 6 scales from 6 fish in each condition pooled from 2 independent experiments; chi-squared test P is indicated). b) Scale area increase (left) and average cell area increase (right) as function of time in fish expressing a gene encoding a dominant negative version of the Fibroblast Growth Factor Receptor 1 (Fgfr1) downstream of the heat-shock promoter hsp70l (hsp70l:dnfgfr1-EGFP) and control siblings not carrying the transgene. Fish are heat-shocked every day, starting before the first time-point at 4 dpp (with SEM; n = 12 scales from 3 fish per condition in a single trial; chi-squared test P is indicated). c, d) Example (c) and quantification (d) of Erk activity in fish treated with the Mek inhibitor PD0325901 and DMSO control (error-bars: mean with SD; each circle represents a scale from an individual fish, pooled from 2 independent experiments; unpaired two-sided log-normal test P is indicated). e) Example of Erk activity in a regenerating scale at 2 and 3 days post plucking (dpp). Erk activity is activated in a uniform pattern at 2 dpp (n = 5 scales from 5 fish in a single trial). Around 3 dpp, Erk switches off starting from the scale centre (n = 6 scales from 5 fish in a single trial). Scale-bar: 250 μm. Dpp: days post plucking.
Extended Data Figure 3
Extended Data Figure 3. Pharmacological inhibition of Fgfr and Egfr signalling during scale regeneration.
a, b) Example (a) and quantification (b) of Erk activity in fish treated with the pan-Fgfr inhibitor BGJ398 and DMSO control (error-bars: mean with SD; n = 4 scales from 4 fish per condition (data from a single trial, replicated in 2 additional independent experiments); unpaired two-sided log-normal test P is indicated). c) Quantification of Erk activity in fish treated with the pan-Fgfr inhibitor BGJ398 for 1-3 h and DMSO control (error-bars: mean with SD; DMSO: n = 4 scales from 4 fish pooled from two independent experiments, BGJ398: n = 7 scales from 7 fish pooled from 3 independent experiments; unpaired two-sided log-normal test P is indicated). d, e) Example (d) and quantification (e) of Erk activity in fish treated with the pan-Fgfr inhibitor JNJ-42756493 and DMSO control (error-bars: mean with SD; DMSO: n = 6 scales from 6 fish in a single trial, JNJ-42756493 n = 4 scales from 4 fish in a single trial; unpaired two-sided log-normal test P is indicated). f, g) Example (f) and quantification (g) of Erk activity in fish treated with the Fgfr inhibitor SU5402 and DMSO control (error-bars: mean with SD; DMSO: n = 6 scales from 6 fish in a single trial, SU5402: n = 4 scales from 4 fish in a single trial; unpaired two-sided log-normal test P is indicated). Control fish are the same as in Extended Data Fig. 3d, e. h, i) Example (h) and quantification (i) of Erk activity in fish treated with the Egfr inhibitor PD153035 and DMSO control (error-bars: mean with SD; DMSO: n = 3 scales from 3 fish in a single trial, PD153035: n = 4 scales from 4 fish per condition in a single trial; unpaired two-sided log-normal test P is indicated). Scale-bar: 250 μm. Dpp: days post plucking.
Extended Data Figure 4
Extended Data Figure 4. Expression of dnfgfr1 and fgf over-expression during scale regeneration.
a, b) Example (a) and quantification (b) of Erk activity in fish expressing a gene encoding a dominant negative version of the Fibroblast Growth Factor Receptor 1 (Fgfr1) downstream of the heat-shock promoter hsp70l (hsp70l:dnfgfr1-EGFP) and control siblings not carrying the transgene (error-bars: mean with SD; control: n = 3 scales from 2 fish in a single trial, dnfgfr1 : 5 scales from 3 fish in a single trial; unpaired two-sided log-normal test P is indicated). In 1/5 scales in hsp70l:dnfgfr1-EGFP fish, we observed that a new wave originated at 108 hpp. Erk peak activity after 24 h treatment could not be measured as waves reached the scale border. c, d) Example (c) and quantification (d) of Erk activity in fish over-expressing fgf20a downstream of the heat-shock promoter hsp70l (hsp70l:mCherry-2a-fgf20a) and in control siblings (error-bars: mean with SD; 4 and 7 dpp: n = 4 scales from 4 fish per condition in a single trial; 5 dpp control: n = 5, hsp70l:mCherry-2a-fgf20a: n = 4 scales from 4 fish pooled from 2 independent experiments; two-sided Wilcoxon’s rank-sum test P is indicated). Heat-shock was performed everyday starting from 4 dpp, and Erk activity was measured thereafter (approximately ~6 h after the start of the heat-shock); see also Extended Data Fig. 8a-b. e, f) Example (e) and quantification (f) of Erk activity in fish over-expressing fgf3 downstream of the heat-shock promoter hsp70l (hsp70l:fgf3) and in control siblings (error-bars: mean with SD; n = 5 scales from 5 fish per condition in a single trial; two-sided Wilcoxon’s rank-sum test P is indicated). Heat-shock was performed everyday starting from 4 dpp, and Erk activity was measured thereafter (approximately ~6 h after the start of the heat-shock); see also Extended Data Fig. 9a-b. Scale-bar: 250 μm. Dpp: days post plucking.
Extended Data Figure 5
Extended Data Figure 5. Sequencing strategy for osteoblasts indicates increased transcript abundance of Erk inhibitors in Erk active cells.
a) Erk activity and osx:Venus-hGeminin signal in regenerating scales at different time-points are shown (n > 10 fish from > 5 independent experiments). b) Venus-hGeminin signal as a function of time from Erk peak (error-bars: mean with SEM; n = 89 cells from 3 scales from 3 fish in a single trial; for each cell track t = 0 is the time of the Erk peak; Erk data is the same presented in Fig. 2f). hGeminin nuclear signal is normalized to cytoplasmic signal. c, d) osx:hGeminin signal and osx:mCherry-zCdt1 signal (normalized for respective cytoplasmic signals) in individual cells of a representative scale (n = 4 scales from 4 fish from a single experiment, replicated in 2 additional independent experiments; quantified in e) during the proliferative (c) and hypertrophy phases (d). e) Fraction of osteoblasts in proliferative state (normalized Venus-hGeminin > normalized mCherry-zCdt) during the proliferative and hypertrophic phases of scale regeneration (error-bars: mean with SD; each circle is a scale from an individual fish in a single trial; two-sided Wilcoxon’s rank-sum test is indicated). f) Flow-cytometry strategy to sort two population of osteoblasts (H2A-mCherry+): one enriched for Venus-hGeminin/Erk active cells (Erk−) (D, 9. 104, 8. 104, 5. 104 cells in the three samples) and one enriched for Venus-hGeminin+/Erk inactive cells (Erk+) (E, 4. 104, 5. 104, 2. 104 cells in the three samples). g) Gene Set Enrichment Analysis for KEGG MAPK Signalling Pathway, Gene Ontology Bone Mineralization, Morphogenesis and Growth. FDR: False Discovery Rate. Data from 3 samples pooled from 2 independent experiments. h) Normalized counts for expressed Erk-related dusp genes, sprouty (spry) genes and the trans-membrane proteoglycan syndecan-4 (sdc4). DeSeq2 P-adjusted is indicated. i) Fold change of Erk inhibitory gene transcripts in regenerating scales of fish treated with the Mek inhibitor PD0325901 with respect to DMSO controls (error-bars: mean with SD; unpaired two-sided log-normal test P is indicated; 4 dpp scales are used; DMSO: n = 2 samples in a single trial, PD0325901: n = 3 samples in a single trial). j) Enrichment of Erk target spry4 in scales of fish expressing a gene encoding a dominant negative version of the Fibroblast Growth Factor Receptor 1 (Fgfr1) downstream of the heat-shock promoter hsp70l (hsp70l:dnfgfr1-EGFP) with respect to control siblings (error-bars: mean with SD; unpaired two-sided log-normal test P is indicated; 4 dpp scales are used; n = 3 samples per condition in a single trial). Heat-shocked (hs) hsp70l:dnfgfr1-EGFP animals are compared with heat-shocked siblings not carrying the transgene. As an additional control, not heat-shocked (not hs) hsp70l:dnfgfr1-EGFP animals are compared with not heat-shocked siblings not carrying the transgene. Scale-bar: 250 μm. Dpp(hpp): days(hours) post plucking.
Extended Data Figure 6
Extended Data Figure 6. Tests and consequences of trigger wave model.
This Figure contains extended details on the mathematical model of Erk waves, on the predictions of the models and their experimental tests. a) Mathematical model of Erk dynamics including a diffusible activator, such as Fgf, in turn activated by Erk, and a delayed inhibitor. Activator and inhibitor concentrations (heat map) as a function of time are shown. Red dashed region: activator source region. b, c) Examples of Erk activity and quantifications of wave speed (corrected for tissue growth) in regenerating scales in fish treated with cycloheximide at 4 dpp and controls (error-bars: mean with SD; each circle represents a scale from an individual fish; single trial.) d) Example of Erk activity in fish treated with a concentration of the Mek inhibitor PD0325901 that slows wave propagation, but does not completely impair it, and DMSO control (see Fig. 3f for Erk wave speed quantification, n = 7 scales from 7 fish pooled from 3 independent experiments). e) Example of Erk activity, organized in an expanding ring (arrow-heads), in a developing scale in a juvenile fish throughout time (n > 15 scales in 4 fish in a single trial). f) Wave width for different fold-increases of the activator diffusion constant (simulation; with respect to the standard simulation of Fig. 3, Methods). g) Simulation of growth factor concentration as a function of time in a simple diffusion model and in the Erk trigger wave model. In both models, D ~ 0.1 μm2 s−1 (see Methods). Scale-bar: 250 μm. Hpp: hours post plucking.
Extended Data Figure 7
Extended Data Figure 7. Erk activity is required for tissue expansion during zebrafish scale hypertrophy.
a) Time delay of expansion peak position versus Erk peak position. Time delay is measured fitting the relationship between expansion peak position and Erk peak position for different lag times with a linear fit (unitary slope; error-bars: best fit with 95% CI; n = 18 expansion peaks from 16 scales from 12 fish pooled from > 5 independent experiments). The expansion peak is taken at the start of the 9 h-long time-window considered to calculate flows. For clarity, a positive lag time means that the position of the Erk peak is taken at a time subsequent to the initial point of the time window used to calculate the expansion peak. b) Average single cell area increase as a function of time from Erk peak (error-bars: mean with SEM; n = 89 cells from 3 scales from 3 fish in a single trial; for each cell track t = 0 is the time of the Erk peak; Erk data is the same presented in Fig. 2f). Each cell area is normalized with cell area at the time of Erk peak (cell area was measured manually using the ErkKTR-mCerulean signal). Dashed lines: linear fit of normalized cell areas before and after the Erk peak (slope before peak: (−0.002 ± 0.002) h−1; slope after peak: (0.006 ± 0.002) h−1; with 68% CI). c) Scale area growth as a function of Erk wave speed, corrected for tissue growth, in ontogenetic and regenerating scales (circles represent individual scales from 12 (regeneration, pooled from > 5 independent experiments) and 3 (juvenile development, single trial) fish; Spearman’s correlation coefficient 0.75, P = 2. 10−4). d) Erk activity, tissue velocity field v¯ (tissue flow, blue arrows) and its divergence v¯ (heat-map) in scales in fish treated with the Mek inhibitor PD0325901 and DMSO control (n = 4 scales from 4 fish per condition pooled from 2 independent experiments). Here and in e, f, fish are treated at 4 dpp and imaged ~24 h later for ~12 h at 3 h frame-rate. e, f) Total expansion rate of expanding regions (e), normalized for scale area, and AP-velocity component (f) in fish treated with PD0325901 (10 μM) and DMSO control (error-bars: mean with SD; n = 4 scales from 4 fish per condition pooled from 2 independent experiments; unpaired two-sided Student’s t-test is shown). Fish are treated at 4 dpp and imaged ~24 h later for ~12 h (1 frame every 3 h). g) Cumulative number of waves and scale area as a function of time throughout entire scale regeneration (single trial). h) Cumulative number of waves and scale area as a function of time in scales treated with the pan-Fgfr inhibitor BGJ398 (10 μM) for ~3 h at 4 dpp (orange area) and transferred to fresh water thereafter (2 pooled independent experiments). Dpp: days post plucking. Scale-bar: 250 μm.
Extended Data Figure 8
Extended Data Figure 8. Effects of ectopic and tissue-wide Fgf20a pulses on scale regeneration.
This Figure indicates that tissue-wide and synchronous Erk oscillations induced by Fgf20a ectopic expression display similar temporal dynamics to baseline, wave-dependent Erk activation, and that they impair tissue growth. a) Quantification of spatial pattern of Erk activity in 4 dpp regenerating scales in fish expressing fgf20a downstream of the heat-shock promoter hsp70l (hsp70l:mCherry-2a-fgf20a) and control siblings not carrying the transgene. Erk activity is averaged along a 240 μm-wide stripe passing through the scale centre and the wave origin (n = 4 scales from 4 fish per condition, data from a single trial, replicated in 2 additional independent experiments). b) Erk activity in initially active cells (cytoplasmic ErkKTR > 1.1 nuclear ErkKTR) in hsp70l:mCherry-2a-fgf20a fish and control siblings not carrying the transgene (error-bars: mean with SEM; n = 3 scales from 3 fish per condition pooled from 2 independent experiments). Transgenic fgf20a expression was induced by heat-shock at 3.5 dpp. Scales were imaged starting 4 h after the start of heat-shock for ~12 h (1 frame every 3 h). c) Erk activity, tissue velocity field v¯ (tissue flow, blue arrows) and its divergence v¯ (heat-map) indicating tissue expansion, in regenerating scales in hsp70l:mCherry-2a-fgf20a fish and control siblings not carrying the transgene. Transgenic fgf20a expression was induced by heat-shock at 3.5 and at 4.5 dpp. Scales were imaged starting 4 h after heat-shock for ~12 h (1 frame every 3 h). Quantifications in d. d) Tissue expansion in regenerating scales in hsp70l:mCherry-2a-fgf20a fish and control siblings not carrying the transgene (error-bars: mean with SD; each circle represents a scale from an individual fish, pooled from 2 independent experiments; unpaired two-sided Student’s t-test P is indicated). Transgenic fgf20a expression was induced by heat-shock at 3.5 and at 4.5 dpp. Scales were imaged starting 4 h after heat-shock for ~9 h (first heat-shock) or ~12 h (second heat-shock) (1 frame every 3 h). e) Average cell area increase as function of time in regenerating scales in hsp70l:mCherry-2a-fgf20a fish and control siblings not carrying the transgene (error-bars: mean with SEM; n = 4 scales from 4 fish per condition in a single trial; chi-squared test P is indicated). Transgenic fgf20a expression is induced by heat-shocking fish every day at the same time (see Methods), starting after the first time-point. f, g) Example of scale morphology as a function of time in fish expressing hsp70l:mCherry-2a-fgf20a and control siblings not carrying the transgene (f, n = 4 scales from 4 fish per condition in a single trial). Average deviation of scale morphology (g, error-bars: mean with SEM, n = 4 scales from 4 fish per condition in a single trial) is measured with respect to before heat-shock by calculating the total discrepancy of the rescaled scale borders in polar coordinates (Methods, chi-squared test P is indicated). Transgenic fgf20a expression is induced by heat-shocking fish every day at the same time (see Methods), starting after the first time-point. Dpp(hpp): days(hours) post plucking; scale-bar: 250 μm.
Extended Data Figure 9
Extended Data Figure 9. Effects of ectopic and tissue-wide Fgf3 pulses on scale regeneration.
This Figure indicates that Fgf3-induced tissue-wide and synchronous Erk oscillations lead to impaired tissue growth. a, b) Quantification of spatial (a) and temporal (b) patterns of Erk activity in regenerating scales in fish expressing fgf3 downstream of the heat-shock promoter hsp70l (hsp70l:fgf3) and control siblings not carrying the transgene (n = 5 scales from 5 fish per condition from a single trial). Transgenic fgf3 expression was induced by heat-shock every day; fish were imaged before and after heat-shock (shaded regions in b). In a, Erk activity is averaged along a 240 μm-wide stripe passing through the scale centre and the wave origin. In b, the fraction of active Erk cells with respect to total is calculated in the entire scale (cytoplasmic ErkKTR > 1.1 nuclear ErkKTR). c) Average cell area increase (with SEM) as function of time in regenerating scales in hsp70l:fgf3 fish and control siblings not carrying the transgene (error-bars: mean with SEM; n = 5 scales from 5 fish per condition in a single trial; chi-squared test P is indicated). Transgenic fgf3 expression was induced by heat-shock every day starting from 3.5 dpp. Fish were imaged before and after heat-shock (shaded regions in b). d, e) Example of scale morphology as a function of time in fish expressing hsp70l:fgf3 and control siblings not carrying the transgene (d, n = 5 scales from 5 fish per condition in a single trial). Average deviation of scale morphology (e, error-bars: mean with SEM, n = 5 scales from 5 fish per condition in a single trial) is measured with respect to before heat-shock by calculating the total discrepancy of the rescaled scale borders in polar coordinates (Methods, chi-squared test P is indicated). Transgenic fgf3 expression was induced by heat-shock every day; fish were imaged before and after heat-shock (shaded regions in b). Dpp: days post plucking; scale-bar: 250 μm.
Extended Data Figure 10
Extended Data Figure 10. Minimal mechanical model of tissue growth and tissue flow properties.
Tissue density (a), tissue expansion rate (b, c, calculated as vx) and total tissue growth (d) in the case of wave-like and uniform basal tissue growth in 1D mathematical model of tissue growth (see Supplementary Notes). e) Two-point correlator of tissue flow velocities in control scales (error-bars: mean with SD; n= 5 scales from 5 fish pooled from 2 independent experiments). λ is the flow velocity correlation length (with 95% CI). f, g, h) Vorticity of tissue velocity field (f), its two-point correlator (g, error-bars: mean with SD; n= 5 scales from 5 fish pooled from 2 independent experiments) and adimentionalised vorticity (h, v is the average flow absolute velocity and λvorticity is the vorticity correlation length, estimated to be in the order of 30 μm). Note that λvorticity is similar to the length used to calculate the vorticity itself, so it represents an upper limit; smaller values of λvorticity would further decrease adimentionalised vorticity. Average absolute tissue flow vorticity for 5 scales from 5 fish pooled from 2 independent experiments: 0.0007 h−1, 0.0009 h−1, 0.0009 h−1, 0.0008 h−1 and 0.0012 h−1. Average tissue flow speed for 5 scales from 5 fish pooled from 2 independent experiments: 0.4 μm h−1, 0.5 μm h−1, 0.5 μm h−1 , 0.4 μm h−1 and 0.5 μm h−1. i) Position of the divergence trough, i.e. compression peak, (distance from scale centroid; calculated over 9 h) as a function of the position of the trough of - d2Erkdx2 where x is the distance from scale centroid (n = 16 scales from 12 fish from > 5 independent experiments; Pearson’s correlation coefficient 0.87, P = 3. 10−8; dashed line: bisector of the axis). The divergence trough has intensity (−0.002 ± 0.002) h−1 (SD; SEM: 0.0003 h). j) Quantification of average AP-component of tissue flow velocity, normalized to the norm of the velocity vector, in regenerating scales in hsp70l:mCherry-2a-fgf20a fish and control siblings not carrying the transgene (error-bars: mean with SD; each circle represents a scale from an individual fish, besides “PD03 followed by heat-shock” in which n = 5 scales from 3 fish were imaged; 1st and 2nd heat-shock: pooled from 2 independent experiments each, PD03 followed by heat-shock: single trial; unpaired two-sided Student’s t-test P is indicated). 1st heat-shock: transgenic fgf20a expression was induced by heat-shock at 3.5 dpp; 2nd heat-shock: 3.5 and 4.5 dpp; PD03 followed by heat-shock: fish were treated with PD0325901 (10 μM) for 24 h at 4 dpp, then they were transferred to fresh water and heat-shocked. Finally, fish were returned to the chemical treatment and imaged. Scales were imaged starting 5 h after heat-shock for ~9 h (first heat-shock; PD03 followed by heat-shock) or 12 h (second heat-shock). k) Erk activity in scales treated with PD0325901 (10 μM) and then heat-shocked in fresh water, as described in j, but without returning them to chemical treatment, and imaged. Fraction of Erk active cells with respect to total from 4 scales from 2 fish in a single trial: 0.73, 0.75, 0.64, 0.45. l) Tissue velocity field v¯ (tissue flow, blue arrows) and its divergence v¯ (heat-map) indicating tissue expansion, in regenerating scales in hsp70l:mCherry-2a-fgf20a fish treated with PD0325901 (10 μM) for 24 h, then heat-shocked, returned to chemical treatment and imaged, as described in j. Quantifications: see j (single trial). Hpp: hours post plucking. Scale-bar: 250 μm.
Figure 1.
Figure 1.. Scale regeneration proceeds by patterned osteoblast hypertrophy.
a, b) Zebrafish scale morphology and regeneration (n > 50 fish from > 5 independent experiments). c, d) Number of nuclei and scale area during regeneration (data from a single trial, replicated in 1 additional independent experiments). e) Tissue velocity field v¯ (tissue flow, blue arrows) and its divergence v¯ (heat-map), indicating tissue expansion and contraction (n > 10 fish from 5 independent experiments; dashed line: ring of tissue expansion; red: high tissue contraction; green: high tissue expansion). Scale-bar: 250 μm. Here and thereafter, dpp (hpp): days (hours) post plucking.
Figure 2.
Figure 2.. Erk activity waves travel across regenerating scales.
a) Schematic of the Erk sensor (Erk KTR, left). The mCerulean-tagged sensor includes a suboptimal bipartite Nuclear Localization Sequence (bNLS) and a Nuclear Export Sequence (NES). Erk binds to the sensor through its Elk1-derived docking site and phosphorylates it, favouring nuclear export (right, quantified Erk activity in scale osteoblasts, represented as in Fig. 2c). b) Erk KTR in a regenerating scale. Arrowheads: ring of Erk active cells (n > 50 fish from > 5 independent experiments; right: magnification. Image size: 150 μm). c) Quantification of Erk activity (n > 50 fish from > 5 independent experiments; dashed lines: front of active cells). Occasional activation can be observed along radii (vascularized and innervated bone canals). d) Example of Erk wave activity profile. e) Erk wave activity peak position at 4-5 dpp (dashed lines: linear fit, n = 7 scales from 7 fish pooled from 3 independent experiments). Peak width = (70 ± 20) μm (gaussian fit, 2 SD). f) Erk activity in tracked individual central osteoblasts located in the posterior of the scale (error-bars: mean with SEM; n = 89 cells from 3 scales from 3 fish in a single trial; for each cell, t = 0 is peak Erk activity). Dashed lines: exponential fit of Erk activation/deactivation time (2.8 ± 0.5 h; 4.6 ± 0.6 h; 68% CI). g) Cumulative number of Erk activity waves as a function of time in individual regenerating scales measured longitudinally (single trial). Scale-bar: 250 μm.
Figure 3.
Figure 3.. Erk activity propagates as a reaction-diffusion trigger wave.
a, b) Model of Erk signalling dynamics including a diffusible Erk activator, such as Fgf and/or another potential activator, a positive feedback between Erk and the activator, and a negative feedback including an Erk inhibitor. Red shaded region: constant source of activator. c) Erk activity in a scale in which a portion of the tissue has been ablated (red dashed line). Top/middle: mathematical model. Bottom: regenerating scales in which a portion of the tissue has been ablated by laser micro-surgery in vivo. White dashed line: wave front. Quantifications: see d. Hpa: hours post ablation. d) Wave front angle with respect to a circular front (error-bars: mean with SD; Methods; control: n = 14 scales from 13 fish pooled from 3 independent experiments, ablation: n = 6 scales from 6 fish pooled from 2 independent experiments; two-sided Wilcoxon’s rank-sum test P is shown). e) Model prediction of Erk wave speed for different levels of inhibition of the Erk activator Mek (waves at null speed are unstable). f) Wave speed corrected for tissue growth and normalized to respective control, in regenerating scales (4 dpp) in fish treated with different concentrations of the Mek inhibitor PD0325901 (error-bar: mean with SEM; circles: scales from individual fish, besides 0 μM in which 10 scales from 9 fish were imaged, pooled independent experiments: 3, 1, 3, 1, 1, 2; Spearman’s correlation coefficient −0.75; P = 2. 10−4). Red dots: Erk waves completely impaired. g) Wave speed, corrected for tissue growth (circles: individual scales from 12 (regenerating, pooled from 4 independent experiments) and 3 (juvenile, single trial) fish; mean radius waves with SEM: ontogeny 130 ± 10 μm, regeneration 440 ± 40 μm, unpaired two-sided Student’s t-test P = 5. 10−4; mean wave speed with SEM: ontogeny 3.2 ± 0.6 μm h−1, regeneration 6.7 ± 0.6 μm h−1, unpaired two-sided Student’s t-test P = 0.009). Model: v=vp-D/R (see main text). Scale-bar: 250 μm.
Figure 4.
Figure 4.. Erk activity waves direct tissue growth in regenerating scales.
a) Erk activity, tissue velocity field v¯ (tissue flow, blue arrows) and its divergence v¯ (heat-map; quantifications: see b). b) Expansion and Erk peaks position (n = 16 scales from 12 fish pooled from > 5 independent experiments; Pearson’s correlation coefficient 0.93, P = 2. 10−8; dashed line: bisector of the axis). c-e) Cumulative number of waves and scale area during regeneration (orange area: BGJ398 transient treatment). d: area increase (error-bars: mean with SEM; untreated: n = 5 scales from 5 fish in a single trial, BGJ398: n = 4 scales from 4 fish pooled from 2 independent experiments; partial Pearson’s correlation coefficient calculated on averages and controlling for time: ρ = 0.97, P = 2. 10−4; untreated fish: same as in Fig. 2g and Extended Data Fig. 1c). f) Scale area increase in transgenic fish and respective control siblings not carrying the transgene (error-bars: mean with SEM; fgf20a and control: 4 scales from 4 fish per condition in a single trial; fgf3 and control: 5 scales from 5 fish per condition in a single trial; Methods and Extended Data Fig. 8-9). Scale-bar: 250 μm.

References

    1. Gelens L, Anderson GA & Ferrell JE Jr. Spatial trigger waves: positive feedback gets you a long way. Mol Biol Cell 25, 3486–3493, doi:10.1091/mbc.E14-08-1306 (2014). - DOI - PMC - PubMed
    1. Hubaud A, Regev I, Mahadevan L & Pourquie O Excitable Dynamics and Yap-Dependent Mechanical Cues Drive the Segmentation Clock. Cell 171, 668–682 e611, doi:10.1016/j.cell.2017.08.043 (2017). - DOI - PMC - PubMed
    1. Werner S, Vu HT & Rink JC Self-organization in development, regeneration and organoids. Curr Opin Cell Biol 44, 102–109, doi:10.1016/j.ceb.2016.09.002 (2017). - DOI - PubMed
    1. Sonnen KF et al. Modulation of Phase Shift between Wnt and Notch Signaling Oscillations Controls Mesoderm Segmentation. Cell 172, 1079–1090 e1012, doi:10.1016/j.cell.2018.01.026 (2018). - DOI - PMC - PubMed
    1. Deneke VE & Di Talia S Chemical waves in cell and developmental biology. J Cell Biol 217, 1193–1204, doi:10.1083/jcb.201701158 (2018). - DOI - PMC - PubMed

Additional References

    1. Lee Y, Grill S, Sanchez A, Murphy-Ryan M & Poss KD Fgf signaling instructs position-dependent growth rate during zebrafish fin regeneration. Development 132, 5173–5183, doi:10.1242/dev.02101 (2005). - DOI - PubMed
    1. Nachtrab G, Kikuchi K, Tornini VA & Poss KD Transcriptional components of anteroposterior positional information during zebrafish fin regeneration. Development 140, 3754–3764, doi:10.1242/dev.098798 (2013). - DOI - PMC - PubMed
    1. McKinney SA, Murphy CS, Hazelwood KL, Davidson MW & Looger LL A bright and photostable photoconvertible fluorescent protein. Nat Methods 6, 131–133, doi:10.1038/nmeth.1296 (2009). - DOI - PMC - PubMed
    1. Wan J, Ramachandran R & Goldman D HB-EGF is necessary and sufficient for Muller glia dedifferentiation and retina regeneration. Dev Cell 22, 334–347, doi:10.1016/j.devcel.2011.11.020 (2012). - DOI - PMC - PubMed
    1. Wan J, Zhao XF, Vojtek A & Goldman D Retinal injury, growth factors, and cytokines converge on beta-catenin and pStat3 signaling to stimulate retina regeneration. Cell Rep 9, 285–297, doi:10.1016/j.celrep.2014.08.048 (2014). - DOI - PMC - PubMed

Publication types

Substances