. 2019 Winter;38(1):65-98.
doi: 10.1002/pam.22104. Epub 2018 Nov 5.

Housing Voucher Take-Up and Labor Market Impacts

Affiliations

Housing Voucher Take-Up and Labor Market Impacts

Eric Chyn et al. J Policy Anal Manage. 2019 Winter.

Abstract

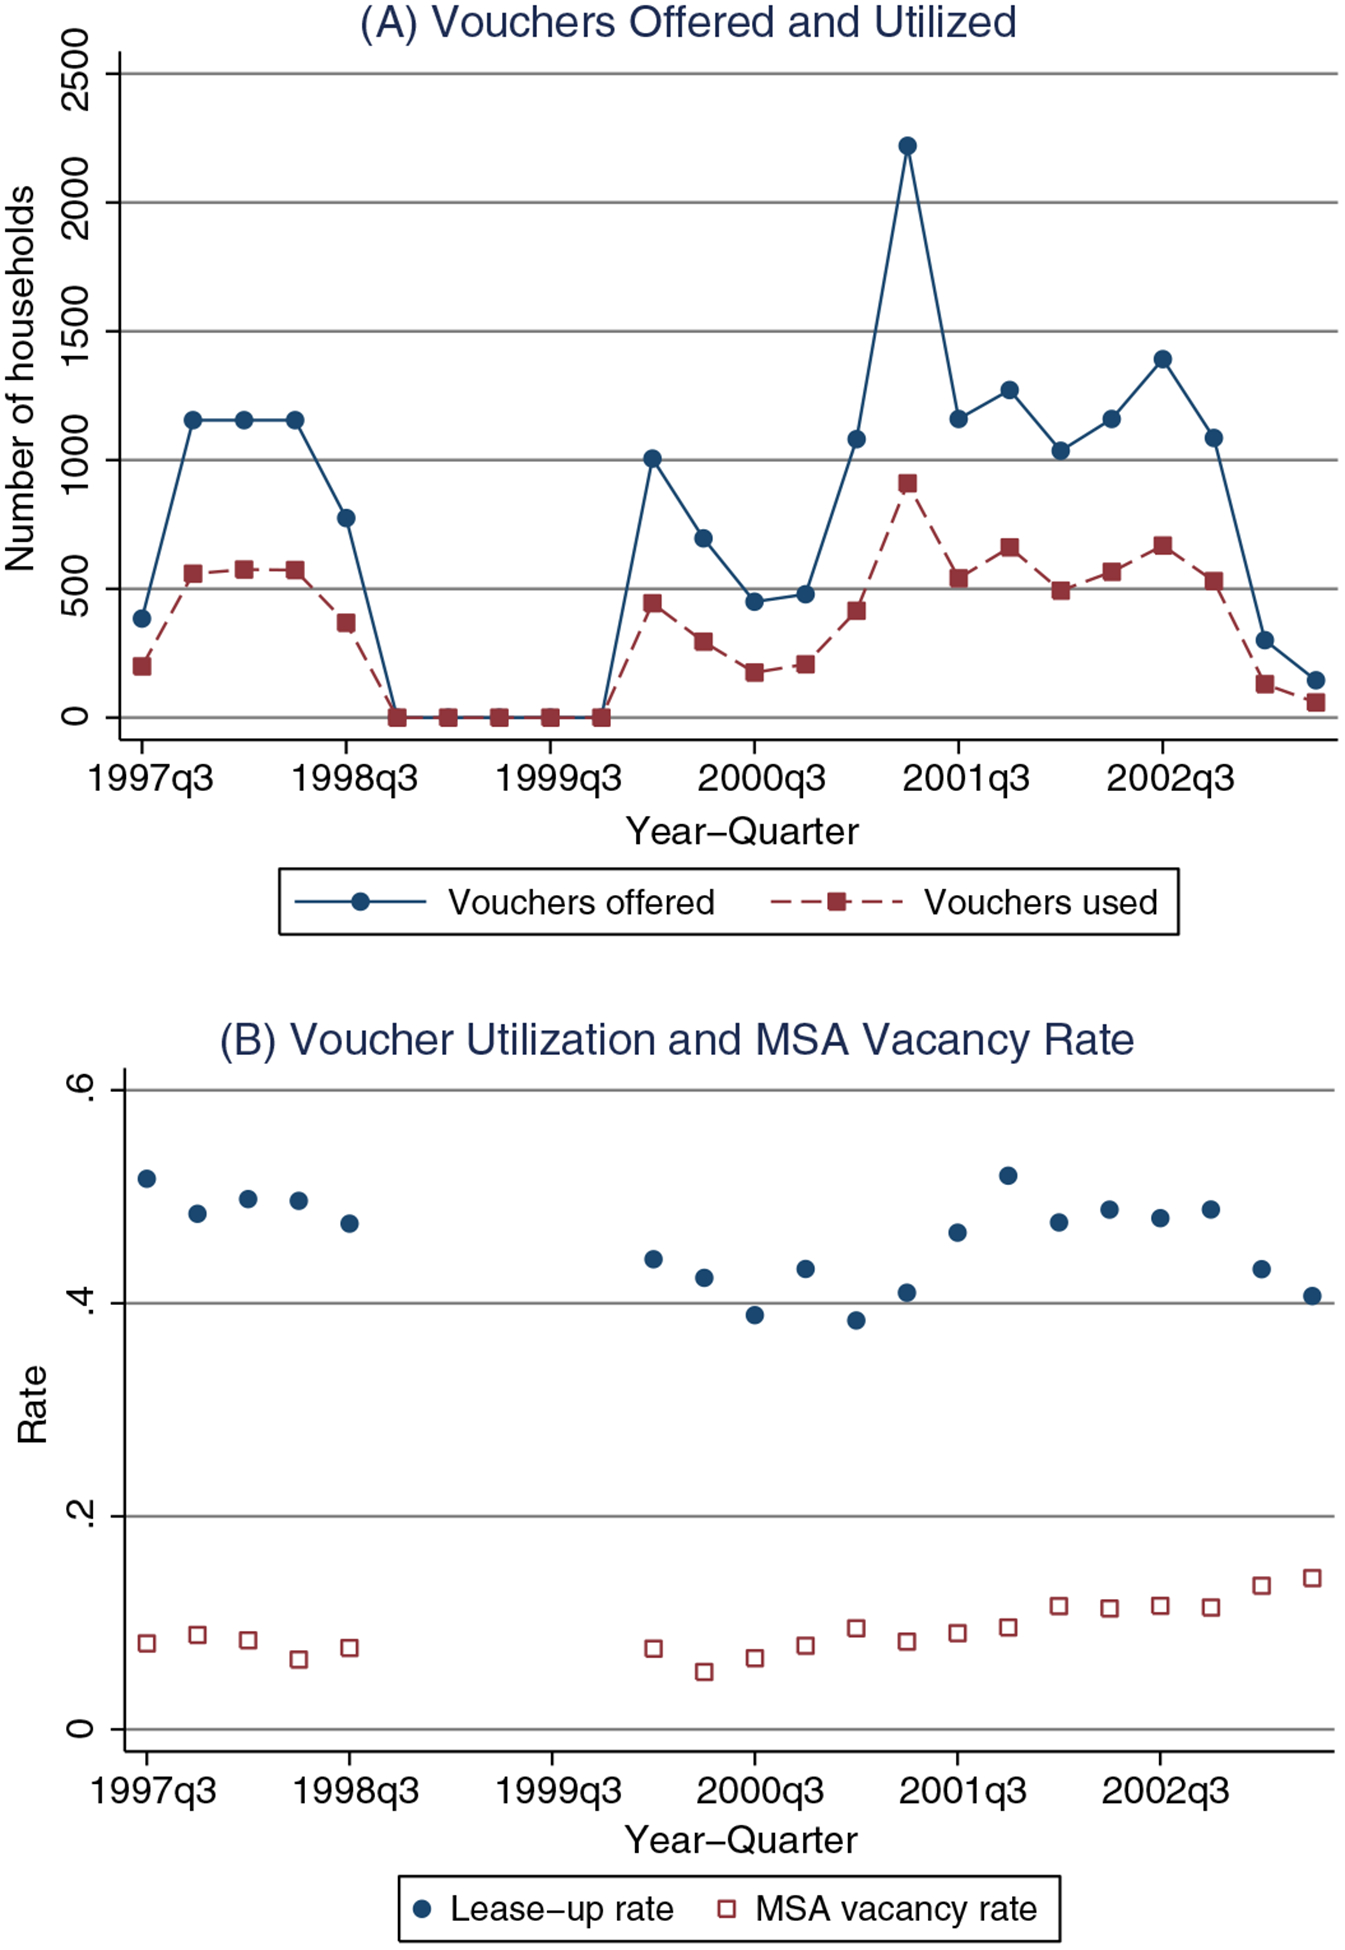
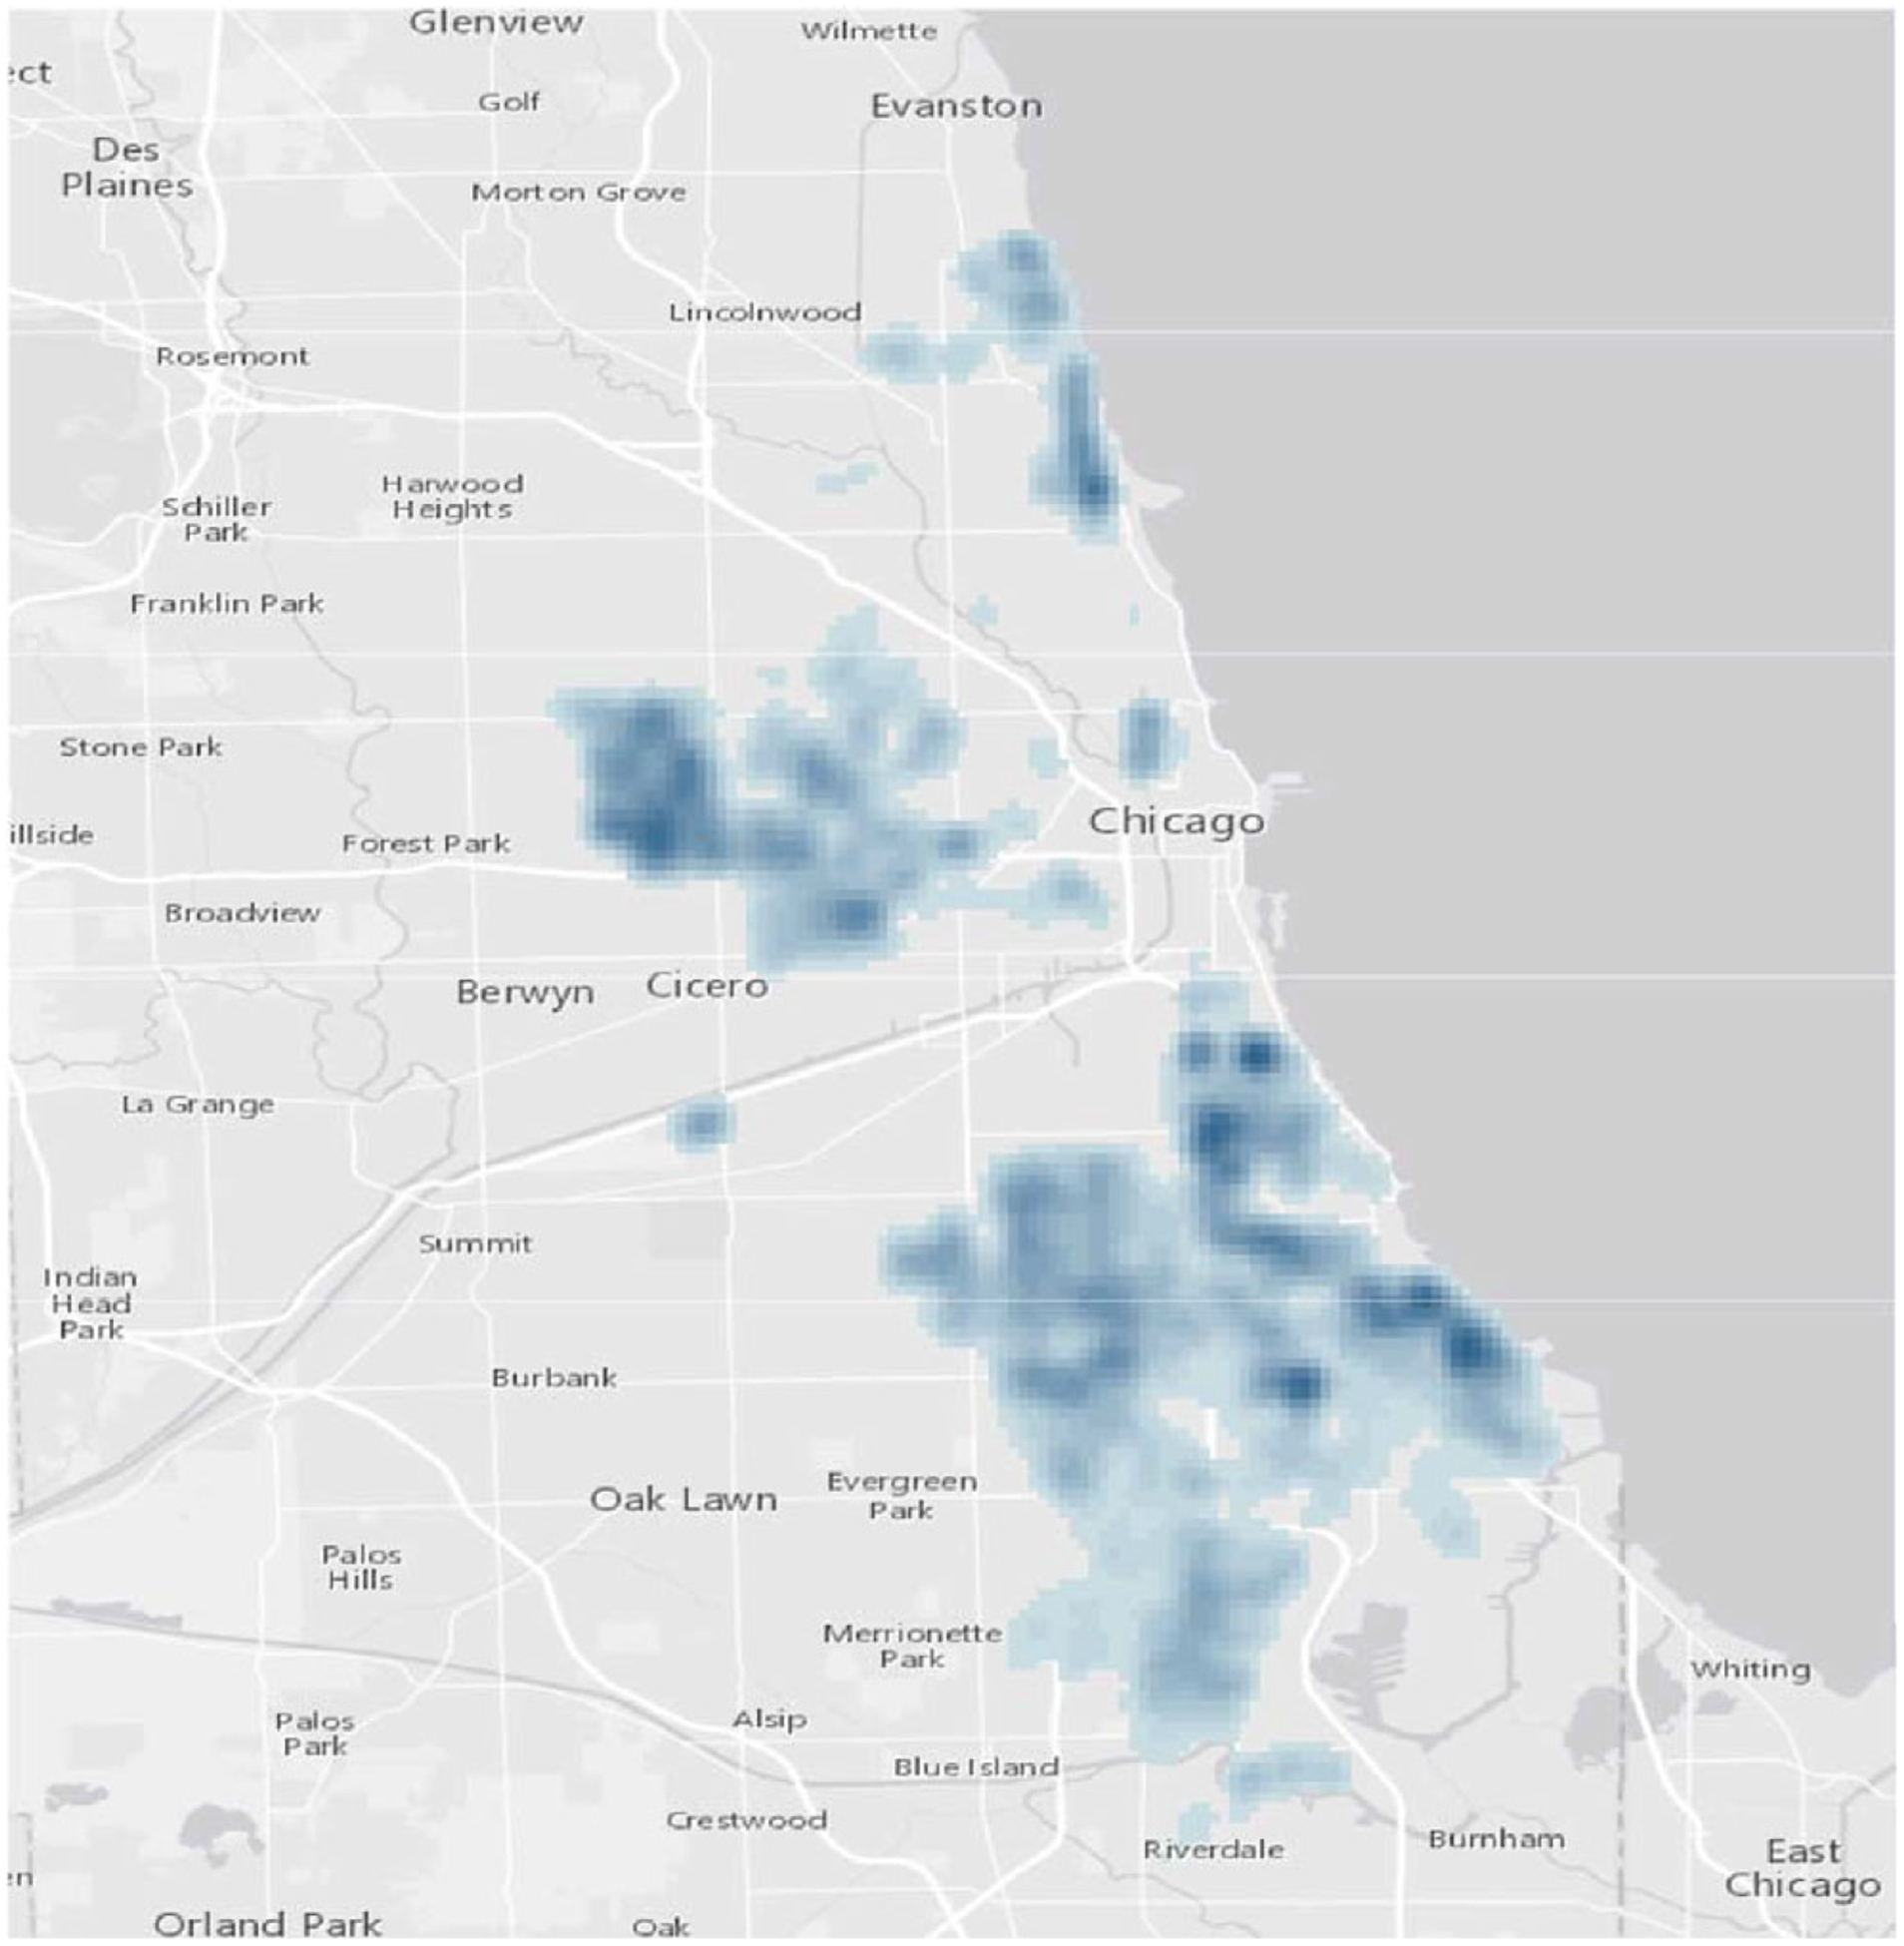
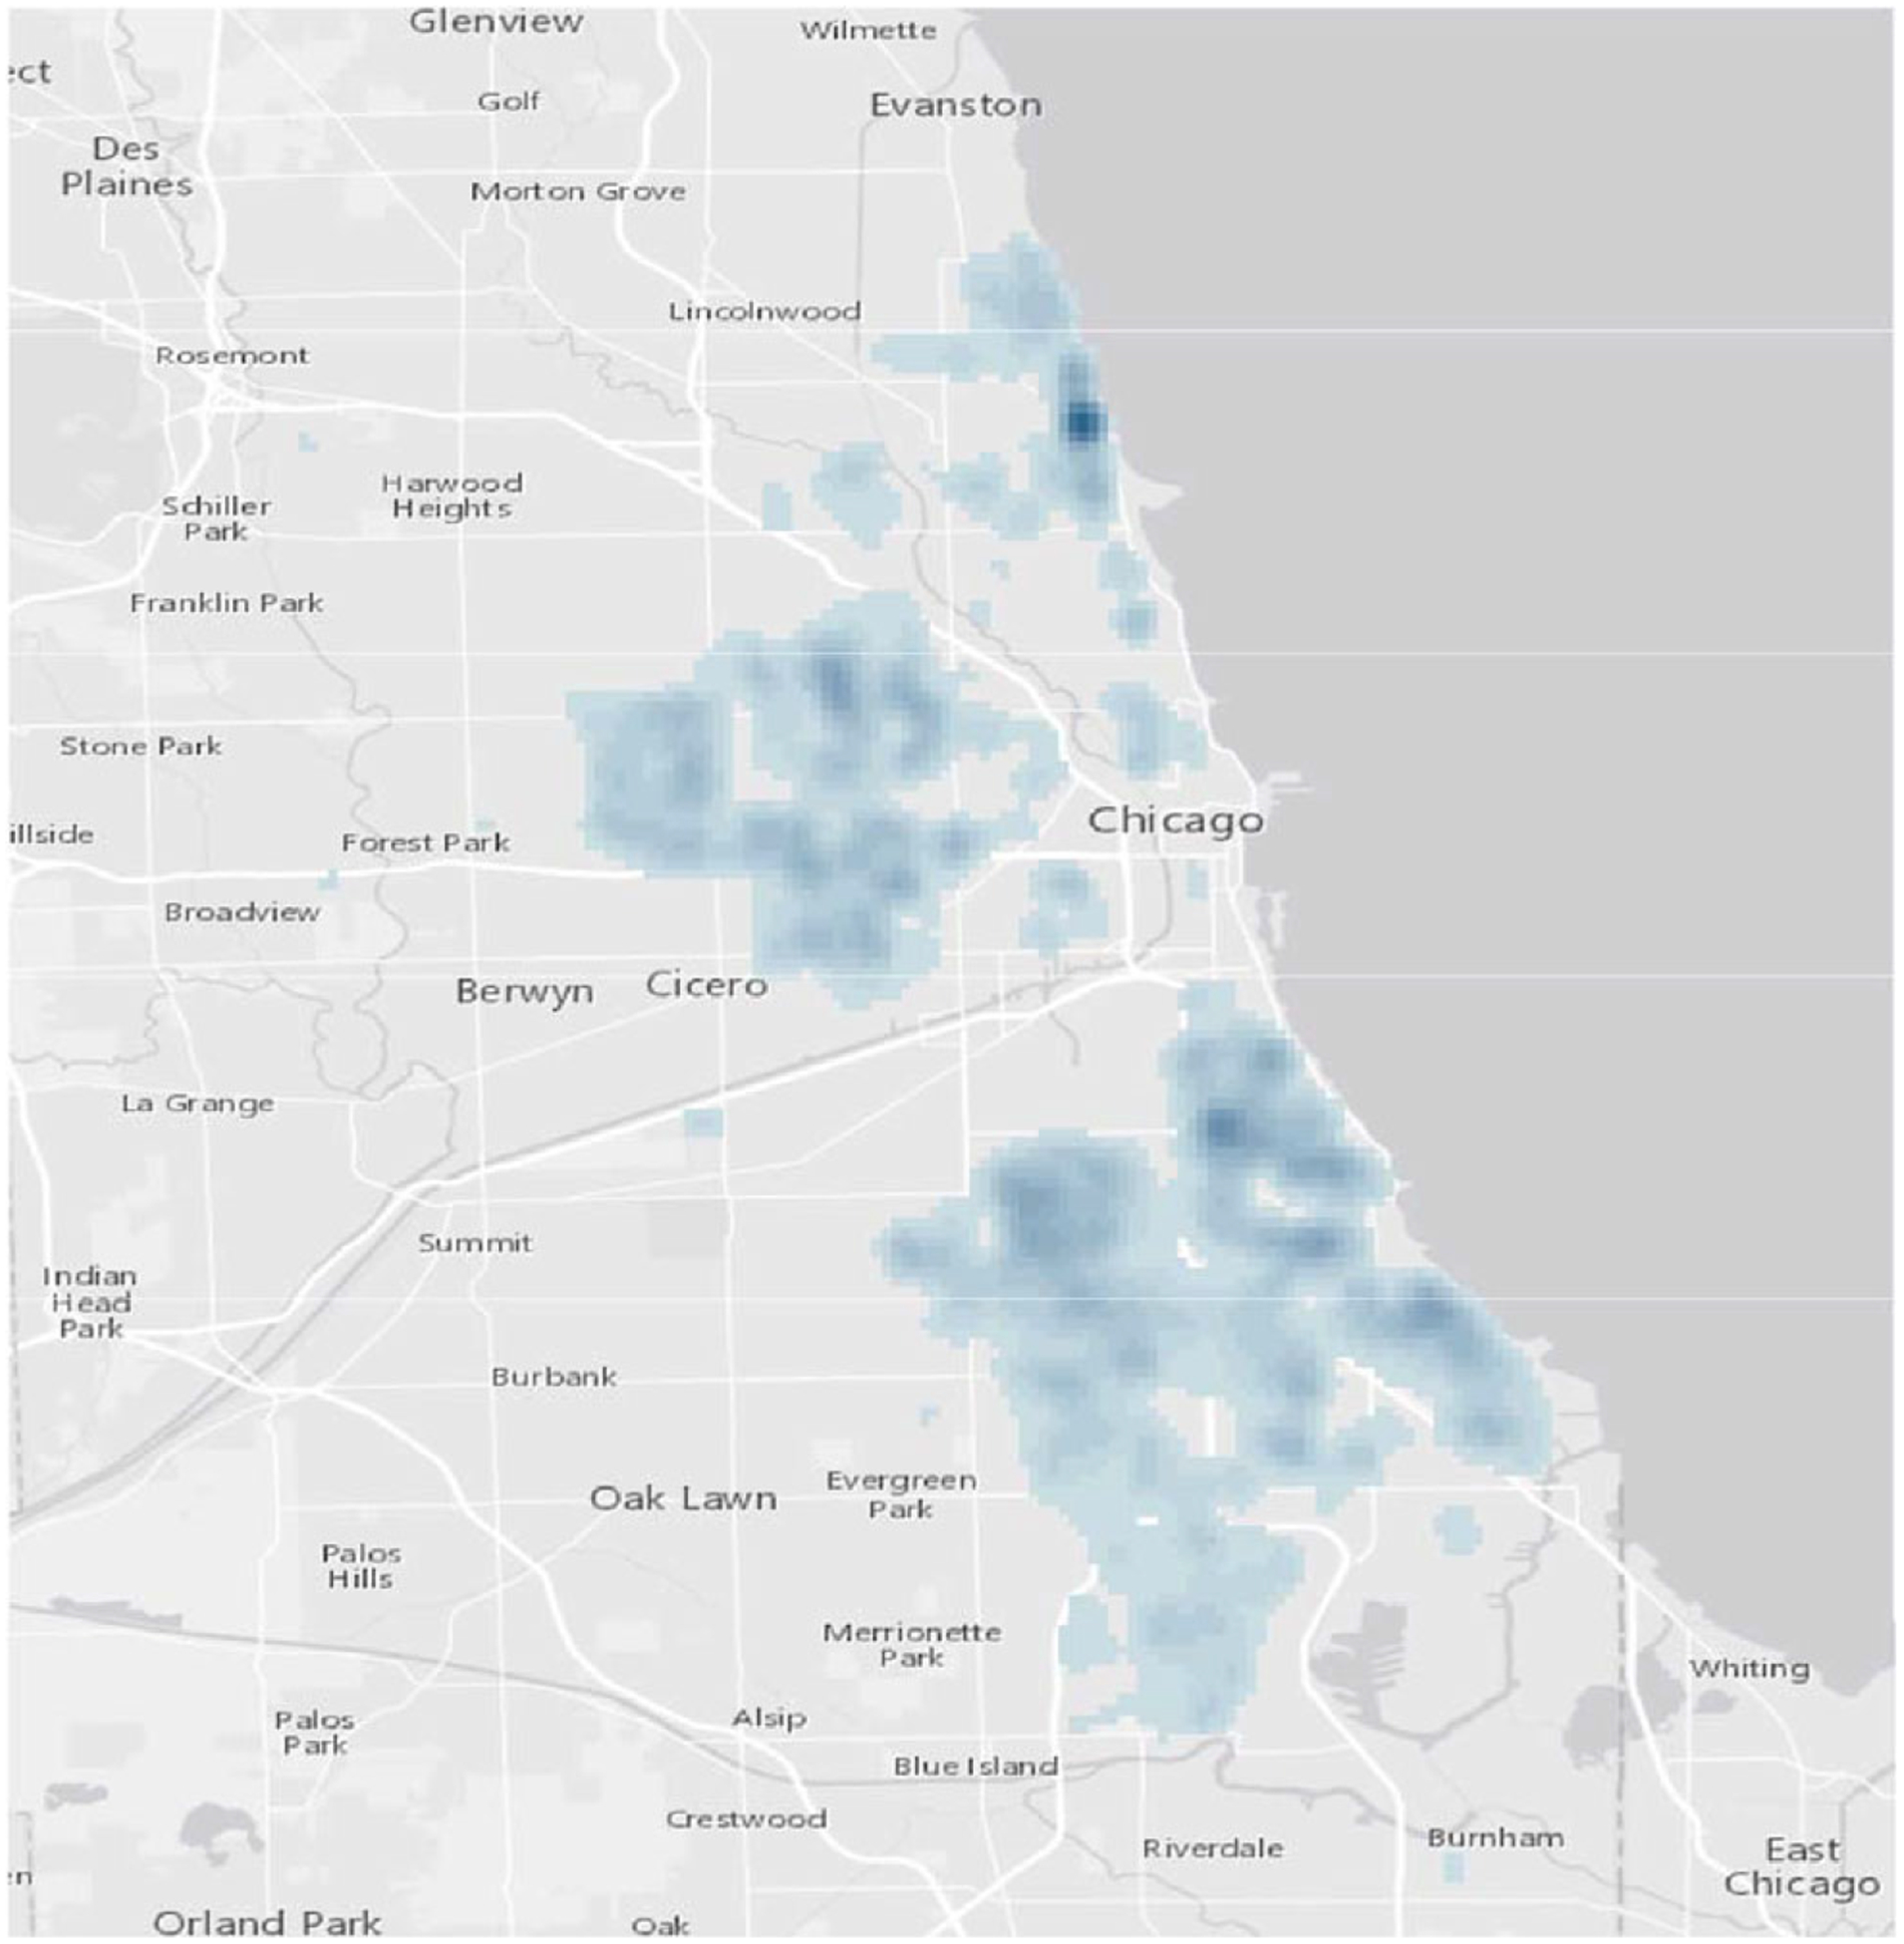
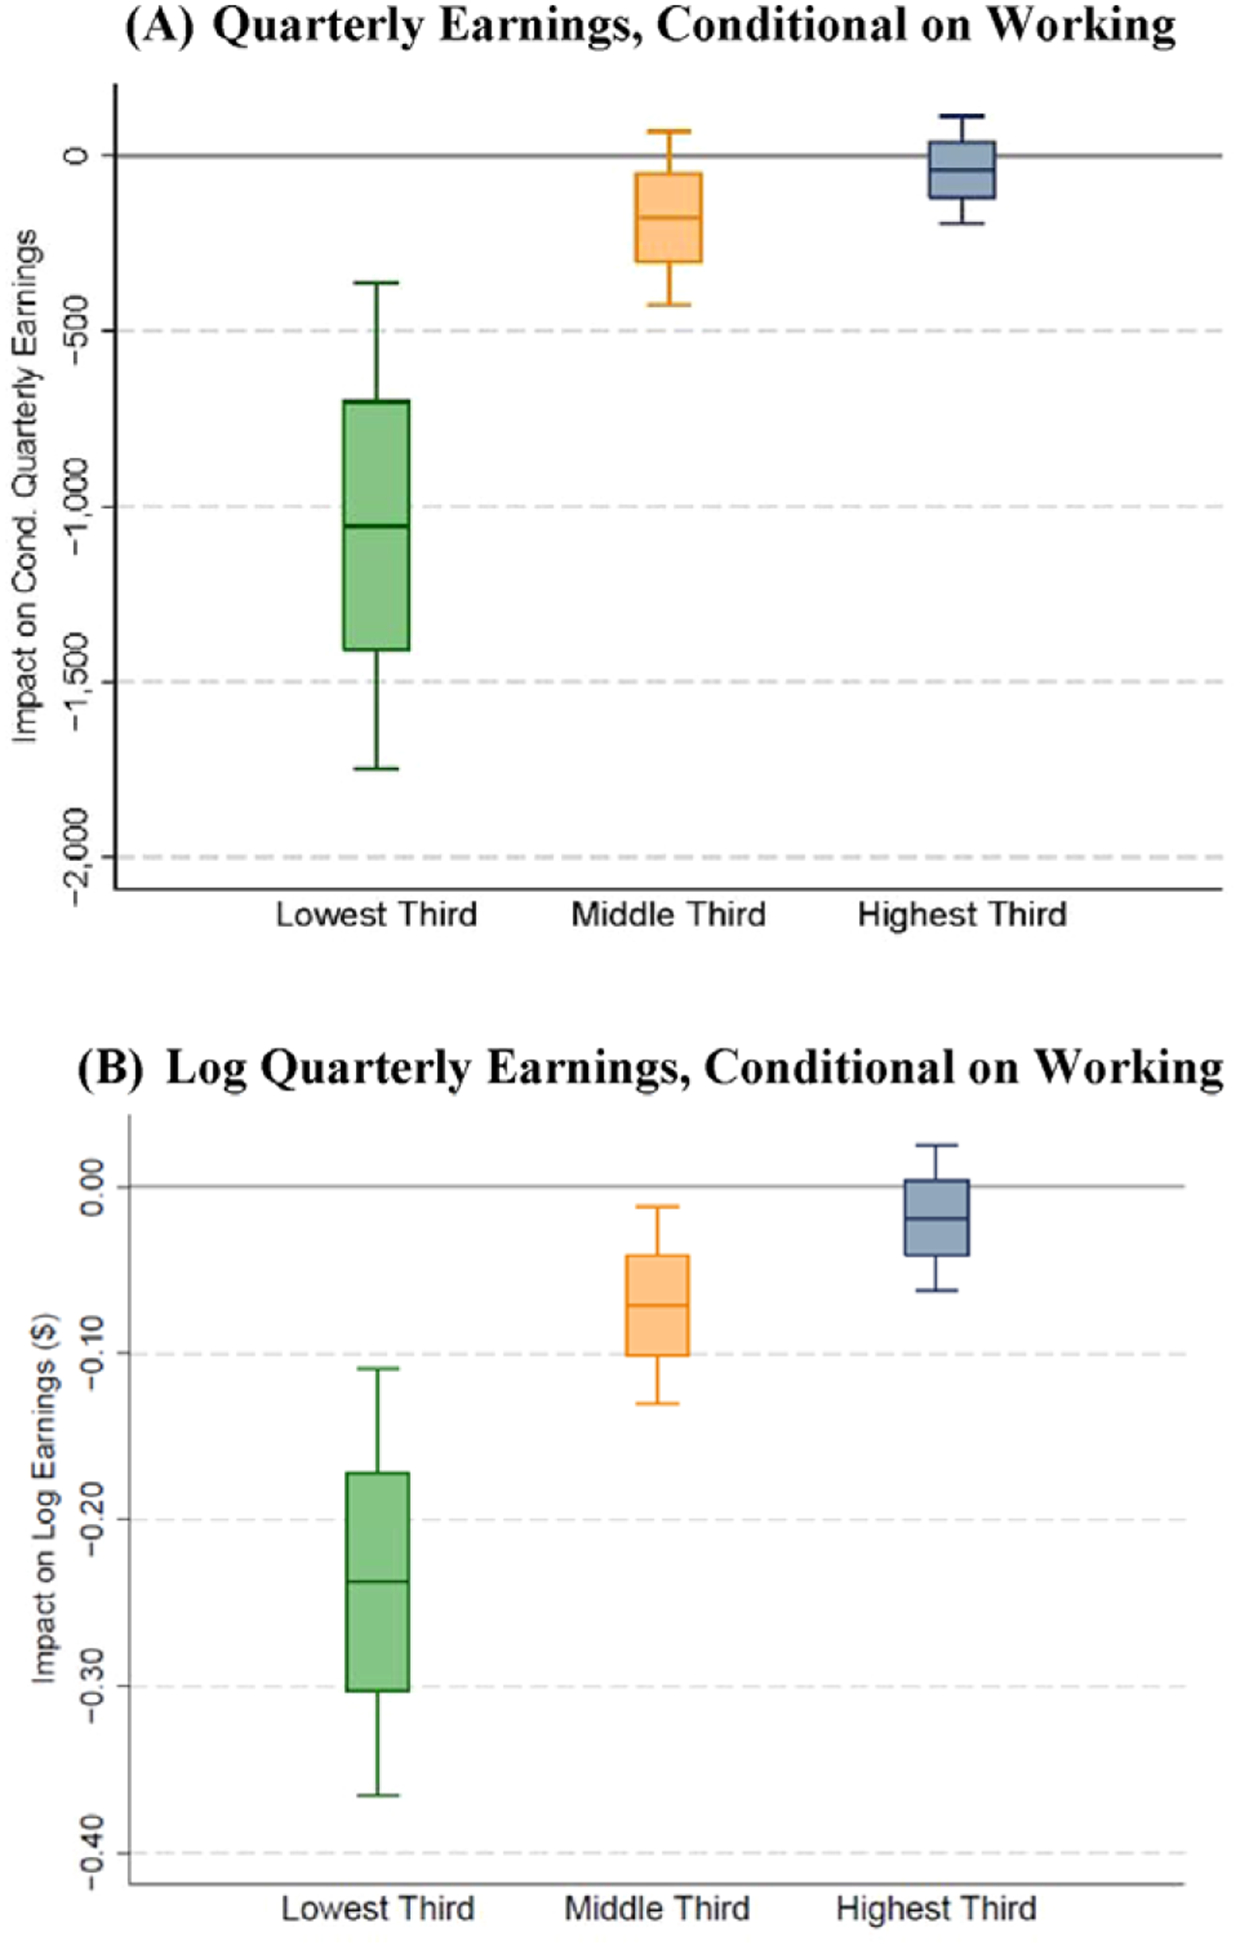
Low participation rates in government assistance programs are a major policy concern in the United States. This paper studies take-up of Section 8 housing vouchers, a program in which take-up rates are quite low among interested and eligible households. We link 18,109 households in Chicago that were offered vouchers through a lottery to administrative data and study how baseline employment, earnings, public assistance, arrests, residential location, and children's academic performance predict take-up. Our analysis finds mixed evidence of whether the most disadvantaged or distressed households face the largest barriers to program participation. We also study the causal impact of peer behavior on take-up by exploiting idiosyncratic variation in the timing of voucher offers. We find that the probability of lease-up increases with the number of neighbors who recently received voucher offers. Finally, we explore the policy implications of increasing housing voucher take-up by applying reweighting methods to existing causal impact estimates of voucher receipt. This analysis suggests that greater utilization of vouchers may lead to larger reductions in labor market activity. Differences in take-up rates across settings may be important to consider when assessing the external validity of studies identifying the effects of public assistance programs.


Figures

Figure A1.
Figure A1.. Compliance Score Density
. Notes: The figure shows the kernel density estimate of the compliance scores estimated for our sample of 16,179 working-aged, able-bodied, CHAC 1997 lottery applicants living in private market housing. Details on estimation of this score are provided above.
Figure 1.
Figure 1.. Voucher Offers, Utilization, and MSA Vacancy Rate.
Notes: Figure 1A reports the number of CHAC vouchers issued to, and the number subsequently used by, families on the waiting list from 1997:III to 2003:II. No vouchers were issued from September 1998 until January 2000 in response to a discrimination lawsuit against the City of Chicago. Figure 1B reports the fraction of voucher offers made each quarter that were subsequently used (lease-up rate) and the annual, MSA-level vacancy rate.
Figure 2.
Figure 2.. Household Locations at Time of Voucher Lottery (July 1997).
Notes: Map displays the density of sample households throughout the Chicago area based on their baseline address. The highest concentrations of households, represented by the dark blue regions, are located in the historically low-income South and West sides of the city.
Figure 3.
Figure 3.. Heat Map of Voucher Lease-Up.
Notes: Map displays variation in voucher lease-up rates across Census tracts in the Chicago area with voucher recipients, based on their baseline address. Higher rates of voucher use are shaded dark blue.
Figure 4.
Figure 4.. Seasonality of Lease-Up.
Notes: Estimates in Figure 4A come from equation (1) in the text. Point estimates and 95 percent confidence intervals represent the difference in the probability of successful lease-up associated with each month relative to January (the omitted group). All regressions include controls for demographics, household composition, baseline neighborhood characteristics, MSA vacancy rate, year of voucher arrival, distances to local amenities, and missing indicators. Figure 4B calculates the predicted lease-up rate if vouchers were only offered during the X highest lease-up months of the year, where X is on the x-axis. For example, the first point, at X = 12, is the current lease-up rate, because vouchers are offered during all 12 months. The next point, at X = 11, is the lease-up rate if vouchers were only offered in the 11 months of the year with the highest lease-up rates based on Figure 4A. The final point, at X = 1, is the predicted lease-up rate if vouchers were only offered during the single highest lease-up month of the year, i.e., September.
Figure 5.
Figure 5.. LATE Effect of Vouchers on Earnings, by Compliance Score Subgroups.
Notes: These figures show box and whisker plots based on estimates of the LATE of vouchers on quarterly earnings (Figure 5A) and log quarterly earnings (Figure 5B), conditional on working. The center of the box is a point estimate obtained through 2SLS (see equations (2) and (3) in the text). The top and bottom of each box outline the range of estimates that fall within one standard error of the point estimate. The top and bottom whiskers are the range identified for the 95-percent confidence interval. Each of the three estimates pertains to a compliance score subgroup, which is based on the predicted probability of lease-up (compliance). All earnings measured in 2007 dollars.

References

    1. Allcott H (2015). Site selection bias in program evaluation. The Quarterly Journal of Economics, 130, 1117–1165.
    1. Andrews I, & Oster E (2017). Weighting for external validity. NBER Working Paper 23826.
    1. Aronow PM, & Carnegie A (2013). Beyond LATE: Estimation of the average treatment effect with an instrumental variable. Political Analysis, 21, 492–506.
    1. Angrist J, & Fernandez-Val I (2010). ExtrapoLATE-Ing: External validity and overidentification in the LATE framework. NBER Working Paper 16566.
    1. Angrist J, Imbens GW, & Rubin DB (1996). Identification of causal effects using instrumental variables. Journal of the American Statistical Association, 91, 444–455.

LinkOut - more resources