Multi-Stage Cortical Plasticity Induced by Visual Contrast Learning
- PMID: 33408602
- PMCID: PMC7779615
- DOI: 10.3389/fnins.2020.555701
Multi-Stage Cortical Plasticity Induced by Visual Contrast Learning
Abstract
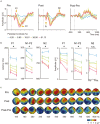
Perceptual learning, the improved sensitivity via repetitive practice, is a universal phenomenon in vision and its neural mechanisms remain controversial. A central question is which stage of processing is changed after training. To answer this question, we measured the contrast response functions and electroencephalography (EEG) before and after ten daily sessions of contrast detection training. Behavioral results showed that training substantially improved visual acuity and contrast sensitivity. The learning effect was significant at the trained condition and partially transferred to control conditions. Event-related potential (ERP) results showed that training reduced the latency in both early and late ERPs at the trained condition. Specifically, contrast-gain-related changes were observed in the latency of P1, N1-P2 complex, and N2, which reflects neural changes across the early, middle, and high-level sensory stages. Meanwhile, response-gain-related changes were found in the latency of N2, which indicates stimulus-independent effect in higher-level stages. In sum, our findings indicate that learning leads to changes across different processing stages and the extent of learning and transfer may depend on the specific stage of information processing.
Keywords: ERP; contrast gain; latency; perceptual learning; response gain.
Copyright © 2020 Xi, Zhang, Jia, Chen, Yang, Wang, Dai, Zhang and Huang.
Conflict of interest statement
The authors declare that the research was conducted in the absence of any commercial or financial relationships that could be construed as a potential conflict of interest.
Figures


Similar articles
-
Learning to be fast: gain accuracy with speed.Vision Res. 2012 May 15;61:115-24. doi: 10.1016/j.visres.2011.09.015. Epub 2011 Oct 19. Vision Res. 2012. PMID: 22037306
-
Improvement in visual search with practice: mapping learning-related changes in neurocognitive stages of processing.J Neurosci. 2015 Apr 1;35(13):5351-9. doi: 10.1523/JNEUROSCI.1152-14.2015. J Neurosci. 2015. PMID: 25834059 Free PMC article.
-
Making perceptual learning practical to improve visual functions.Vision Res. 2009 Oct;49(21):2566-73. doi: 10.1016/j.visres.2009.06.005. Epub 2009 Jun 9. Vision Res. 2009. PMID: 19520103
-
Neural plasticity underlying visual perceptual learning in aging.Brain Res. 2015 Jul 1;1612:140-51. doi: 10.1016/j.brainres.2014.09.009. Epub 2014 Sep 8. Brain Res. 2015. PMID: 25218557 Free PMC article. Review.
-
Electroencephalography During Nociceptive Stimulation in Chronic Pain Patients: A Systematic Review.Pain Med. 2020 Dec 25;21(12):3413-3427. doi: 10.1093/pm/pnaa131. Pain Med. 2020. PMID: 32488229
Cited by
-
Learning at your brain's rhythm: individualized entrainment boosts learning for perceptual decisions.Cereb Cortex. 2023 Apr 25;33(9):5382-5394. doi: 10.1093/cercor/bhac426. Cereb Cortex. 2023. PMID: 36352510 Free PMC article.
-
The effect of initial performance on motion perception improvements is modulated by training method.Atten Percept Psychophys. 2022 Jan;84(1):179-187. doi: 10.3758/s13414-021-02381-3. Epub 2021 Oct 17. Atten Percept Psychophys. 2022. PMID: 34657999
-
Fast perceptual learning induces location-specific facilitation and suppression at early stages of visual cortical processing.Front Hum Neurosci. 2025 Jan 17;18:1473644. doi: 10.3389/fnhum.2024.1473644. eCollection 2024. Front Hum Neurosci. 2025. PMID: 39897083 Free PMC article.
-
Configuration perceptual learning and its relationship with element perceptual learning.J Vis. 2022 Dec 1;22(13):2. doi: 10.1167/jov.22.13.2. J Vis. 2022. PMID: 36454549 Free PMC article.
-
Lower Internal Additive Noise and Better Perceptual Template Characterize Binocular Contrast Sensitivity Summation.Front Psychol. 2021 Sep 30;12:740759. doi: 10.3389/fpsyg.2021.740759. eCollection 2021. Front Psychol. 2021. PMID: 34659058 Free PMC article.
References
LinkOut - more resources
Full Text Sources

