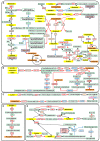
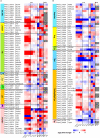
FIGURE 1
Amino acid catabolic pathways in P. tricornutum. The yellow text box represents amino acids, the orange text boxes indicate metabolites that could enter the TCA cycle, the white text boxes with green borders indicate other metabolites, and the white text boxes with black borders indicate the enzymes. The different font colors of enzymes represent different predicted subcellular locations: plastid localization in green font; mitochondria location in blue font; multiple isoenzymes with the plastid and mitochondria localization in orange font; those with mitochondria and other location in brown font; those with plastid and other localization in purple font; and those with plastid, mitochondria, and other localization in red font. Up-regulated genes are indicated with red lines, and down-regulated genes with blue lines. (A) Catabolic pathways of all 20 amino acids. (B) Catabolic pathways of BCAAs. (C) Catabolic pathways of lysine. (D) Catabolic pathways of tyrosine. (E) Catabolic pathways of serine, methionine, cysteine, and glycine. ACAT, acetyl-CoA C-acyltransferase (EC2.3.1.16); ACD, acyl-CoA dehydrogenase (EC1.3.8.1); AGX, alanine–glyoxylate aminotransferase (EC:2.6.1.44); AHCYL, adenosylhomocysteinase (EC3.3.1.1); ALDH, aldehyde dehydrogenase (EC1.2.1.31); ALDH18A1, delta-1-pyrroline-5-carboxylate synthetase (EC2.7.2.11 and EC1.2.1.41); ALDH4A1, 1-pyrroline-5-carboxylate dehydrogenase (EC1.2.1.88); ALS, acetolactate synthase (EC2.2.1.6); ALT, alanine transaminase (EC2.6.1.2); Arg, arginase (EC3.5.3.1); ASA, aspartate–ammonia ligase (EC6.3.1.1); ASL, argininosuccinate lyase (EC4.3.2.1); ASNase, asparaginase (EC3.5.1.1); ASNS, asparagine synthase (EC6.3.5.4); ASS, argininosuccinate synthase (EC6.3.4.5); AST, aspartate aminotransferase (EC2.6.1.1); BCAT, branched-chain amino acid transaminase (EC2.6.1.42); BCKDH, branched-chain α-keto acid dehydrogenase (EC1.2.4.4); CBL, cysteine-S-conjugate beta-lyase (EC4.4.1.13); Cbs, cystathionine beta-synthase (EC4.2.1.22); CMT, DNA (cytosine-5)-methyltransferase (EC2.1.1.37); CPSII, carbamoyl-phosphate synthase II (EC6.3.5.5); CTH, cystathionine gamma-lyase (EC4.4.1.1); CysK, cysteine synthase (EC2.5.1.47); DHAD, dihydroxy-acid dehydratase (EC4.2.1.9); DHLTA, dihydrolipoyllysine-residue (2-methylpropanoyl) transferase (EC2.3.1.168); DLDH, dihydrolipoyl dehydrogenase (EC1.8.1.4); DLST, dihydrolipoamide succinyltransferase; ECHS, enoyl-CoA hydratase (EC4.2.1.17); FAH, fumarylacetoacetase (EC3.7.1.2); GCDH, glutaryl-CoA dehydrogenase (EC1.3.8.6); GDCH, glycine cleavage system H protein; GDCP, glycine decarboxylase p-protein (EC1.4.4.2); GDCT, glycine decarboxylase t-protein (EC2.1.2.10); GLDH, glutamate dehydrogenase (EC1.4.1.2 and EC1.4.1.4); GOGAT, glutamine 2-oxoglutarate aminotransferase (EC1.4.1.13, EC1.4.1.14, and EC1.4.7.1); GS, glutamine synthetase (EC6.3.1.2); HAD, 3-hydroxyacyl-CoA dehydrogenase (EC1.1.1.35); HCL, hydroxymethylglutaryl-CoA lyase (EC4.1.3.4); HDC, histidine decarboxylase (EC:4.1.1.22); HGD, homogentisate 1,2-dioxygenase (EC1.13.11.5); HIBADH, 3-hydroxyisobutyrate dehydrogenase (EC1.1.1.31); HIBCH, 3-hydroxyisobutyryl-CoA hydrolase (EC3.1.2.4); HisAT, histidine transaminase (EC2.6.1.38); HPD, 4-hydroxyphenylpyruvate dioxygenase (EC1.13.11.27); IVD, isovaleryl-CoA dehydrogenase (EC1.3.8.4); KARI, ketol-acid reductoisomerase (EC1.1.1.86); KAT, kynurenine aminotransferase (EC2.6.1.39); LKR, lysine-2-oxoglutarate reductase (EC1.5.1.8); L-SD, L-serine ammonia-lyase (EC4.3.1.17); MAAI, maleylacetoacetate isomerase (EC5.2.1.2); MAT, S-adenosylmethionine synthetase (EC2.5.1.6); MCC, methylcrotonyl-CoA carboxylase (EC6.4.1.4); MCD, 2-methylacyl-CoA dehydrogenase (EC1.3.99.12); MCEE, methylmalonyl-CoA epimerase (EC5.1.99.1); MCM, methylmalonyl-CoA mutase (EC5.4.99.2); METH, methionine synthase (EC2.1.1.13); MGCHS, methylglutaconyl-CoA hydratase (EC4.2.1.18); MGL, methionine gamma-lyase (EC4.4.1.11); MMSDH, methylmalonate semialdehyde dehydrogenase (EC1.2.1.27); MPST, 3-mercaptopyruvate sulfurtransferase (EC2.8.1.2); MS, malate synthase (EC2.3.3.9); OAT, ornithine aminotransferase (EC2.6.1.13); OCD, ornithine cyclodeaminase (EC4.3.1.12); Odc, ornithine decarboxylase (EC4.1.1.17); OTC, ornithine carbamoyltransferase (EC2.1.3.3); PAH, phenylalanine hydroxylase (EC1.14.16.1); PCC, propionyl-CoA carboxylase (EC6.4.1.3); PRODH, proline dehydrogenase (EC1.5.5.2); PYCR, pyrroline-5-carboxylate reductase (EC1.5.1.2); SATase, serine O-acetyltransferase (EC2.3.1.30); SDH, saccharopine dehydrogenase (EC1.5.1.9); SHMT, serine hydroxymethyltransferase (EC2.1.2.1); TA, threonine aldolase (EC4.1.2.5); TAT, tyrosine aminotransferase (EC2.6.1.5); TDA, threonine deaminase (EC4.3.1.19); Tpase, tryptophanase (EC4.1.99.1); TS, tryptophan synthase (EC4.2.1.20)..


