. 2021 Jan 1;11(4):1845-1863.
doi: 10.7150/thno.50905. eCollection 2021.

Mitochondrial ROS promote mitochondrial dysfunction and inflammation in ischemic acute kidney injury by disrupting TFAM-mediated mtDNA maintenance

Affiliations

Mitochondrial ROS promote mitochondrial dysfunction and inflammation in ischemic acute kidney injury by disrupting TFAM-mediated mtDNA maintenance

Meng Zhao et al. Theranostics. .

Abstract

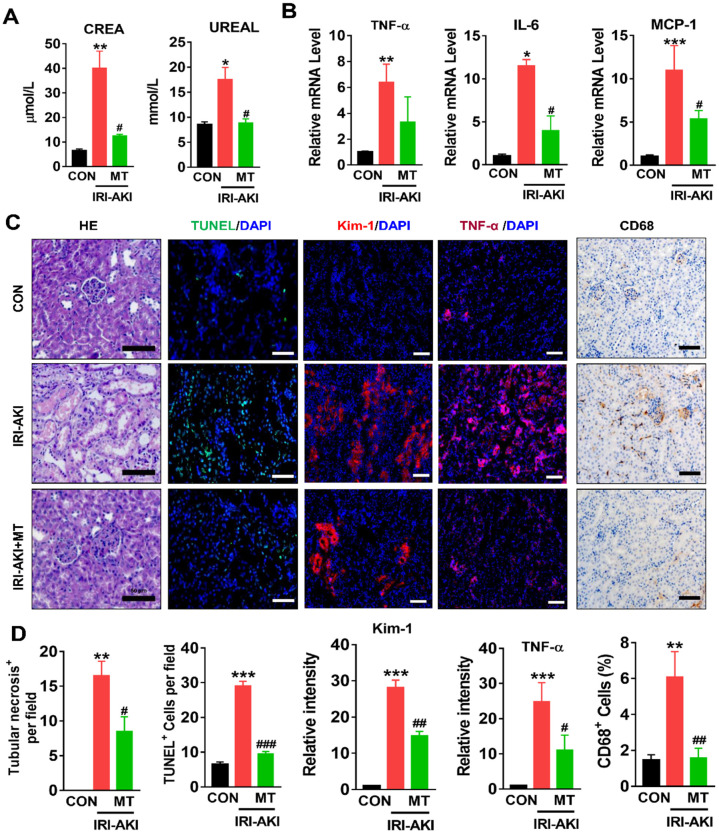
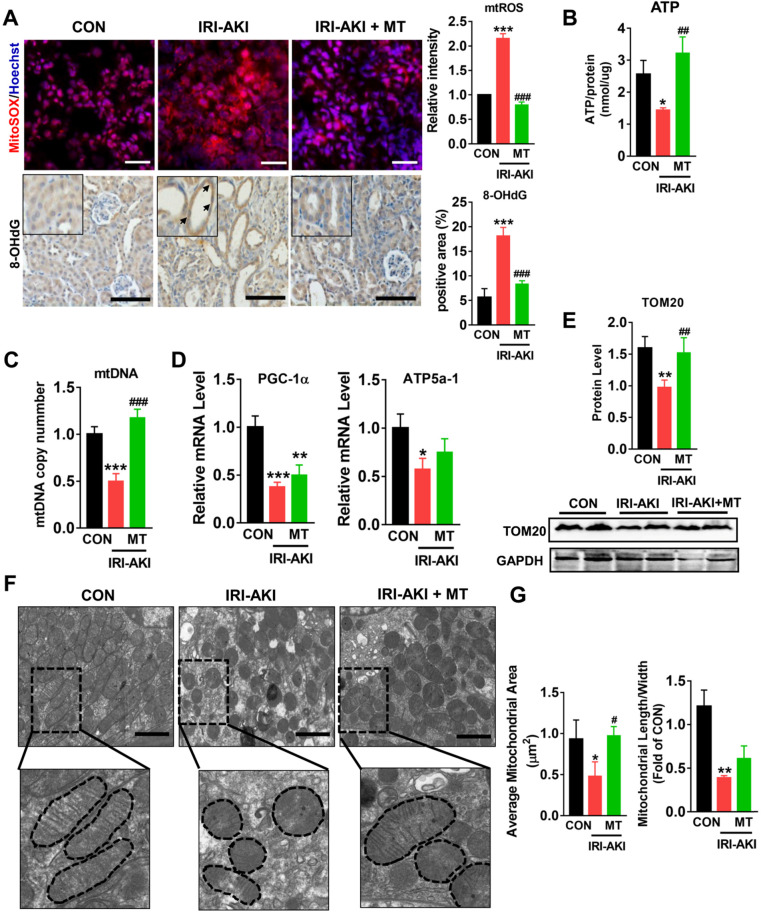
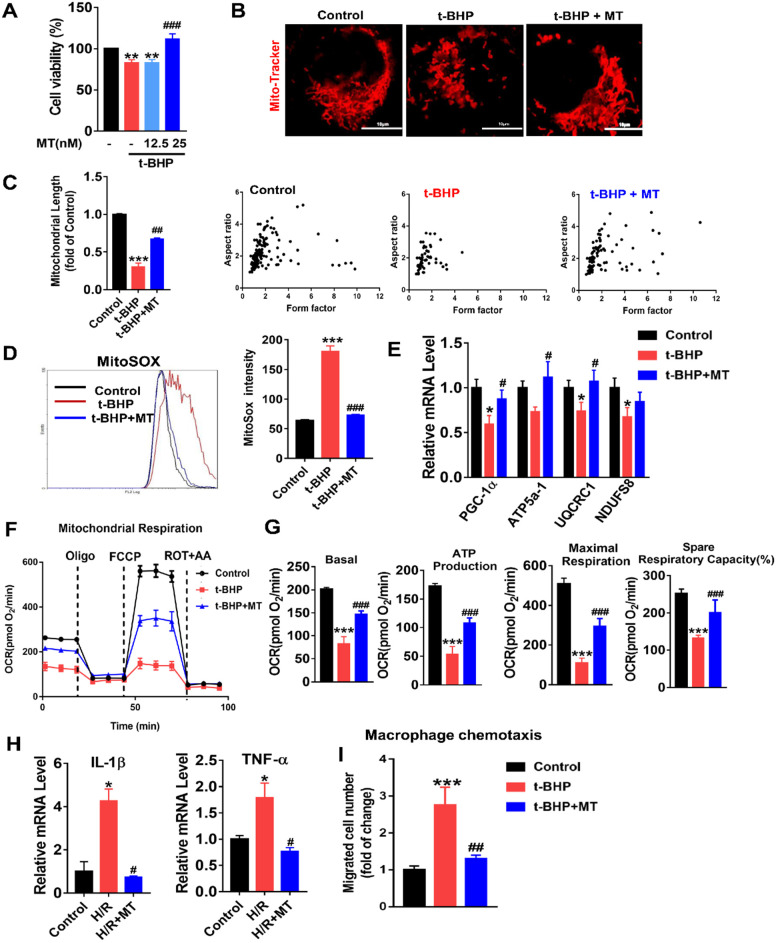
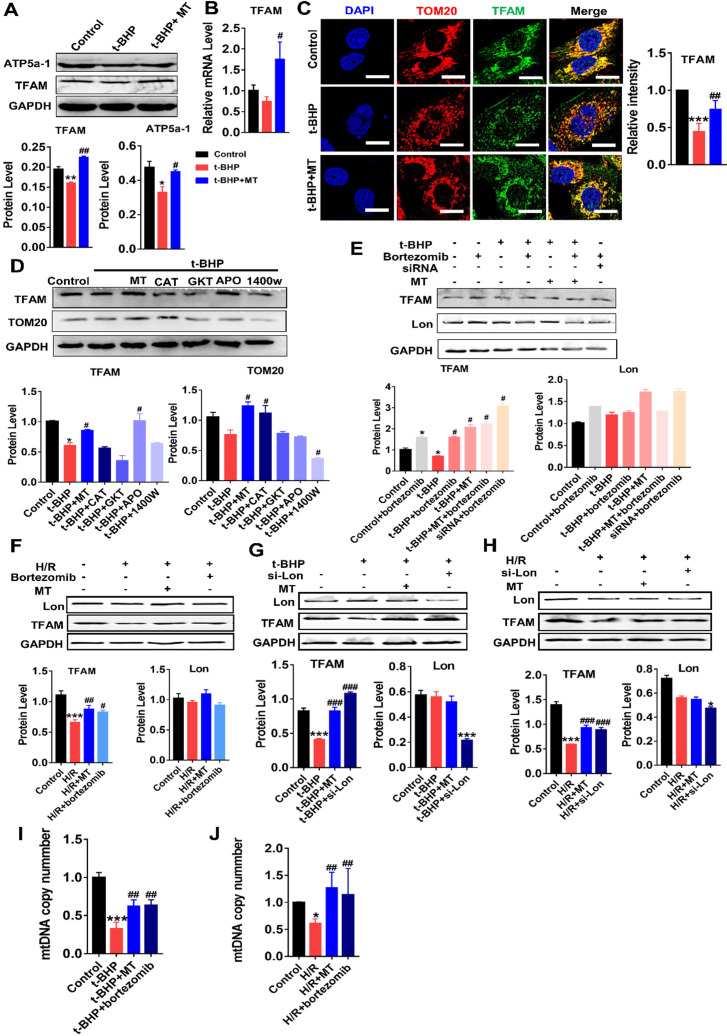
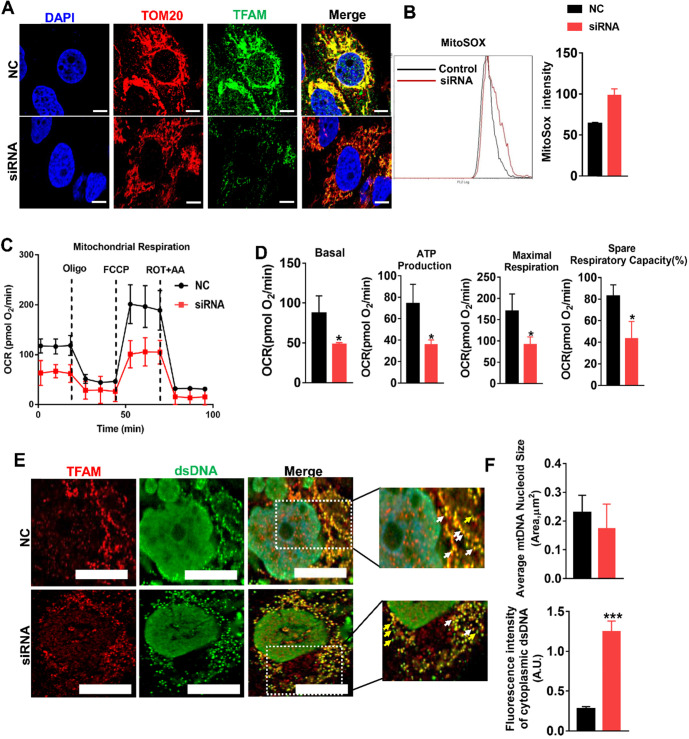
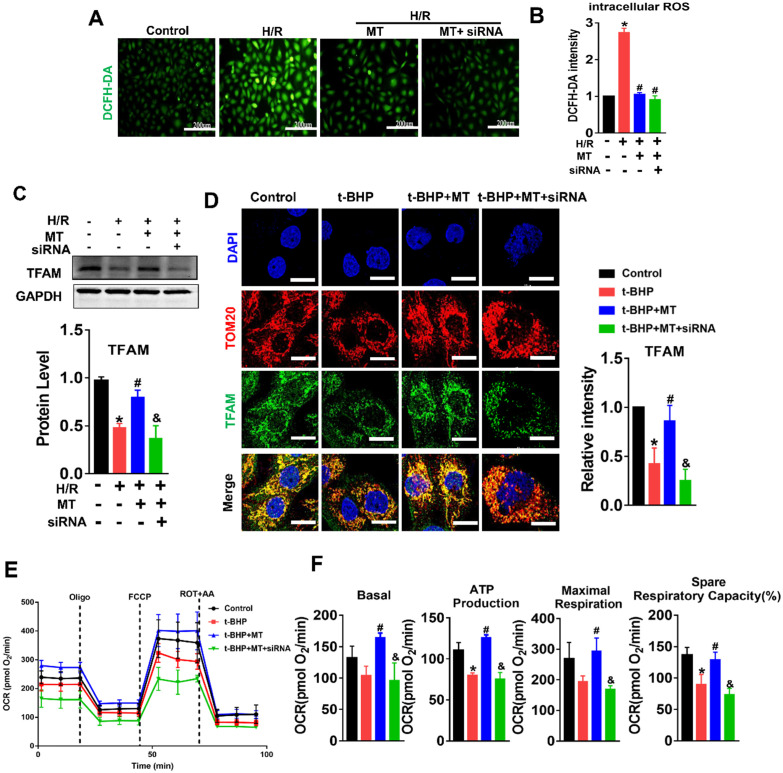
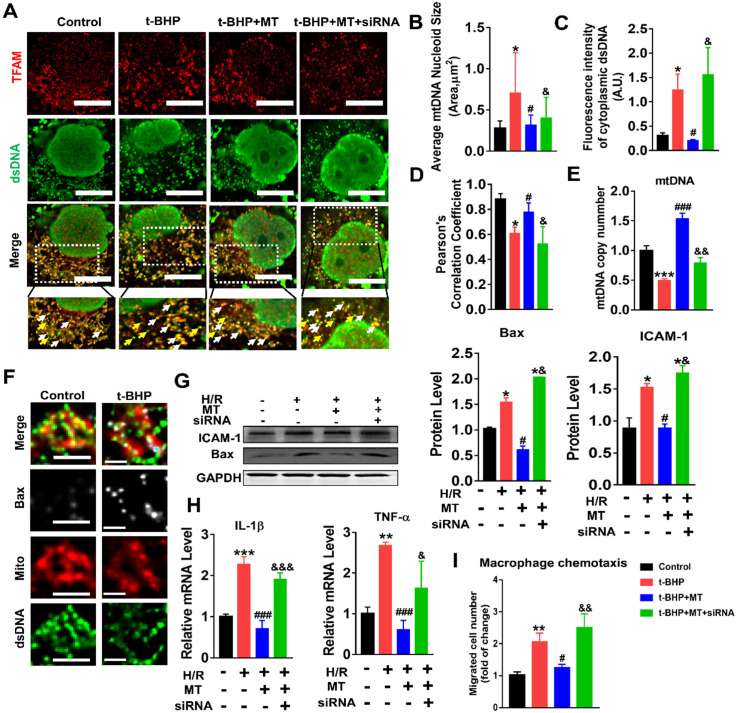
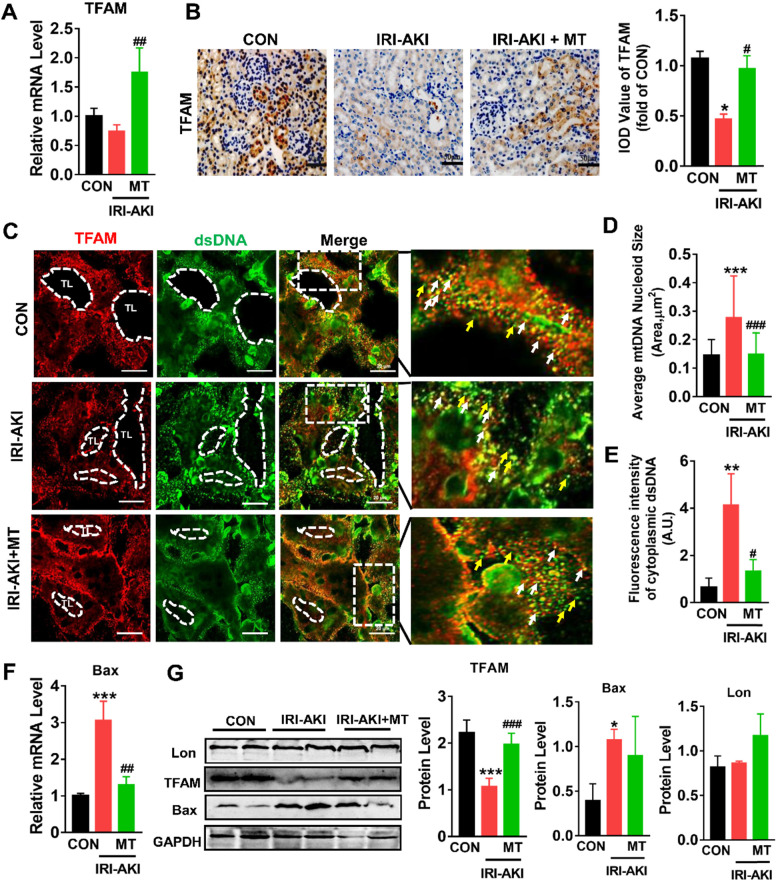
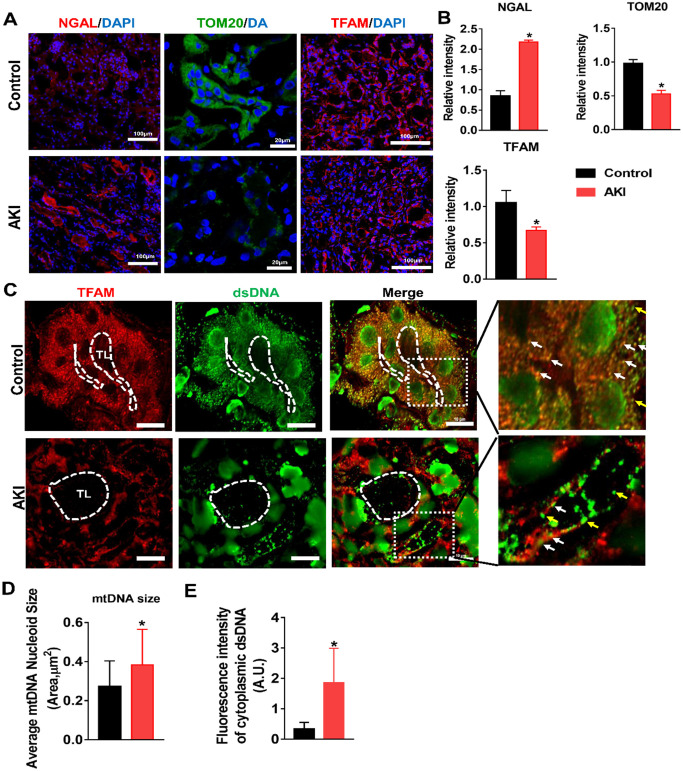
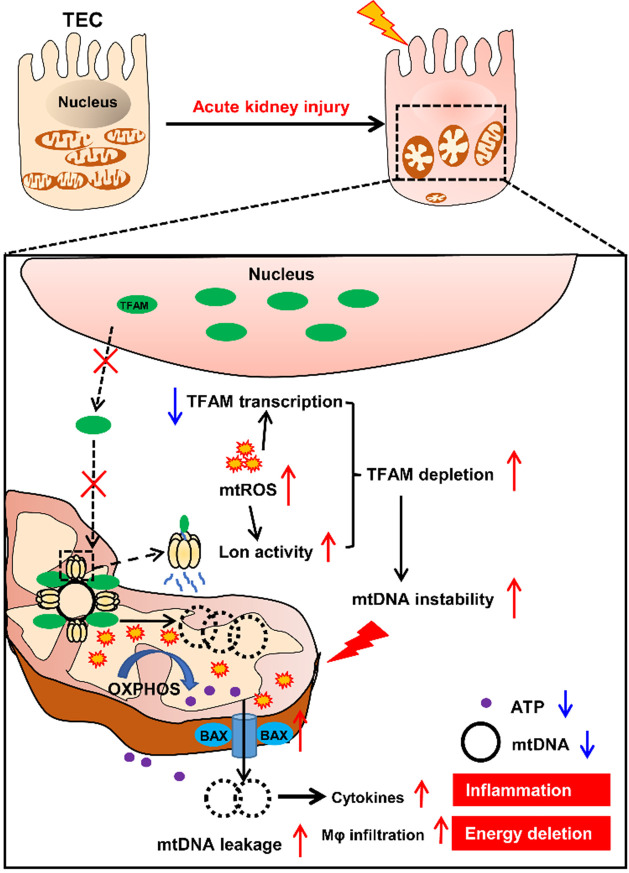
Aims: Ischemia-reperfusion injury (IRI)-induced acute kidney injury (IRI-AKI) is characterized by elevated levels of reactive oxygen species (ROS), mitochondrial dysfunction, and inflammation, but the potential link among these features remains unclear. In this study, we aimed to investigate the specific role of mitochondrial ROS (mtROS) in initiating mitochondrial DNA (mtDNA) damage and inflammation during IRI-AKI. Methods: The changes in renal function, mitochondrial function, and inflammation in IRI-AKI mice with or without mtROS inhibition were analyzed in vivo. The impact of mtROS on TFAM (mitochondrial transcription factor A), Lon protease, mtDNA, mitochondrial respiration, and cytokine release was analyzed in renal tubular cells in vitro. The effects of TFAM knockdown on mtDNA, mitochondrial function, and cytokine release were also analyzed in vitro. Finally, changes in TFAM and mtDNA nucleoids were measured in kidney samples from IRI-AKI mice and patients. Results: Decreasing mtROS levels attenuated renal dysfunction, mitochondrial damage, and inflammation in IRI-AKI mice. Decreasing mtROS levels also reversed the decrease in TFAM levels and mtDNA copy number that occurs in HK2 cells under oxidative stress. mtROS reduced the abundance of mitochondrial TFAM in HK2 cells by suppressing its transcription and promoting Lon-mediated TFAM degradation. Silencing of TFAM abolished the Mito-Tempo (MT)-induced rescue of mitochondrial function and cytokine release in HK2 cells under oxidative stress. Loss of TFAM and mtDNA damage were found in kidneys from IRI-AKI mice and AKI patients. Conclusion: mtROS can promote renal injury by suppressing TFAM-mediated mtDNA maintenance, resulting in decreased mitochondrial energy metabolism and increased cytokine release. TFAM defects may be a promising target for renal repair after IRI-AKI.

Keywords: ROS; TFAM; acute kidney injury; mitochondria; mtDNA.


Conflict of interest statement

Competing Interests: The authors have declared that no competing interest exists.

Figures

Figure 1
Figure 1
mtROS promoted renal dysfunction and inflammation in IRI-AKI mice. (A) Serum CREA and UREAL concentrations in mice in different groups on day 5 after IRI-AKI (n = 6). (B) Real-time PCR analysis of TNF-α, IL-6, and MCP-1 mRNA in the kidneys of mice in different groups on day 5 after IRI-AKI (n = 6). (C) Representative micrographs showing renal H&E staining (scale bar = 50 µm), TUNEL staining (scale bar = 100 µm), Kim-1 staining (scale bar = 100 µm), TNF-α IF staining (scale bar = 100 µm), and CD68 IHC staining (scale bar = 50 µm) in the kidneys of mice on day 5 after IRI-AKI. (D) Quantitative analysis of necrotic tubules, TUNEL+ apoptotic cells, Kim-1 expression, TNF-α expression, and CD68+ cell number in the kidneys of mice in different groups (n = 6). *p < 0.05 vs. CON group; **p < 0.01 vs. CON group; ***p < 0.001 vs. CON group; #p < 0.05 vs. IRI-AKI group; ##p < 0.01 vs. IRI-AKI group; ###p < 0.001 vs. IRI-AKI group.
Figure 2
Figure 2
mtROS promoted renal mitochondrial dysfunction in IRI-AKI mice. (A) Representative micrographs showing MitoSOX (scale bar = 50 µm) and 8-OHdG staining (scale bar = 50 µm) in the renal cortex and quantitative analysis of mtROS and 8-OHdG levels (n = 6). (B) Measurement of ATP levels in the kidneys of mice on day 5 after IRI-AKI (n = 6). (C) Measurement of mtDNA copy number levels in the kidneys on day 5 after IRI-AKI (n = 6). (D) Real-time PCR analysis of PGC-1-α and ATP5a-1 mRNA levels in the kidneys on day 5 after IRI-AKI (n = 6). (E) Western blotting for TOM20 protein in the kidneys and quantitative analysis of TOM20 protein expression. (F) Representative TEM images of mitochondria in the renal tubules of mice (scale bar = 2 µm). (G) Quantification of mitochondrial area and the ratio of mitochondrial length to width detected by TEM (n = 6). *p < 0.05 vs. CON group; **p < 0.01 vs. CON group; ***p < 0.001 vs. CON group; #p < 0.05 vs. IRI-AKI group; ##p < 0.01 vs. IRI-AKI group; ###p < 0.001 vs. IRI-AKI group.
Figure 3
Figure 3
mtROS-induced mitochondrial dysfunction and cytokine release in HK2 cells. (A) Cell viability was determined by the CCK8 assay (n = 3, **p < 0.01 vs. Control group, ###p < 0.001 vs. t-BHP group). (B) Representative micrographs showing MitoTracker staining in HK2 cells (scale bar = 10 µm) and (C) quantification of mitochondrial length. (D) mtROS were measured by flow cytometry after MitoSOX staining. (E) Real-time PCR analysis of PGC-1α, UQCRC1, NDUFS8, and ATP5a-1 mRNA levels in HK2 cells. (F) Measurement of mitochondrial oxygen consumption ratio (OCR) in HK2 cells. (G) Basal respiration, maximal respiration, ATP production, and spare respiratory capacity in HK2 cells (n = 3; ***p < 0.001 vs. Control group; ###p < 0.001 vs. t-BHP group). (H) Real-time PCR analysis of IL-1β and TNF-α mRNA levels in HK2 cells (n = 3; *p < 0.05 vs. Control group; #p < 0.05 vs. H/R group). (I) Relative migration of RAW264.7 cells in response to conditioned medium from HK2 cells (n = 3; ***p < 0.001 vs. Control group; ##p < 0.01 vs. t-BHP group).
Figure 4
Figure 4
mtROS suppressed TFAM transcription and enhanced TFAM degradation in HK2 cells. (A) Western blotting for TFAM and ATP5a1 proteins in HK2 cells and quantitative analysis of protein expression (n = 3; *p < 0.05 vs. Control group, **p < 0.01 vs. Control group; #p < 0.05 vs. t-BHP group, ##p < 0.01 vs. t-BHP group). (B) Real-time PCR analysis of TFAM mRNA levels in HK2 cells. (C) Double-IF staining of TOM20 (red) and TFAM (green) in HK2 cells (scale bar = 10 µm) and quantitative analysis of TFAM expression (***p < 0.001 vs. Control group; ##p < 0.01 vs. t-BHP group). (D) Western blotting for TFAM and TOM20 proteins in HK2 cells after various treatments and quantitative analysis of protein expression (n = 3; *p < 0.05 vs. Control group; #p < 0.05 vs. t-BHP group). (E) Western blotting for TFAM and Lon proteins in HK2 cells treated with t-BHP and various other agents (n = 3; *p < 0.05 vs. Control group; #p < 0.05 vs. t-BHP group). (F) Western blotting of TFAM and Lon proteins in HK2 cells under H/R with or without bortezomib treatment (n = 3; ***p < 0.001 vs. Control group; #p < 0.05 vs. H/R group, ##p < 0.01 vs. H/R group). (G) Western blotting of TFAM and Lon proteins in HK2 cells treated with t-BHP with or without si-Lon treatment (n = 3; ***p < 0.001 vs. Control group; ###p < 0.001 vs. t-BHP group). (H) Western blotting of TFAM and Lon protein and quantitative analysis of protein expression in HK2 cells under H/R with or without si-Lon treatment (n = 3; ***p < 0.001 vs. Control group; ###p < 0.001 vs. H/R group). (I) mtDNA copy number in HK2 cells treated with t-BHP and various other agents (n = 3; ***p < 0.001 vs. Control group; ##p < 0.01 vs. t-BHP group). (J) mtDNA copy number in HK2 cells under H/R with various treatments (n = 3; *p < 0.05 vs. Control group; ##p < 0.01 vs. H/R group).
Figure 5
Figure 5
Loss of TFAM was sufficient to induce mitochondrial dysfunction in HK2 cells. (A) Double-IF staining of TOM20 (red) and TFAM (green) in HK2 cells (scale bar = 10 µm). HK2 cells were transfected with normal control siRNA (NC) and TFAM siRNA (siRNA). (B) The intensity of mtROS was determined by flow cytometry. HK2 cells were treated with control siRNA or TFAM siRNA (n = 3). (C) Measurement of mitochondrial oxygen consumption ratio (OCR) in HK2 cells. (D) Basal respiration, ATP production respiration, maximal respiration, and spare respiratory capacity in HK2 cells (n = 3; *p < 0.05 vs. Control group). (E) Double-IF staining of TFAM (red) and dsDNA (green) in HK2 cells (scale bar = 10 µm). (F) Average size of mtDNA nucleoids and cytoplasmic dsDNA (dsDNA without colocalization of TFAM) in HK2 cells detected by IF staining (n = 20; ***p < 0.001 vs. Control group).
Figure 6
Figure 6
mtROS impaired mitochondrial function by suppressing TFAM in HK2 cells. (A) DCFH-DA fluorescence staining of HK2 cells (scale bar = 200 µm). (B) Quantitative analysis of intracellular ROS in HK2 cells (n = 3; *p < 0.05 vs. Control group; #p < 0.05 vs. H/R group). (C) Western blotting of TFAM protein in HK2 cells and quantitative analysis of protein expression (n = 3; *p < 0.05 vs. Control group; #p < 0.05 vs. H/R group; &P < 0.05 vs. MT group). (D) Double-IF staining of TOM20 (red) and TFAM (green) in HK2 cells and quantitative analysis of TFAM expression (scale bar = 10 µm). (E) Measurement of mitochondrial oxygen consumption ratio (OCR) in HK2 cells after various treatments. (F) Basal respiration, ATP production, maximal respiration, and spare respiratory capacity in HK2 cells (n = 3; *p < 0.05 vs. Control group; #p < 0.05 vs. t-BHP group; &P < 0.05 vs. MT group).
Figure 7
Figure 7
Loss of TFAM-induced mtDNA instability and cytokine production in HK2 cells. (A) Double-IF staining of TFAM (red) and dsDNA (green) in HK2 cells (scale bar = 10 µm). (B) Average size of mtDNA nucleoids in HK2 cells (n = 20; *p < 0.05 vs. Control group; #p < 0.05 vs. t-BHP group; &p < 0.05 vs. MT group). (C) Quantification of cytoplasmic dsDNA in HK2 cells (n = 6; ***p < 0.001 vs. Control group; ###p < 0.001 vs. t-BHP group; &&p < 0.01 vs. MT group). (D) Pearson correlation coefficient between TFAM and dsDNA in HK2 cells in different groups (*p < 0.05 vs. Control group; #p < 0.05 vs. t-BHP group; &p < 0.05 vs. MT group). (E) mtDNA copy number in HK2 cells (n = 3; *p < 0.05 vs. Control group; #p < 0.05 vs. t-BHP group; &p < 0.05 vs. MT group). (F) IF staining of dsDNA (green), Bax (white), and mitochondria (Mito; red) in HK2 cells (scale bar = 2.5 µm). (G) Western blotting of ICAM-1 and Bax proteins in HK2 cells and quantitative analysis of protein expression (n = 3; *p < 0.05 vs. Control group; #p < 0.05 vs. H/R group; &p < 0.05 vs. MT group). (H) Real-time PCR analysis of IL-1β and TNF-α mRNA levels in HK2 cells (n = 3; **p < 0.01 vs. Control group; ***p < 0.001 vs. Control group; ###p < 0.001 vs. H/R group; &p < 0.05 vs. MT group, &&&p < 0.001 vs. MT group). (I) Relative migration of RAW264.7 cells in response to conditioned medium from HK2 cells (n = 3; **p < 0.01 vs. Control group; #p < 0.05 vs. H/R group; &&p < 0.01 vs. MT group).
Figure 8
Figure 8
mtROS-induced TFAM deletion and mtDNA instability in the kidneys of IRI-AKI mice. (A) Real-time PCR analysis of TFAM mRNA levels in the kidneys of mice on day 5 after IRI-AKI (n = 6; *p < 0.05 vs. CON group; ##p < 0.01 vs. IRI-AKI group). (B) Representative micrographs showing TFAM IHC staining in the kidneys of mice on day 5 after IRI-AKI (scale bar = 50 µm) and quantitative analysis of TFAM intensity. (C) Double-IF staining of TFAM (red) and dsDNA (green) in the tubules (TL) of mice on day 5 after IRI-AKI (scale bar = 20 µm). (D) Average size of mtDNA nucleoids in the kidneys detected by IF staining (n = 15; ***p < 0.001 vs. CON group; ###p < 0.0 vs. IRI-AKI group). (E) Quantification of cytoplasmic dsDNA intensity (yellow arrows) (n = 6; **p < 0.01 vs. CON group; #p < 0.05 vs. IRI-AKI group). (F) Real-time PCR analysis of Bax mRNA levels in the kidneys of mice on day 5 after IRI-AKI (n = 6; ***p < 0.001 vs. CON group; ##p < 0.01 vs. IRI-AKI group). (G) Western blotting of TFAM, Lon, and Bax proteins in the kidneys of mice on day 5 after IRI-AKI and quantitative analysis of protein expression (n = 6; *p < 0.05 vs. CON group; ***p < 0.001 vs. CON group; ###p < 0.001 vs. IRI-AKI group).
Figure 9
Figure 9
TFAM deficiency and mtDNA instability in the kidneys of AKI patients. (A) Representative micrographs showing IF staining of NGAL (scale bar = 100 µm), TOM20 (scale bar = 20 µm), and TFAM (scale bar = 100 µm) in renal sections from AKI patients. (B) Quantitative analysis of NGAL, TOM20, and TFAM expression detected by IF staining. (n = 3; *p < 0.05 vs. Control group). (C) Double-IF staining of TFAM (red) and dsDNA (green) in the tubules (TL) of AKI patients (scale bar = 10 µm). (D) Average size of mtDNA nucleoids in the renal tubules detected by IF staining (n = 17; *p < 0.05 vs. Control group). (E) Quantification of cytoplasmic dsDNA (yellow arrows) in the tubules by IF staining (n = 6; *p < 0.05 vs. Control group).
Figure 10
Figure 10
Schematic diagram of the findings of this study. The mtROS burst after IRI-AKI reduces TFAM transcription and promotes Lon-mediated TFAM degradation in renal tubular cells (TECs), leading to decreased mitochondrial TFAM levels in these cells. The loss of TFAM triggered by mtROS also causes depletion of mtDNA and impaired mitochondrial energy metabolism as well as elevated cytosolic mtDNA release and enhanced cytokine production in TECs, thereby exacerbating renal damage after IRI-AKI.

Similar articles

Cited by

References

    1. Thadhani R, Pascual M, Bonventre JV. Acute renal failure. N Engl J Med. 1996;334:1448–60. - PubMed
    1. Funk JA, Schnellmann RG. Persistent disruption of mitochondrial homeostasis after acute kidney injury. Am J Physiol Renal Physiol. 2012;302:F853–64. - PMC - PubMed
    1. Bhargava P, Schnellmann RG. Mitochondrial energetics in the kidney. Nat Rev Nephrol. 2017;13:629–46. - PMC - PubMed
    1. Yu H, Jin F, Liu D, Shu G, Wang X, Qi J. et al. ROS-responsive nano-drug delivery system combining mitochondria-targeting ceria nanoparticles with atorvastatin for acute kidney injury. Theranostics. 2020;10:2342–57. - PMC - PubMed
    1. Li X, Liao J, Su X, Li W, Bi Z, Wang J. et al. Human urine-derived stem cells protect against renal ischemia/reperfusion injury in a rat model via exosomal miR-146a-5p which targets IRAK1. Theranostics. 2020;10:9561–78. - PMC - PubMed

Publication types

MeSH terms

LinkOut - more resources