. 2020 Dec 2;6(2):veaa074.
doi: 10.1093/ve/veaa074. eCollection 2020 Jul.

Determinants of dengue virus dispersal in the Americas

Affiliations

Determinants of dengue virus dispersal in the Americas

Orchid M Allicock et al. Virus Evol. .

Abstract

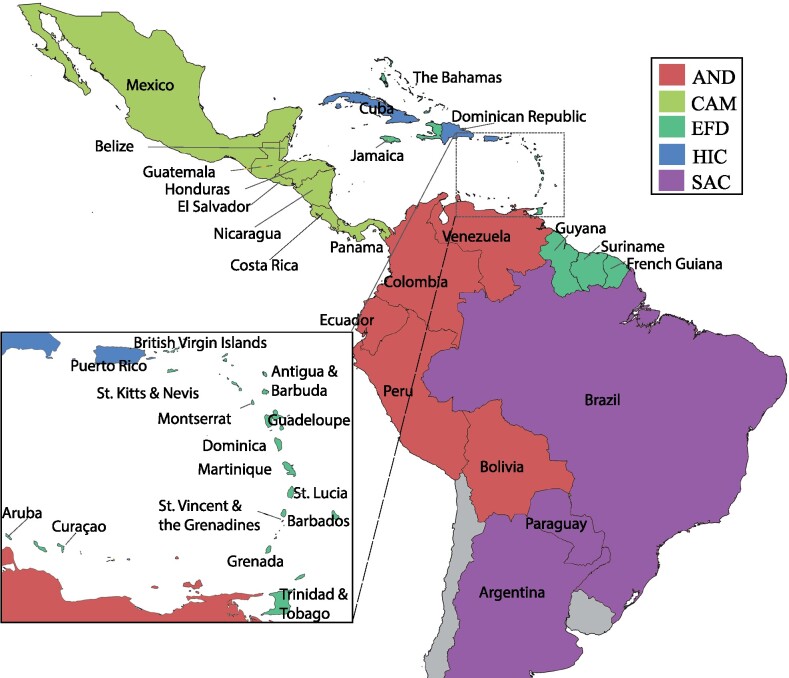
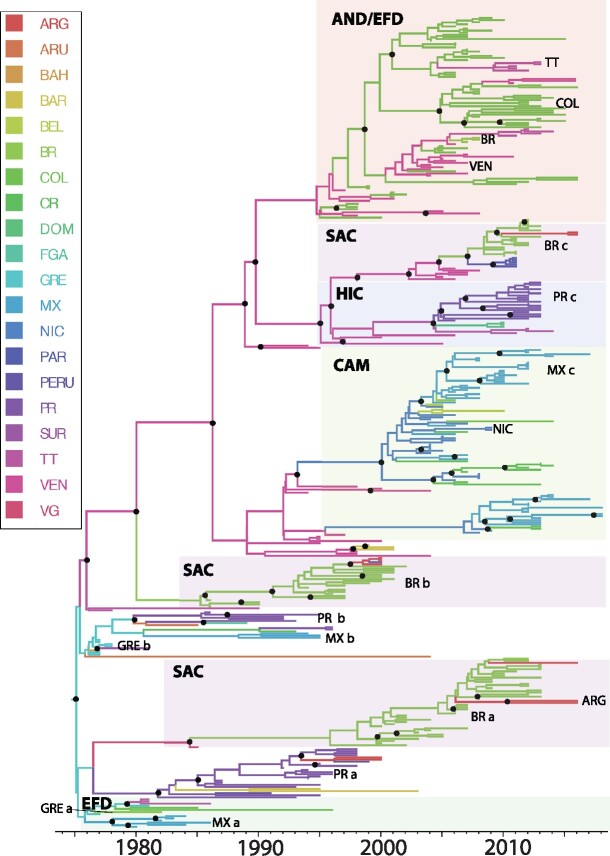
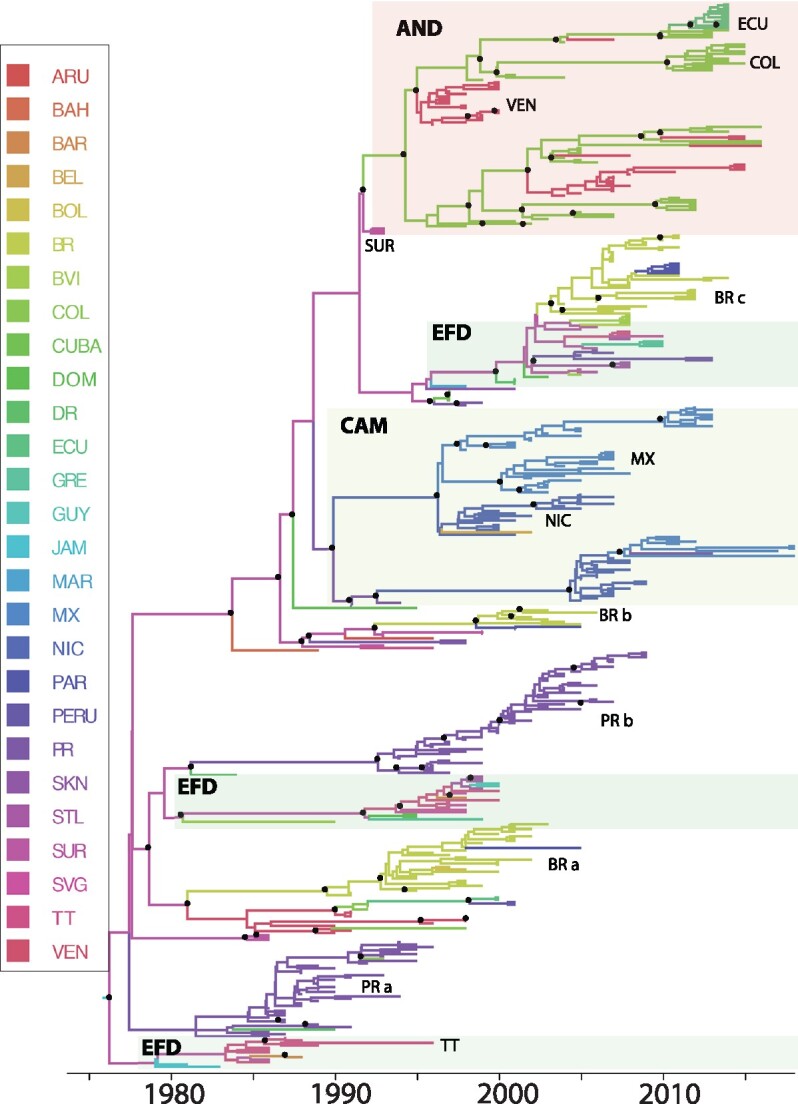
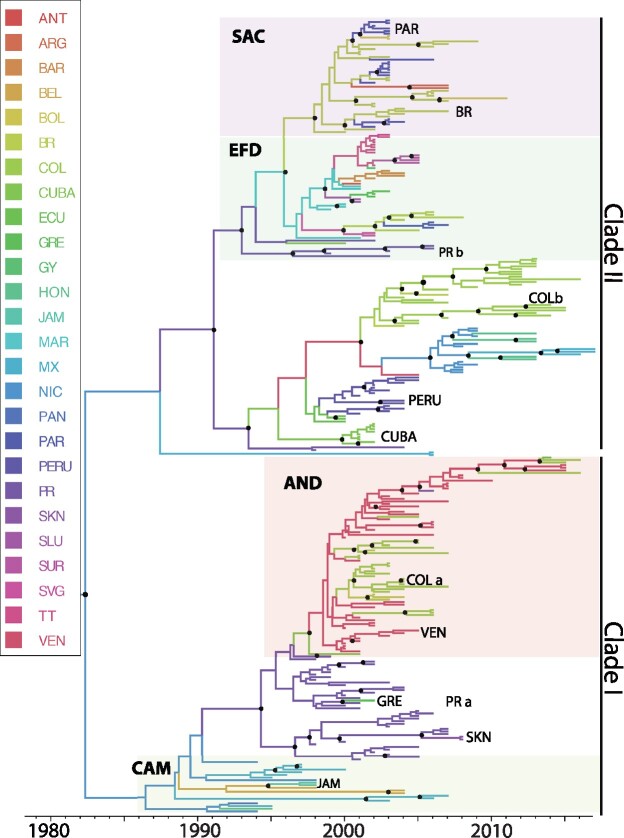
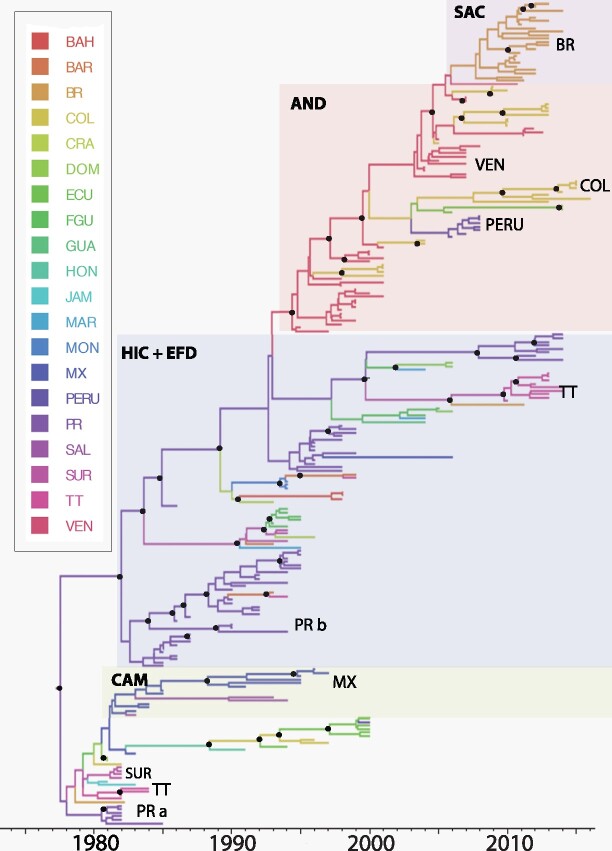
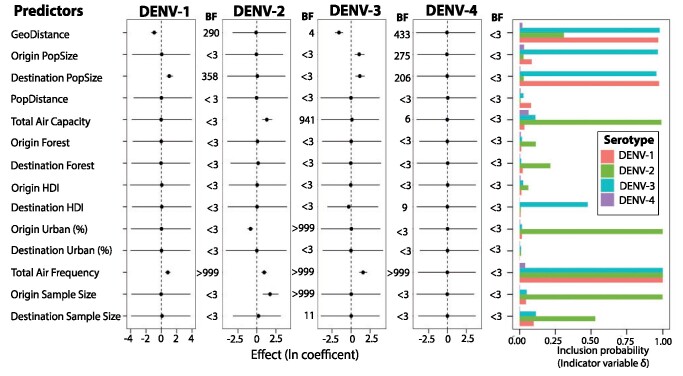
Dengue viruses (DENVs) are classified into four serotypes, each of which contains multiple genotypes. DENV genotypes introduced into the Americas over the past five decades have exhibited different rates and patterns of spatial dispersal. In order to understand factors underlying these patterns, we utilized a statistical framework that allows for the integration of ecological, socioeconomic, and air transport mobility data as predictors of viral diffusion while inferring the phylogeographic history. Predictors describing spatial diffusion based on several covariates were compared using a generalized linear model approach, where the support for each scenario and its contribution is estimated simultaneously from the data set. Although different predictors were identified for different serotypes, our analysis suggests that overall diffusion of DENV-1, -2, and -3 in the Americas was associated with airline traffic. The other significant predictors included human population size, the geographical distance between countries and between urban centers and the density of people living in urban environments.

Keywords: Bayesian phylogeography; dengue virus; hypothesis testing; spatial diffusion.


Figures

Figure 1.
Figure 1.
Map of the Americas. Location of the countries included in the study, from South America, the Caribbean, and Central America.
Figure 2.
Figure 2.
Bayesian MCC tree summarized for the DENV-1 Genotype V data set (n = 386). Terminal branches are colored according to the location of origin of the sequence at the tip, with colors as indicated in the key. Likewise, internal branches are colored according to the most probable (modal) location of their parental node inferred using a discrete phylogeographic diffusion model. Posterior clade probability percentages for nodes > 0.90 are indicated by black nodes. Location abbreviations are as follows: ANT, Antigua & Barbuda; ARG, Argentina; ARU, Aruba; BAH, Bahamas; BAR, Barbados; VG, British Virgin Islands; BEL, Belize; BOL, Bolivia; BRA, Brazil; COL, Colombia; CR, Costa Rica; DR, Dominican Republic; DOM, Dominica; ECU, Ecuador; FGA, French Guiana; GRE, Grenada; GUY, Guyana; GUA, Guadeloupe; HON, Honduras; JAM, Jamaica; MAR, Martinique; MON, Montserrat; MEX, Mexico; NIC, Nicaragua; PAR, Paraguay; PR, Puerto Rico; PAN, Panama; SAL, El Salvador; SKN, St. Kitts & Nevis; SLU, St. Lucia; SVG, St. Vincent & the Grenadines; SUR, Suriname; TT, Trinidad & Tobago; VEN, Venezuela.
Figure 3.
Figure 3.
Bayesian MCC tree summarized for the DENV-2 Genotype IIIb data set (n = 452). Terminal branches are colored according to the location of origin of the sequence at the tip, with colors as indicated in the key. Likewise, internal branches are colored according to the most probable (modal) location of their parental node inferred using a discrete phylogeographic diffusion model. Posterior clade probability percentages for nodes > 0.90 are indicated by black nodes. Location abbreviations are as follows: ANT, Antigua & Barbuda; ARG, Argentina; ARU, Aruba; BAH, Bahamas; BAR, Barbados; BVI, British Virgin Islands; BEL, Belize; BOL, Bolivia; BRA, Brazil; COL, Colombia; CR, Costa Rica; DR, Dominican Republic; DOM, Dominica; ECU, Ecuador; FGA, French Guiana; GRE, Grenada; GUY, Guyana; GUA, Guadeloupe; HON, Honduras; JAM- Jamaica; MAR, Martinique; MON, Montserrat; MEX, Mexico; NIC, Nicaragua; PAR, Paraguay; PR, Puerto Rico; PAN, Panama; SAL, El Salvador; SKN, St. Kitts & Nevis; SLU, St. Lucia; SVG, St. Vincent & the Grenadines; SUR, Suriname; TT, Trinidad & Tobago; VEN, Venezuela.
Figure 4.
Figure 4.
Bayesian MCC tree summarized for the DENV-3 Genotype III data set (n = 307). Terminal branches are colored according to the location of origin of the sequence at the tip, with colors as indicated in the key. Likewise, internal branches are colored according to the most probable (modal) location of their parental node inferred using a discrete phylogeographic diffusion model. Posterior clade probability percentages for nodes >0.90 are indicated by black nodes. Location abbreviations are as follows: ANT, Antigua & Barbuda; ARG, Argentina; ARU, Aruba; BAH, Bahamas; BAR, Barbados; BVI, British Virgin Islands; BEL, Belize; BOL, Bolivia; BRA, Brazil; COL, Colombia; CR, Costa Rica; DR, Dominican Republic; DOM, Dominica; ECU, Ecuador; FGA, French Guiana; GRE, Grenada; GUY, Guyana; GUA, Guadeloupe; HON, Honduras; JAM, Jamaica; MAR, Martinique; MON, Montserrat; MEX, Mexico; NIC, Nicaragua; PAR, Paraguay; PR, Puerto Rico; PAN, Panama; SAL, El Salvador; SKN, St. Kitts & Nevis; SLU, St. Lucia; SVG, St. Vincent & the Grenadines; SUR, Suriname; TT, Trinidad & Tobago; VEN, Venezuela.
Figure 5.
Figure 5.
Bayesian MCC tree summarized for DENV-4 Genotype II data set (n = 236). Terminal branches are colored according to the location of origin of the sequence at the tip, with colors as indicated in the key. Likewise, internal branches are colored according to the most probable (modal) location of their parental node inferred using a discrete phylogeographic diffusion model. Posterior clade probability percentages for nodes > 0.90 are indicated by black nodes. Location abbreviations are as follows: ANT, Antigua & Barbuda; ARG, Argentina; ARU, Aruba; BAH, Bahamas; BAR, Barbados; BVI, British Virgin Islands; BEL, Belize; BOL, Bolivia; BRA, Brazil; COL, Colombia; CR, Costa Rica; DR, Dominican Republic; DOM, Dominica; ECU, Ecuador; FGA, French Guiana; GRE, Grenada; GUY, Guyana; GUA, Guadeloupe; HON, Honduras; JAM, Jamaica; MAR, Martinique; MON, Montserrat; MEX, Mexico; NIC, Nicaragua; PAR, Paraguay; PR, Puerto Rico; PAN, Panama; SAL, El Salvador; SKN, St. Kitts & Nevis; SLU, St. Lucia; SVG, St. Vincent & the Grenadines; SUR, Suriname; TT, Trinidad & Tobago; VEN, Venezuela.
Figure 6.
Figure 6.
Predictors of DENV-1 to -4 diffusion. The contribution of each predictor (i.e. the conditional effect size) when included in the model (β|δ  =  1), is represented by the mean and credible intervals of the GLM coefficients on a log scale. Inclusion probabilities are represented as BFs (BF > 3 = positive, >20 = strong, >150 very strong). Posterior mean and 95% Bayesian credible interval are represented as a black dot and line respectively. Another probability measure of inclusion or exclusion of the predictor is represented by indicator variable δ (rightmost panel).

References

    1. Allicock O. M et al. . (2012) ‘Phylogeography and Population Dynamics of Dengue Viruses in the Americas’, Molecular Biology and Evolution, 29: 1533–43. - PMC - PubMed
    1. Aquino V. H. et al. (2009) ‘New Genotype of Dengue Type 3 Virus Circulating in Brazil and Colombia Showed a Close Relationship to Old Asian Viruses’, PLoS One, 4: e7299. - PMC - PubMed
    1. Baele G., Lemey P., Vansteelandt S. (2013) ‘Make the Most of Your Samples: Bayes Factor Estimators for High-Dimensional Models of Sequence Evolution’, BMC Bioinformatics, 14: 85. - PMC - PubMed
    1. Bennett S. N. (2006) ‘Molecular Evolution of Dengue 2 Virus in Puerto Rico: positive Selection in the Viral Envelope Accompanies Clade Reintroduction’, Journal of General Virology, 87: 885–93. - PubMed
    1. Bennett S. N et al. . (2010) ‘Epidemic Dynamics Revealed in Dengue Evolution’, Molecular Biology and Evolution, 27: 811–8. - PMC - PubMed