. 2020 Nov 4;11(12):6881-6904.
doi: 10.1364/BOE.404738. eCollection 2020 Dec 1.

Generating large field of view en-face projection images from intra-acquisition motion compensated volumetric optical coherence tomography data

Affiliations

Generating large field of view en-face projection images from intra-acquisition motion compensated volumetric optical coherence tomography data

Florian Schwarzhans et al. Biomed Opt Express. .

Abstract

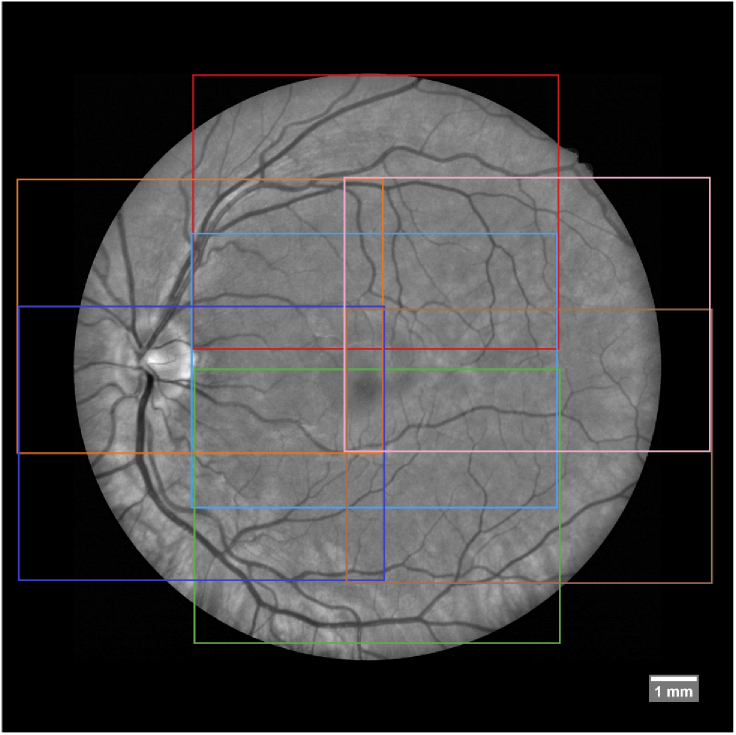
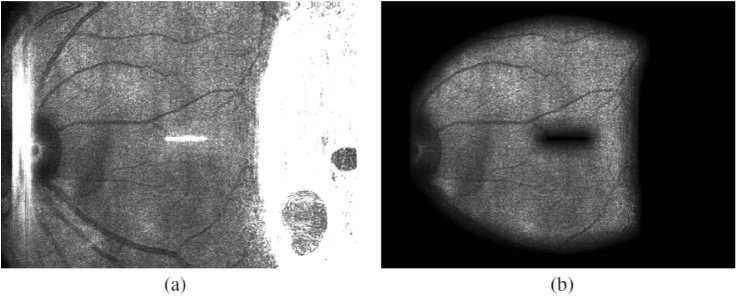
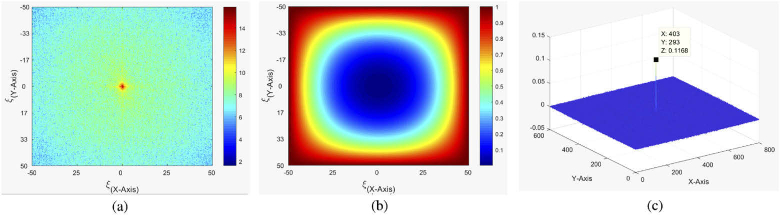
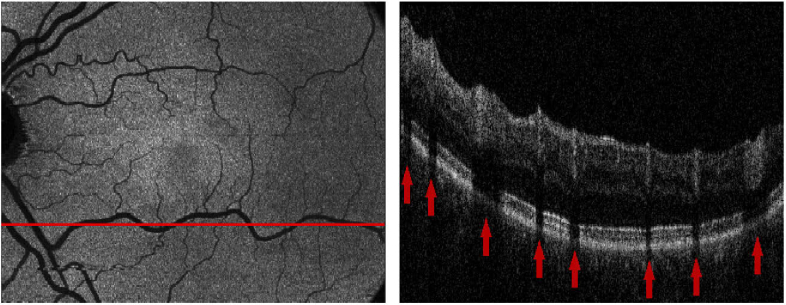
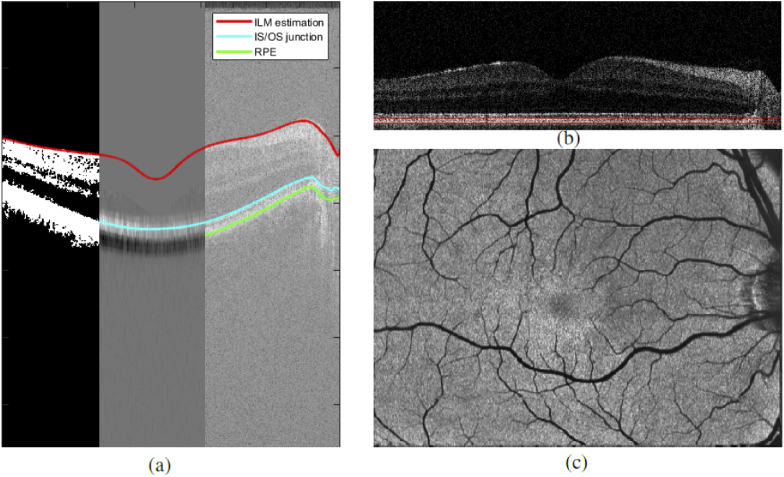
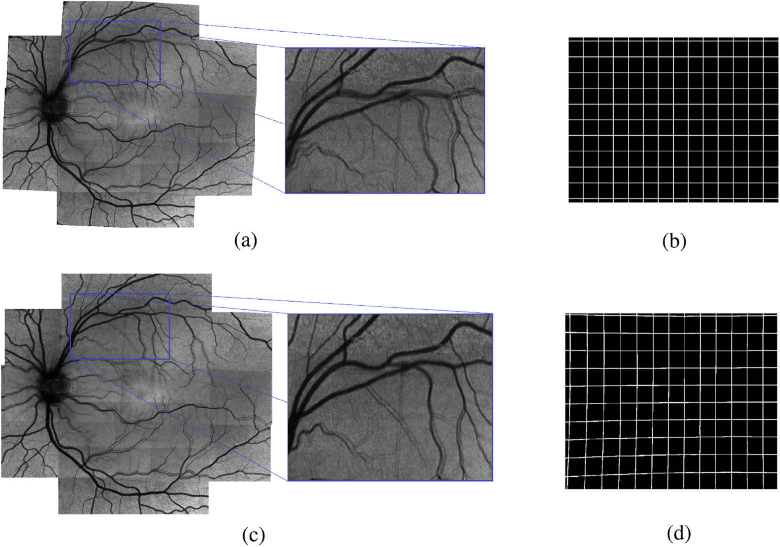
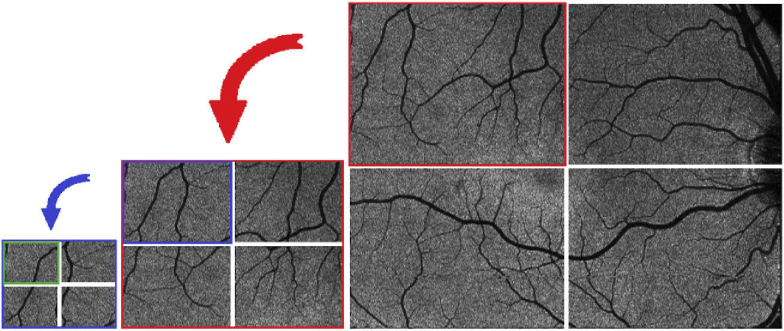
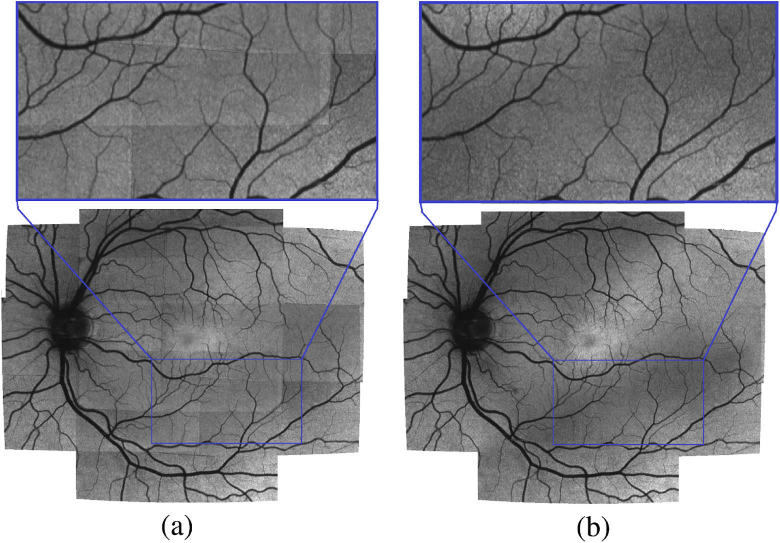
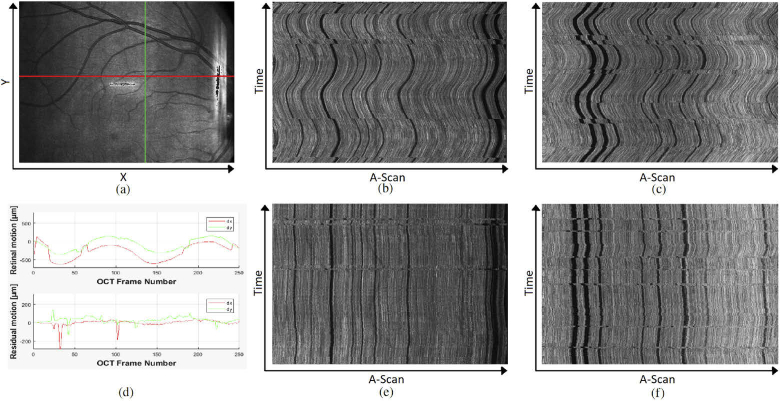
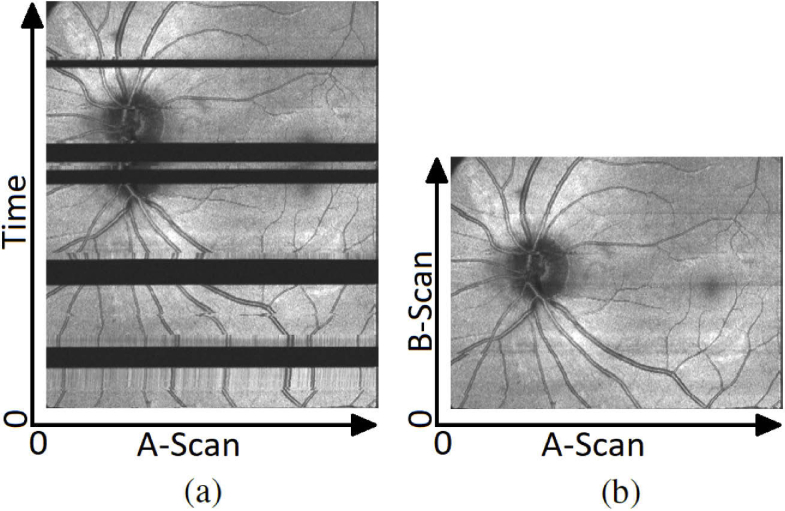
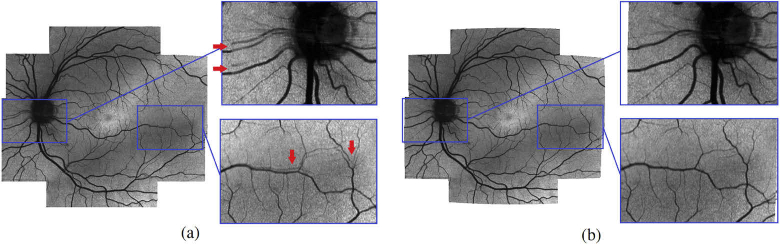
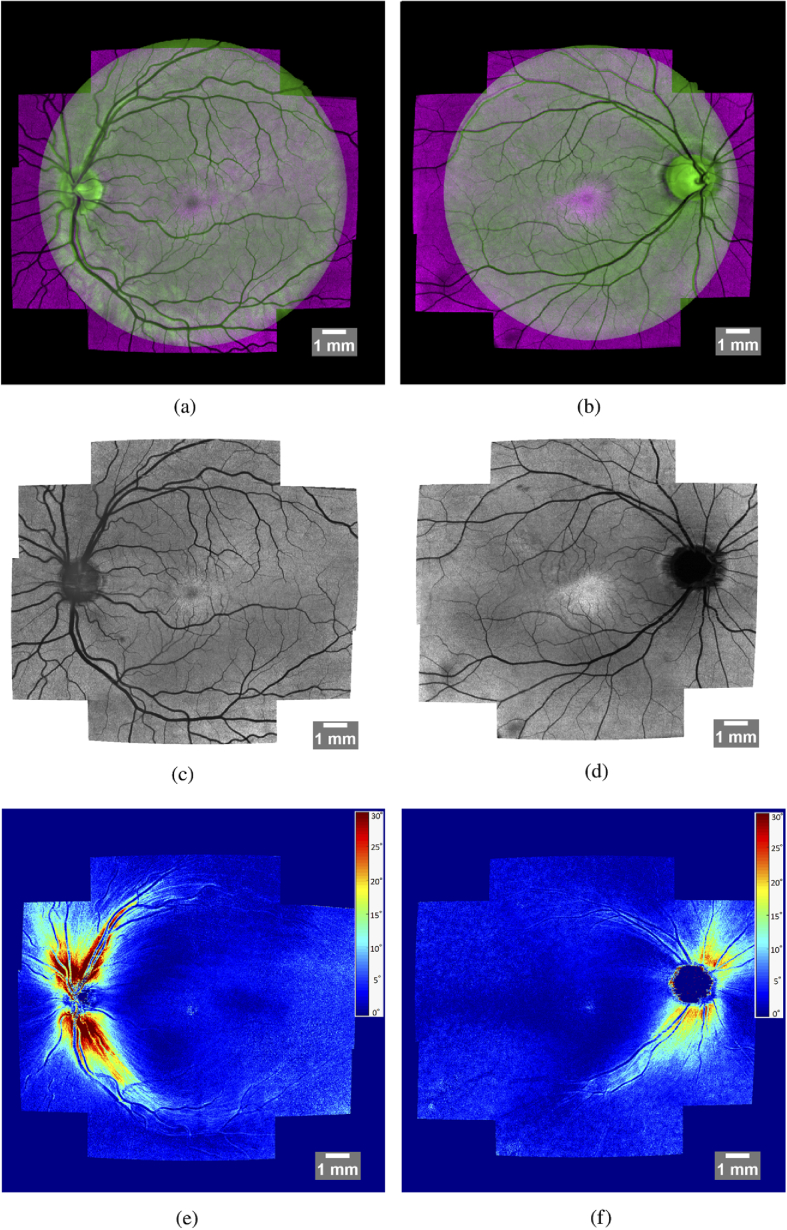
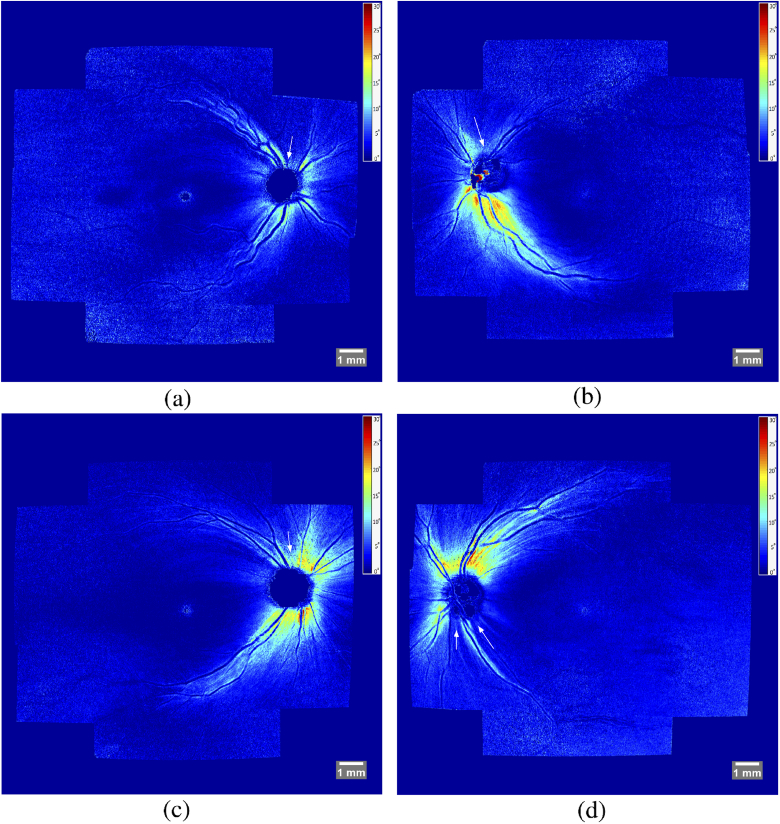
A technique to generate large field of view projection maps of arbitrary optical coherence tomography (OCT) data is described. The technique is divided into two stages - an image acquisition stage that features a simple to use fast and robust retinal tracker to get motion free retinal OCT volume scans - and a stitching stage where OCT data from different retinal locations is first registered against a reference image using a custom pyramid-based approach and finally stitched together into one seamless large field of view (FOV) image. The method is applied to data recorded with a polarization sensitive OCT instrument in healthy subjects and glaucoma patients. The tracking and stitching accuracies are quantified, and finally, large FOV images of retinal nerve fiber layer retardation that contain the arcuate nerve fiber bundles from the optic nerve head to the raphe are demonstrated.


Conflict of interest statement

The authors declare no conflicts of interest.

Figures

Fig. 1.
Fig. 1.
The 7 retinal positions (indicated by the colored rectangles) that have been imaged with PS-OCT to cover a large FOV overlaid to the green channel of a fundus photo.
Fig. 2.
Fig. 2.
SLO image showing various reflection artefacts (a) and after all artefacts are masked out (b).
Fig. 3.
Fig. 3.
Magnitude of the Fourier transformed SLO frame. Colorbar displays log of the magnitude and spatial frequency is given in cycles per mm (a). High-pass filter indicating multiplication factor for each frequency - this is directly multiplied with the Fourier transformed reference image (b). Phase correlation peak between reference image and another SLO frame. The offset from the center point (coordinates indicated in X: and Y:) denotes the observed translation (in Pixel) between the scans. The peak can be clearly distinguished from the background noise (c).
Fig. 4.
Fig. 4.
Left: Intensity projection image over the RPE band. Right: Cropped OCT B-Scan at position indicated left. Red arrows mark the location of shadows caused by retinal vessels.
Fig. 5.
Fig. 5.
Path to high contrast intensity projection images. (a) shows the intermediate segmentation steps. left: ILM estimation via thresholding; middle: IS/OS detection via local gradient; right RPE detection via DOPU image. (b) shows the B-Scan flattened at the RPEwith the 30 μm thick band for intensity projection image generation drawn in red. (c) shows the final averaged intensity projection image of a scanning region.
Fig. 6.
Fig. 6.
Left Column: Stitching considering rotation and translation of the intensity projection images without (a) and with optical distortion compensation (c); Right Column: Regular Grid (b), effect of optical distortion compensation shown on b (d).
Fig. 7.
Fig. 7.
Cut of the OCT projection image into 4 quadrants shown for one branch of 3 level recursion.
Fig. 8.
Fig. 8.
Stitched large field intensity projection (bottom) with zoomed in region (top). The standard averaging approach leaves visible seams at the edges of the individual images used (a) while the adaptive weighted method does not show such seams (b).
Fig. 9.
Fig. 9.
SLO image indicating the scanline of the repeated horizontal (red) and vertical (green) B-Scan (a); En-face projection (over RPE) of horizontal and vertical repeated B-Scan without tracking (b and c respectively) and with tracking (e and f respectively); Graph displaying the retinal motion of the uncompensated projections (d top) and the residual motion when using the retinal tracker (d bottom).
Fig. 10.
Fig. 10.
Projection of the volume scan with tracking and blinking compensation turned on. (a) Data set without removal of blinks and poor tracking, (b) Stored data set with automatically discarded artefacts and re-scanned locations. Some small residual artefacts can still be detected - especially the thick vessel near bottom left - this will be further analyzed in section 4
Fig. 11.
Fig. 11.
Stitched image of a healthy subject without (a) and with pyramid partitioning (b). Zoomed in regions on the right show the effect of using pyramid partitioning on some retinal vessels. Red arrows indicate areas where vessels can be clearly seen multiple times
Fig. 12.
Fig. 12.
Stitched images of a healthy (left column) and an early glaucoma subject (right column). Overlay of stitched intensity projection image and fundus image (a,b), stitched projection of Intensity (c,d), stitched retardation projection (colorscale in degreeof retardation and windowed between 0 and 30) (e,f).
Fig. 13.
Fig. 13.
Stitched retardation projection images (colorscale in degree of retardation and windowed between 0 and 30) of 4 glaucoma subjects. Bundle defects are indicated with white arrows. Retinal areas associated to these bundle defects will have deficits or even losses in visual perception.

Similar articles

Cited by

References

    1. Adhi M., Duker J. S., “Optical coherence tomography–current and future applications,” Curr. Opinion Ophthalmology 24(3), 213–221 (2013).10.1097/ICU.0b013e32835f8bf8 - DOI - PMC - PubMed
    1. Kardon R., “The role of the macula OCT scan in neuro-ophthalmology,” J. Neuro-Ophthalmol. 31(4), 353–361 (2011).10.1097/WNO.0b013e318238b9cb - DOI - PMC - PubMed
    1. Bussel I. I., Wollstein G., Schuman J. S., “OCT for glaucoma diagnosis, screening and detection of glaucoma progression,” Br. J. Ophthalmol. 98(Suppl 2), ii15–ii19 (2014).10.1136/bjophthalmol-2013-304326 - DOI - PMC - PubMed
    1. Neubauer A. S., Kernt M., Haritoglou C., Priglinger S. G., Kampik A., Ulbig M. W., “Nonmydriatic screening for diabetic retinopathy by ultra-widefield scanning laser ophthalmoscopy (optomap),” Graefe’s Arch. Clin. Exp. Ophthalmol. 246(2), 229–235 (2008).10.1007/s00417-007-0631-4 - DOI - PubMed
    1. Nagiel A., Lalane R. A., Sadda S. R., Schwartz S. D., “Ultra-widefield fundus imaging: a review of clinical applications and future trends,” Retina 36(4), 660–678 (2016).10.1097/IAE.0000000000000937 - DOI - PubMed

LinkOut - more resources