. 2020 Nov 6;11(12):6945-6961.
doi: 10.1364/BOE.403209. eCollection 2020 Dec 1.

Quantitative multi-contrast in vivo mouse imaging with polarization diversity optical coherence tomography and angiography

Affiliations

Quantitative multi-contrast in vivo mouse imaging with polarization diversity optical coherence tomography and angiography

Destiny Hsu et al. Biomed Opt Express. .

Abstract

Retinal microvasculature and the retinal pigment epithelium (RPE) play vital roles in maintaining the health and metabolic activity of the eye. Visualization of these retina structures is essential for pre-clinical studies of vision-robbing diseases, such as age-related macular degeneration (AMD). We have developed a quantitative multi-contrast polarization diversity OCT and angiography (QMC-PD-OCTA) system for imaging and visualizing pigment in the RPE using degree of polarization uniformity (DOPU), along with flow in the retinal capillaries using OCT angiography (OCTA). An adaptive DOPU averaging kernel was developed to increase quantifiable values from visual data, and QMC en face images permit simultaneous visualization of vessel location, depth, melanin region thickness, and mean DOPU values, allowing rapid identification and differentiation of disease symptoms. The retina of five different mice strains were measured in vivo, with results demonstrating potential for pre-clinical studies of retinal disorders.


Conflict of interest statement

MVS: Seymour Vision (I). SM, YY: Yokogawa Electric Corp. (F), Nikon (F), Kao Corp. (F), Topcon (F), Tomey Corp (F, P), Sky Technology (F).

Figures

Fig. 1.
Fig. 1.
Schematic of the QMC-PD-OCTA system. Polarization Controller (PC); Collimator (CL); Lens (L); Mirror (M); Dispersion Compensation Block (DCB); Galvanometer Scanner (GS); Variable Focus Lens (VFL); Linear Polarizer (LP); Beam Splitter (BS); Polarizing Beam Splitter (PBS); Balanced Photodetector (BPD); L1 = 2 × 200 mm, L2 = 2 × 125 mm.
Fig. 2.
Fig. 2.
Flowchart of QMC image processing pipeline. (a) Raw volumetric data from orthogonally polarized outputs, H- and V-channels. (b) DOPU en face image processing; generation of Stokes vectors, adaptive DOPU kernel averaging, noise-corrected DOPU, and melanin maps for mean DOPU value and melanin region thickness. (c) OCTA en face image processing; coherent composition of polarization channels, scattering intensity averaged OCT and OCTA, and OCTA en face maximum intensity projection image with corresponding depth indices relative to the RPE. Scalebars indicate 100 µm.
Fig. 3.
Fig. 3.
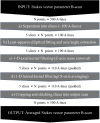
Flowchart of adaptive DOPU averaging kernel process, taken for a data volume of N cropped axial points and 500 lateral A-lines.
Fig. 4.
Fig. 4.
QMC full en face image generation, contrast illustration. (a) Melanin region en face map of mean DOPU value with thickness map. (b) OCTA en face map of vessel location and depth with respect to the RPE. (c) Full QMC en face image displaying four contrasts simultaneously. Scalebars indicate 100 µm.
Fig. 5.
Fig. 5.
Composite B-scans (top) and QMC en face images (bottom) of three rodent strains with differing melanin concentrations; (a)WT mouse; (b) Agouti mouse; (c) Albino mouse. Scalebars indicate 100 µm.
Fig. 6.
Fig. 6.
Histogram of melanin region thickness distributions for all imaged mice, categorized by strain (WT, Agouti, Albino). Zero thickness values for albino mice have been neglected for ease of inter-strain display and comparison.
Fig. 7.
Fig. 7.
Composite B-scans (top) and QMC en face images (bottom) of three different pathological case rodent strains; (a) WT mouse; (b) RPE 65 mouse; (c) VLDLR mouse. Scalebars indicate 100 µm.
Fig. 8.
Fig. 8.
Circumpapillary plot of three pathological rodent strains (WT, RPE65, VLDLR). (a) OCT en face view indicating the location of the averaged cross-sectional area. T, temporal; N, nasal; S, superior; I, inferior. (b) Composite DOPU circumpapillary B-scans of WT (top), RPE65 (center) and VLDLR (bottom), sampling depths for ONL and melanin region thicknesses indicated by white and black arrows, respectively. (c) ONL thickness plot. (d) Melanin region thickness plot. Scalebars indicate 100 µm.
Fig. 9.
Fig. 9.
Comparison of processed DOPU with adaptive and rigid kernel methods. (a) Stokes vector parameters for a single B-scan. DOPU B-scan processing (measured DOPU, filtering and averaging, composite DOPU B-scan) with (b) rigid and (c) adaptive kernels. (d) Melanin map projections computed with rigid and adaptive kernels. Scalebars indicate 100 µm.
Fig. 10.
Fig. 10.
Comparison of rigid and adaptive DOPU averaging kernels on pathological data. (a) QMC en face image of a VLDLR rodent eye, B-scan selected at dotted line with retinal lesion circled in white. (b) DOPU (left) and composite DOPU B-scans (right) showing a VLDLR retinal lesion, processed with rigid (top) and adaptive (bottom) kernels. Arrows indicate features sharpened with the adaptive kernel. Scalebars indicate 100 µm.

Similar articles

Cited by

References

    1. Petersen-Jones S. M., “Animal models of human retinal dystrophies,” Eye 12(3), 566–570 (1998). 10.1038/eye.1998.146 - DOI - PubMed
    1. Chader G. J., “Animal models in research on retinal degenerations: Past progress and future hope,” Vision Res. 42(4), 393–399 (2002). 10.1016/S0042-6989(01)00212-7 - DOI - PubMed
    1. Huber G., Beck S. C., Grimm C., Sahaboglu-Tekgoz A., Paquet-Durand F., Wenzel A., Humphries P., Michael Redmond T., Seeliger M. W., Dominik Fischer M., “Spectral domain optical coherence tomography in mouse models of retinal degeneration,” Invest. Ophthalmol. Visual Sci. 50(12), 5888–5895 (2009). 10.1167/iovs.09-3724 - DOI - PMC - PubMed
    1. Wahl D. J., Jian Y., Bonora S., Zawadzki R. J., Sarunic M. V., “Wavefront sensorless adaptive optics fluorescence biomicroscope for in vivo retinal imaging in mice,” Opt. Express 7(1), 1 (2016). 10.1364/BOE.7.000001 - DOI - PMC - PubMed
    1. Zhang P., Zam A., Jian Y., Wang X., Li Y., Lam K. S., Burns M. E., Sarunic M. V., Pugh E. N., Zawadzki R. J., “In vivo wide-field multispectral scanning laser ophthalmoscopy–optical coherence tomography mouse retinal imager: longitudinal imaging of ganglion cells, microglia, and Müller glia, and mapping of the mouse retinal and choroidal vasculature,” J. Biomed. Opt. 20(12), 126005 (2015). 10.1117/1.JBO.20.12.126005 - DOI - PMC - PubMed

LinkOut - more resources