

Quantifying Subclinical and Longitudinal Microvascular Changes Following Episcleral Plaque Brachytherapy Using Spectral Domain-Optical Coherence Tomography Angiography
- PMID: 33409441
- PMCID: PMC7785061
- DOI: 10.1177/2474126420936199
Quantifying Subclinical and Longitudinal Microvascular Changes Following Episcleral Plaque Brachytherapy Using Spectral Domain-Optical Coherence Tomography Angiography
Abstract
Purpose: To assess longitudinal microvascular changes in eyes treated with I-125 episcleral plaque brachytherapy (EPB).
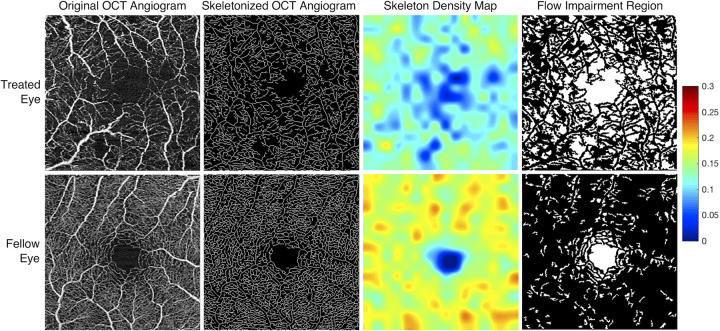
Methods: High resolution OCT angiograms of the central 3×3mm macula were obtained from I-125 episcleral plaque brachytherapy treated and untreated fellow eyes of 61 patients. Capillary density (vessel skeleton density, VSD) and caliber (vessel diameter index, VDI) were quantified using previously validated semi-automated algorithms. Nonperfusion was also quantified as flow impairment regions (FIR). Exams from treated and fellow eyes obtained pre-treatment and at 6-month, 1-year, and 2-year intervals were compared using generalized estimating equation linear models. Dosimetry maps were used to evaluate spatial correlation between radiation dose and microvascular metrics.
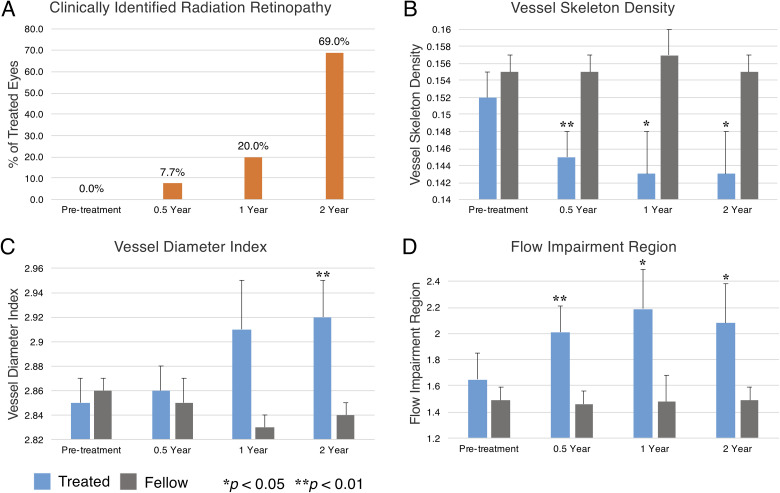
Results: At 6 months, treated eyes had significantly lower VSD (0.145 ± 0.003 vs 0.155 ± 0.002; p = 0.009) and higher FIR (2.01 ± 0.199 vs 1.46 ± 0.104; p = 0.010) compared to fellow eyes. There was a significant decrease in VSD and a corresponding increase in FIR even for treated eyes without clinically identifiable retinopathy at 6 months. VDI was significantly higher in treated eyes than in fellow eyes at 2 years (2.92 ± 0.025 vs 2.84 ± 0.018; p < 0.001). When our cohort was categorized into low dose radiation (<15Gy) and high dose radiation (>45Gy) to the fovea, there were significant differences in VSD and FIR between groups.
Conclusions: OCTA can be used to quantify and monitor EPB induced retinopathy, and can detect vascular abnormalities even in the absence of clinically observable retinopathy. OCTA may therefore be useful in investigating treatment interventions that aim to delay EPB-induced radiation retinopathy.
Keywords: Biomarker; Capillary; Choroidal Melanoma; Episcleral Plaque Brachytherapy; Optical Coherence Tomography Angiography; Radiation Retinopathy.
Conflict of interest statement
The author(s) declared the following potential conflicts of interest with respect to the research, authorship, and/or publication of this article: A.H.K. and R.K.W. have received grant support and honoraria from Carl Zeiss Meditec. M.A.A. has controlling interest in Eye Physics LLC. The other authors have nothing to declare.
Figures
References
-
- Collaborative Ocular Melanoma Study Group. The COMS randomized trial of iodine 125 brachytherapy for choroidal melanoma: V. Twelve-year mortality rates and prognostic factors: COMS report No. 28. Arch Ophthalmol. 2006;124(12):1684–1693. doi:10.1001/archopht.124.12.1684 - PubMed
-
- Melia BM, Abramson DH, Albert DM, et al. ; Collaborative Ocular Melanoma Study Group. Collaborative ocular melanoma study (COMS) randomized trial of I-125 brachytherapy for medium choroidal melanoma. I. Visual acuity after 3 years COMS report No. 16. Ophthalmology. 2001;108(2):348–366. doi:10.1016/s0161-6420(00)00526-1 - PubMed
-
- Berry JL, Dandapani SV, Stevanovic M, et al. Outcomes of choroidal melanomas treated with Eye Physics: a 20-year review. JAMA Ophthalmol. 2013;131(11):1435–1442. doi:10.1001/jamaophthalmol.2013.4422 - PubMed
-
- Durkin SR, Roos D, Higgs B, Casson RJ, Selva D. Ophthalmic and adnexal complications of radiotherapy. Acta Ophthalmol Scand. 2007;85(3):240–250. doi:10.1111/j.1600-0420.2006.00822.x - PubMed
Grants and funding
LinkOut - more resources
Full Text Sources
