. 2020 May;1(5):493-506.
doi: 10.1038/s43018-020-0053-3. Epub 2020 Apr 27.

Single-cell RNA sequencing reveals compromised immune microenvironment in precursor stages of multiple myeloma

Affiliations

Single-cell RNA sequencing reveals compromised immune microenvironment in precursor stages of multiple myeloma

Oksana Zavidij et al. Nat Cancer. 2020 May.

Abstract

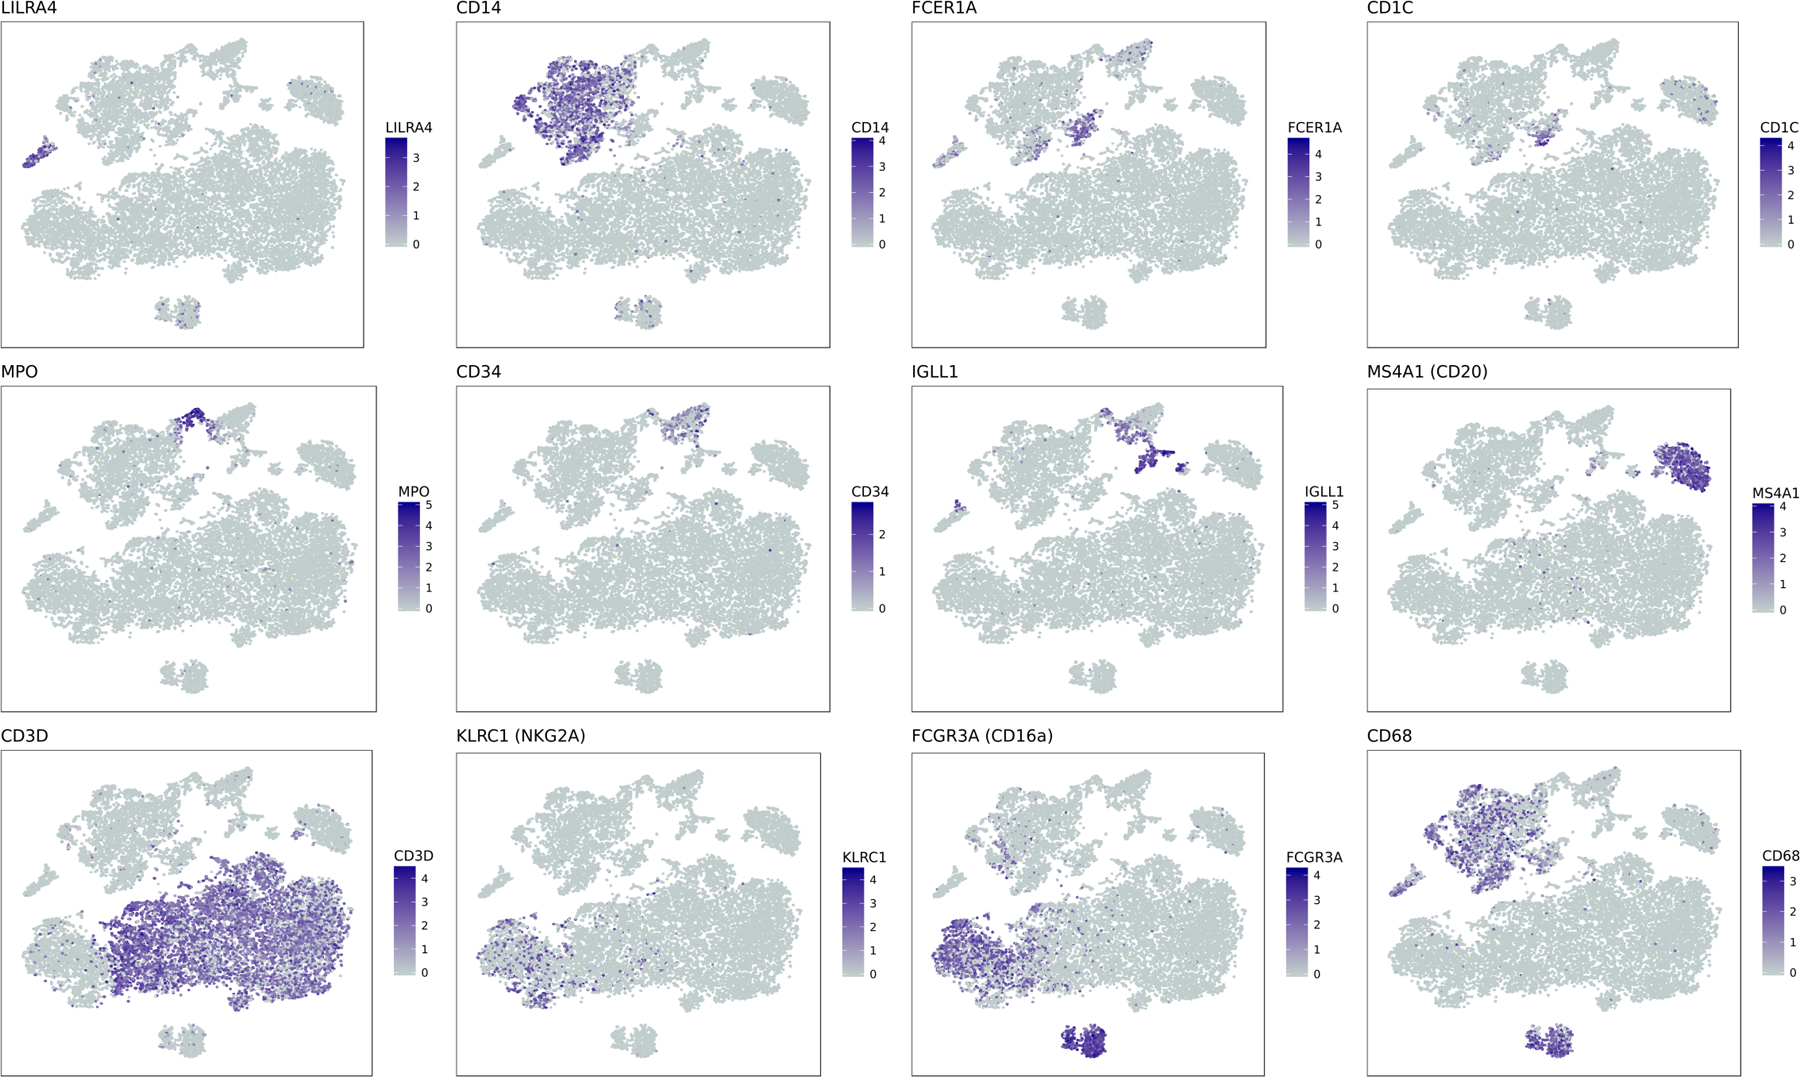
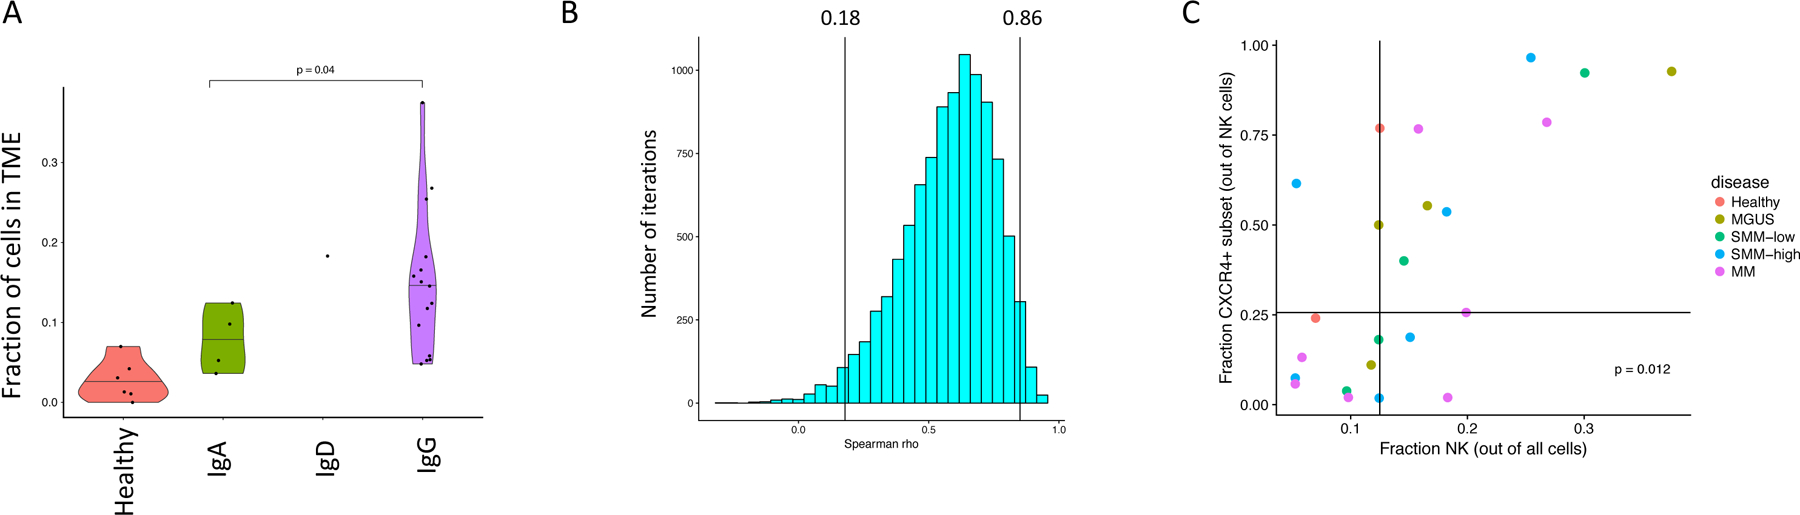
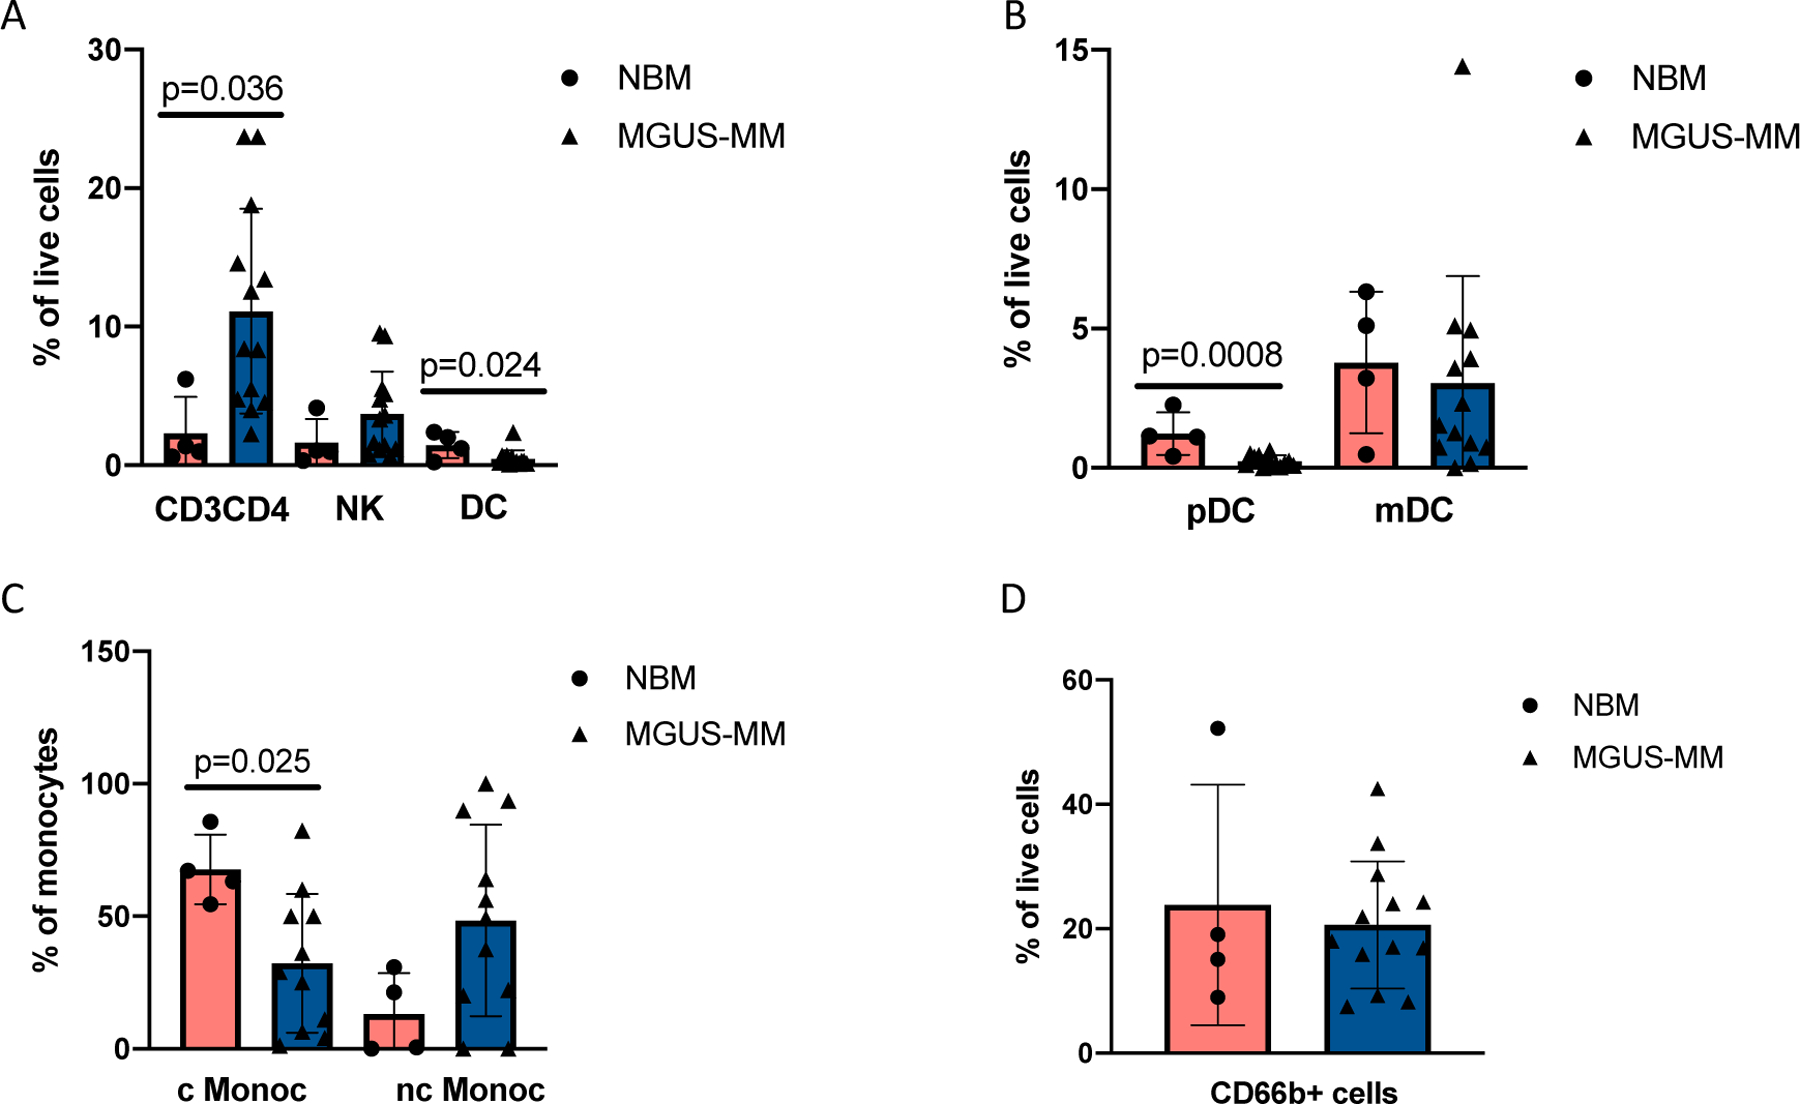
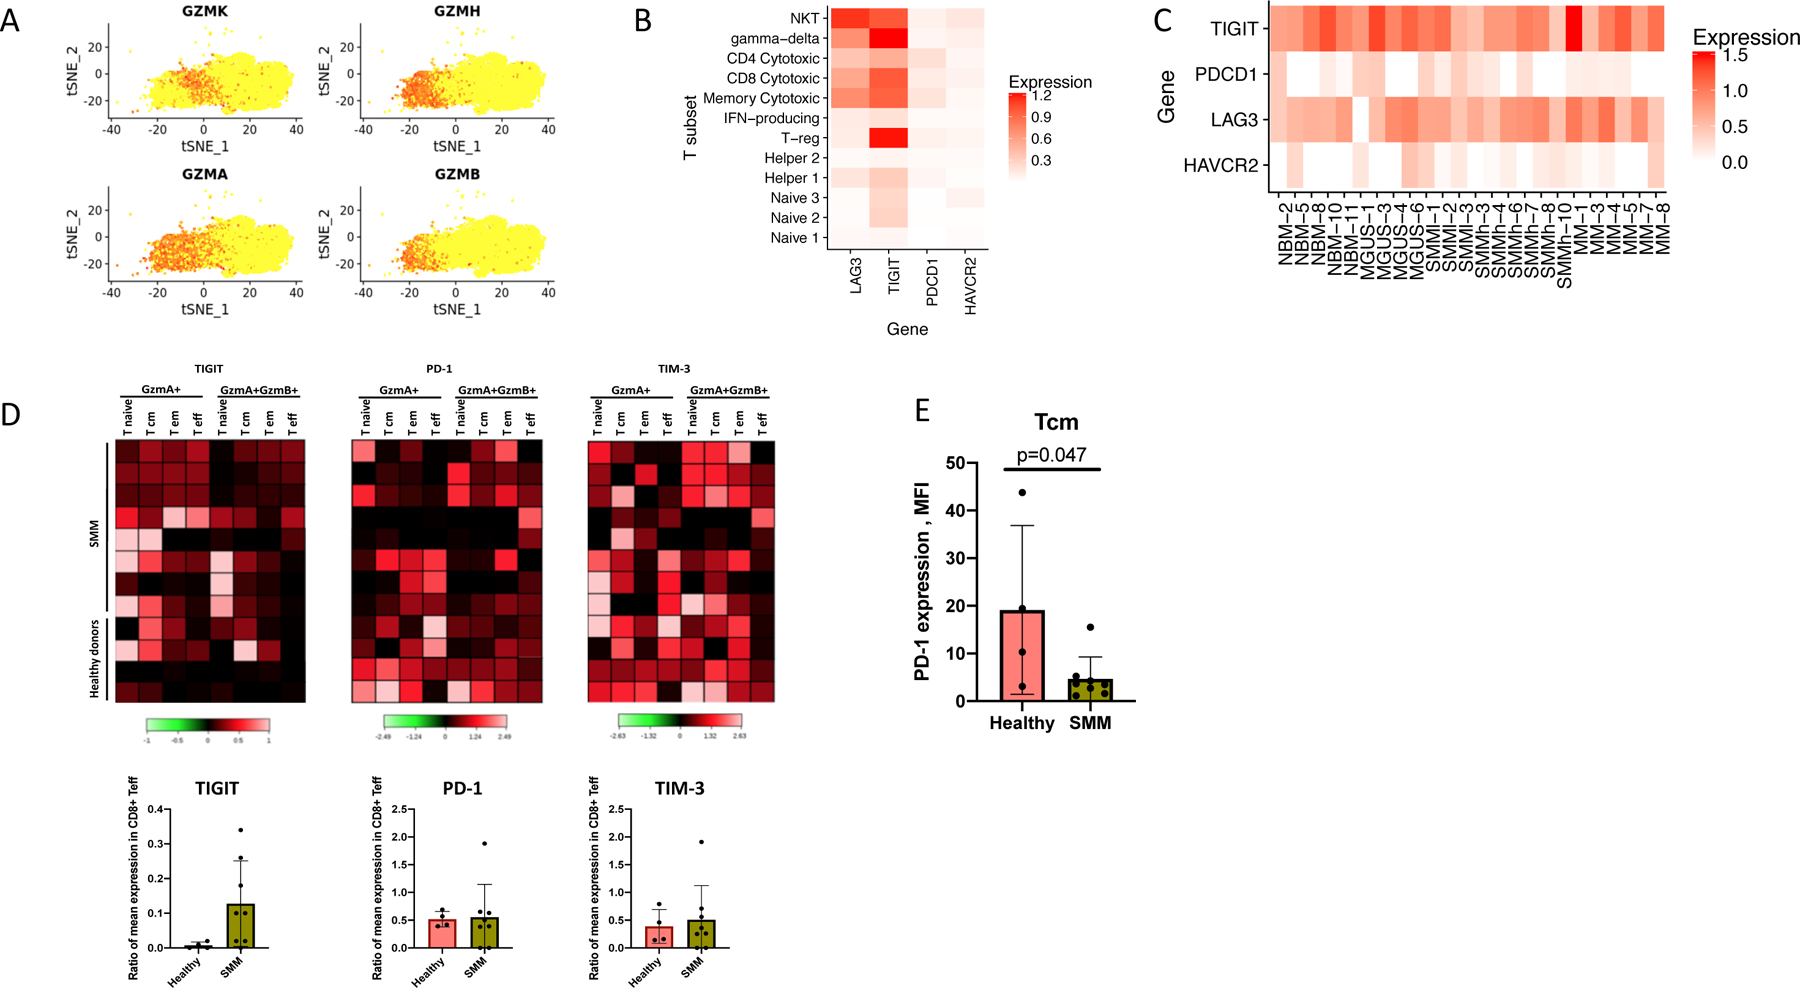
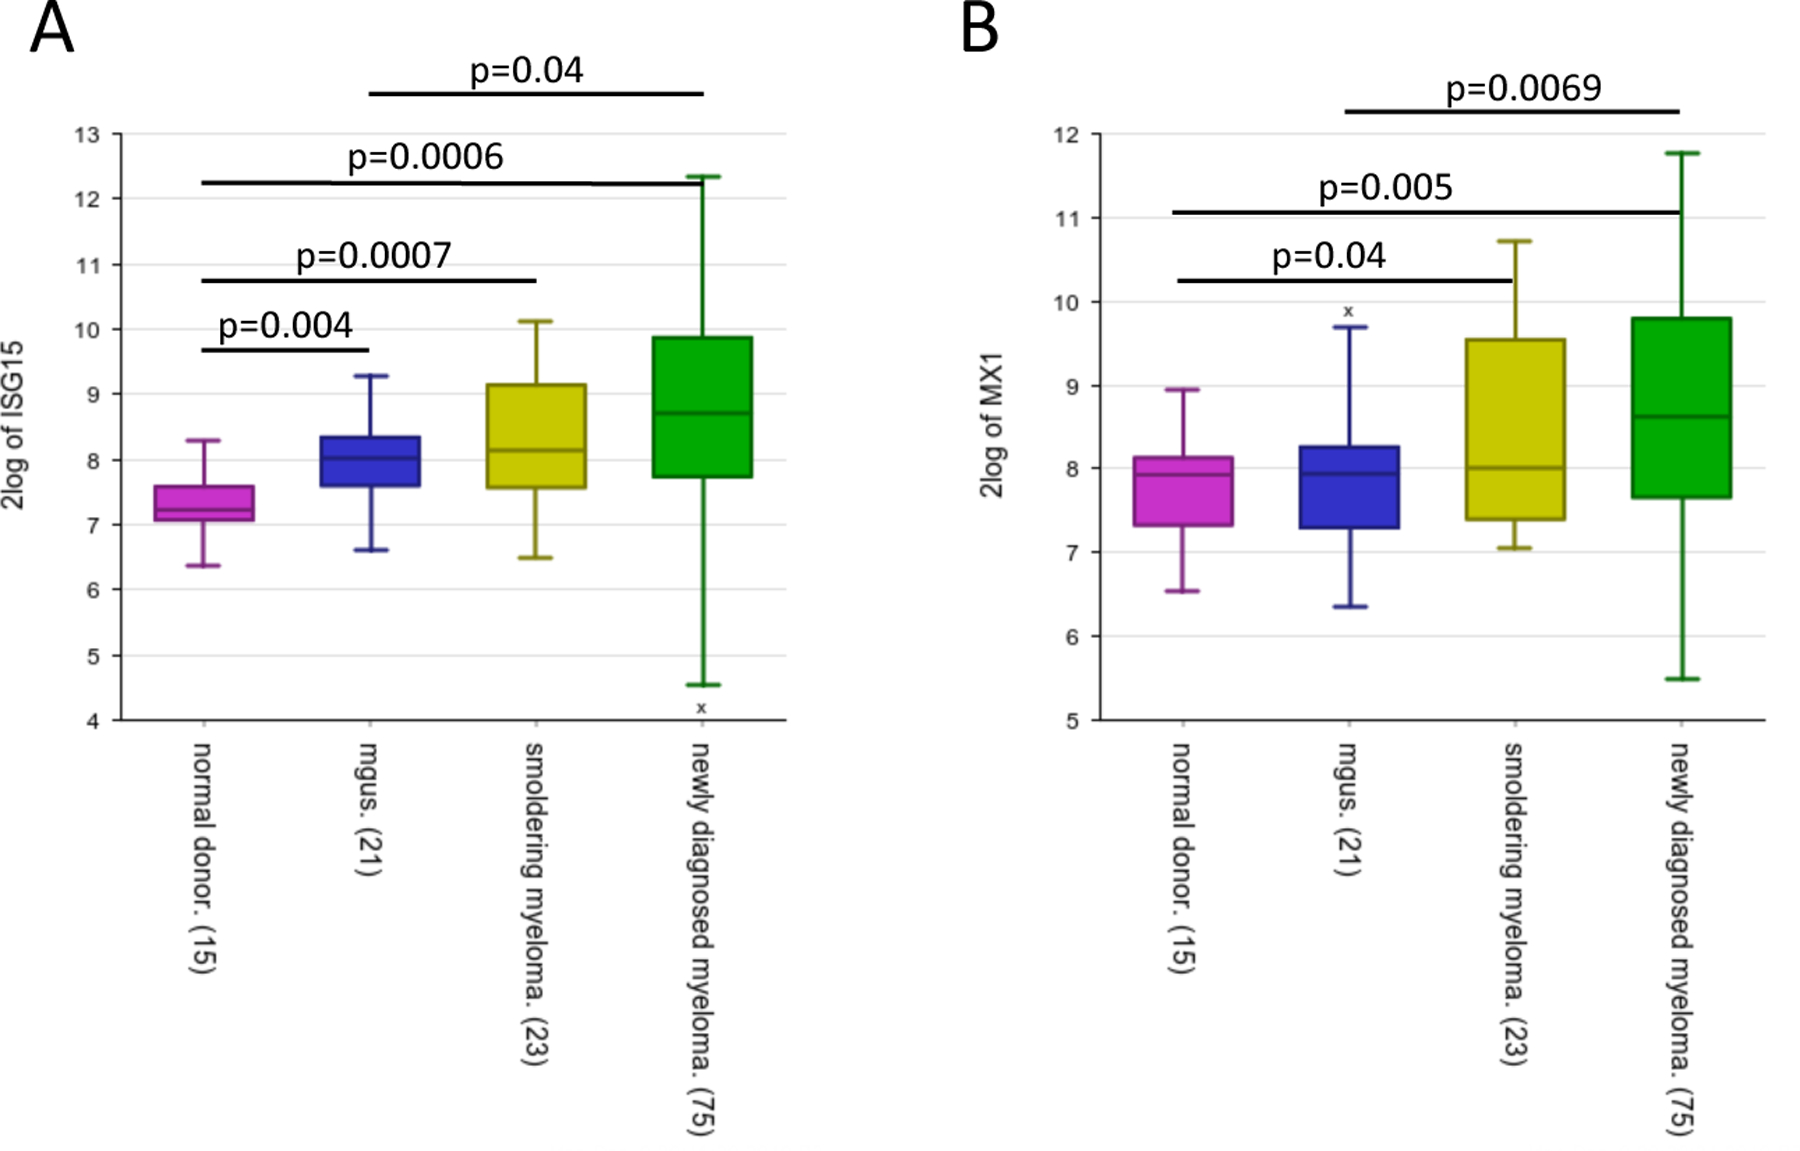
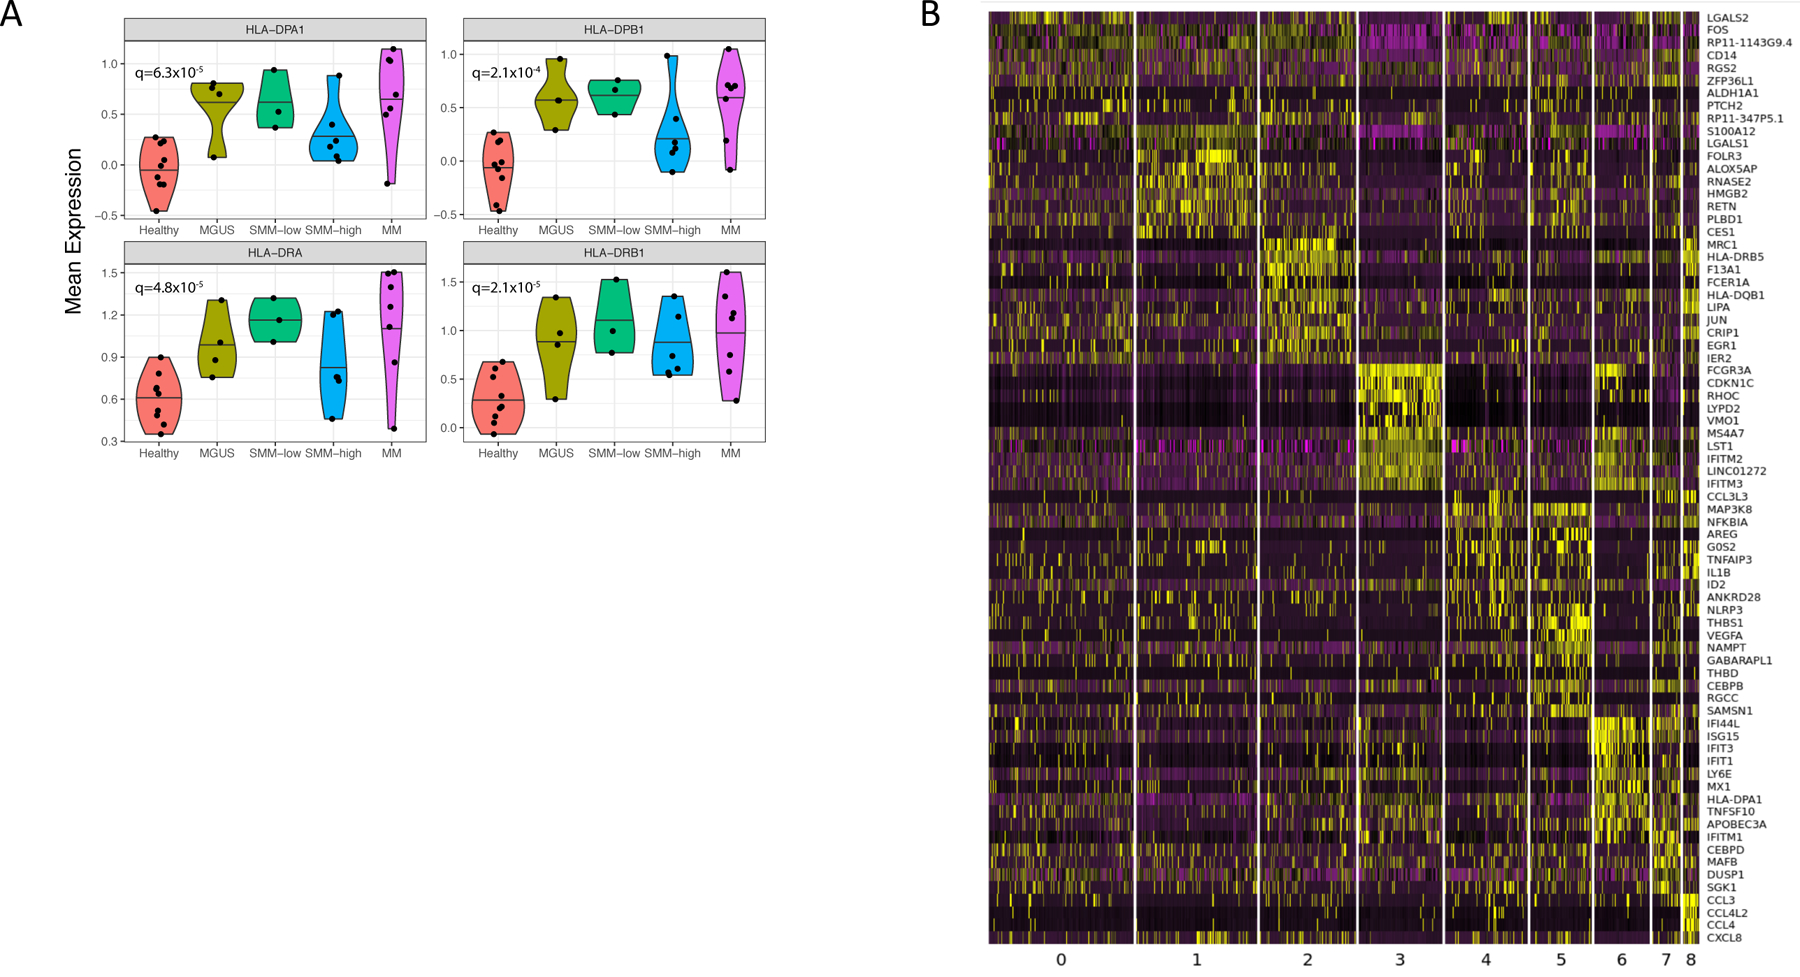
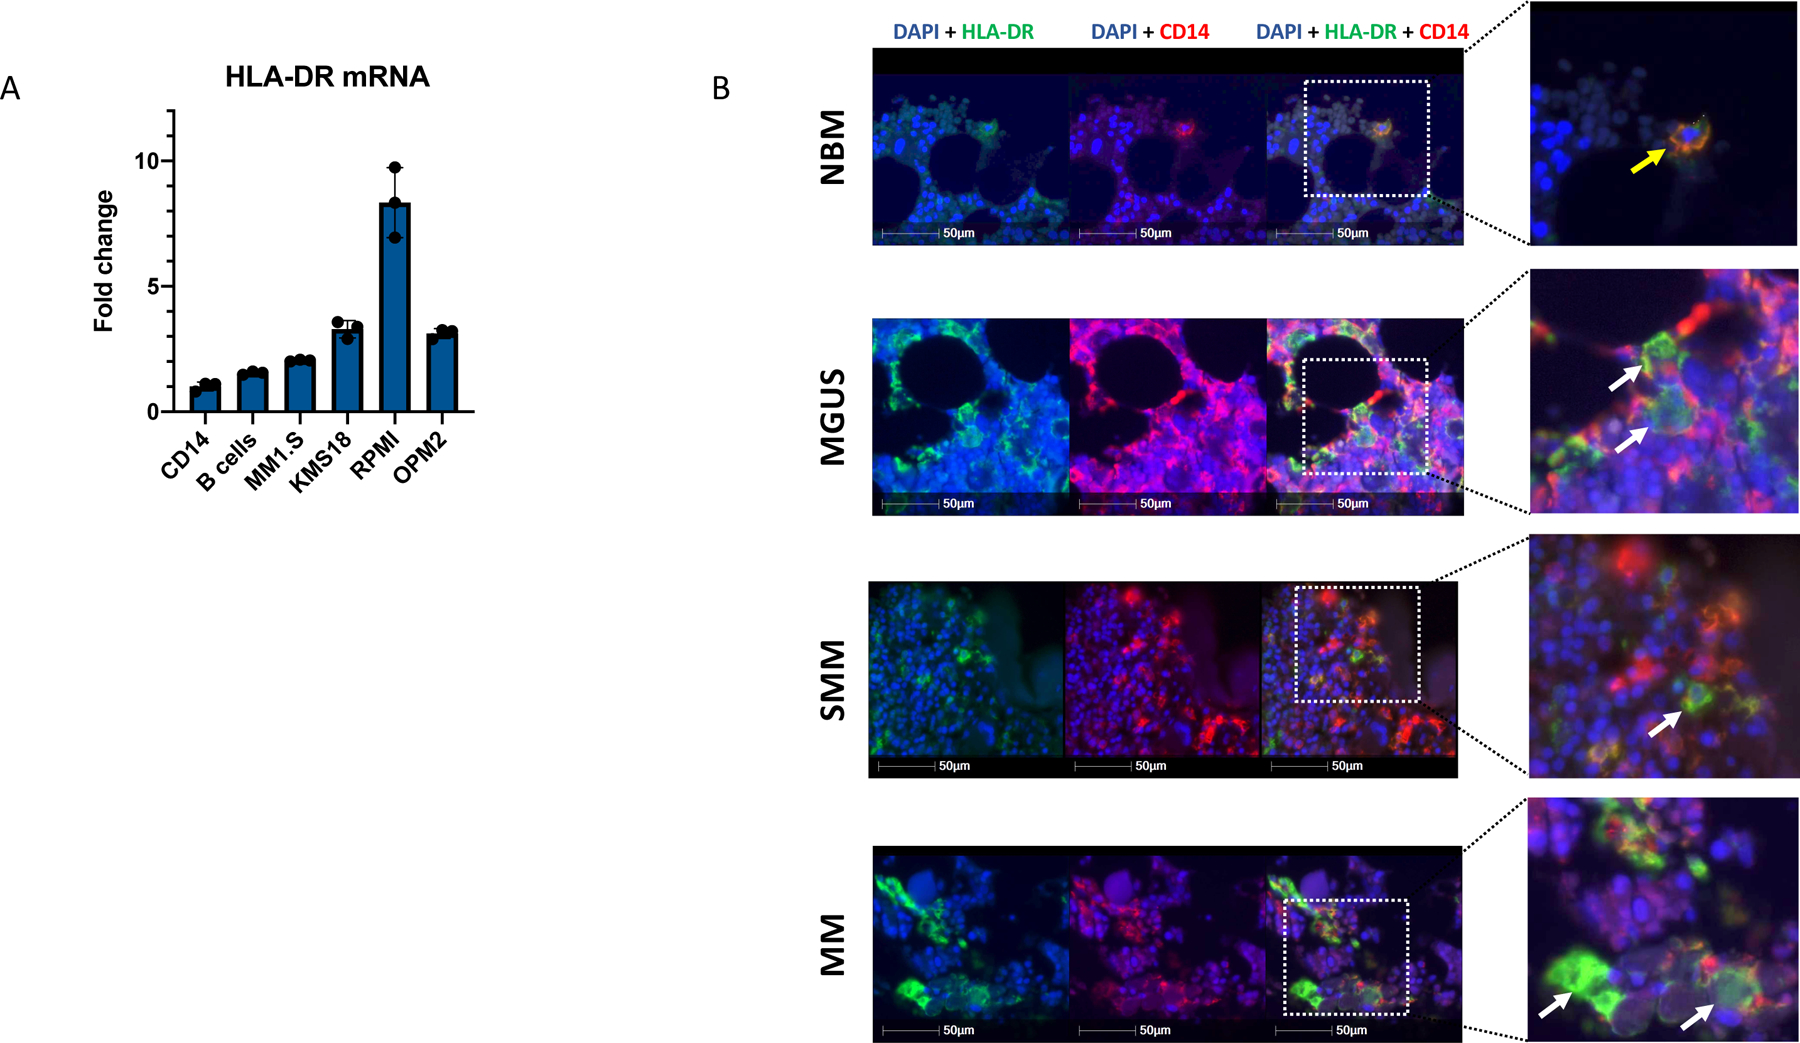
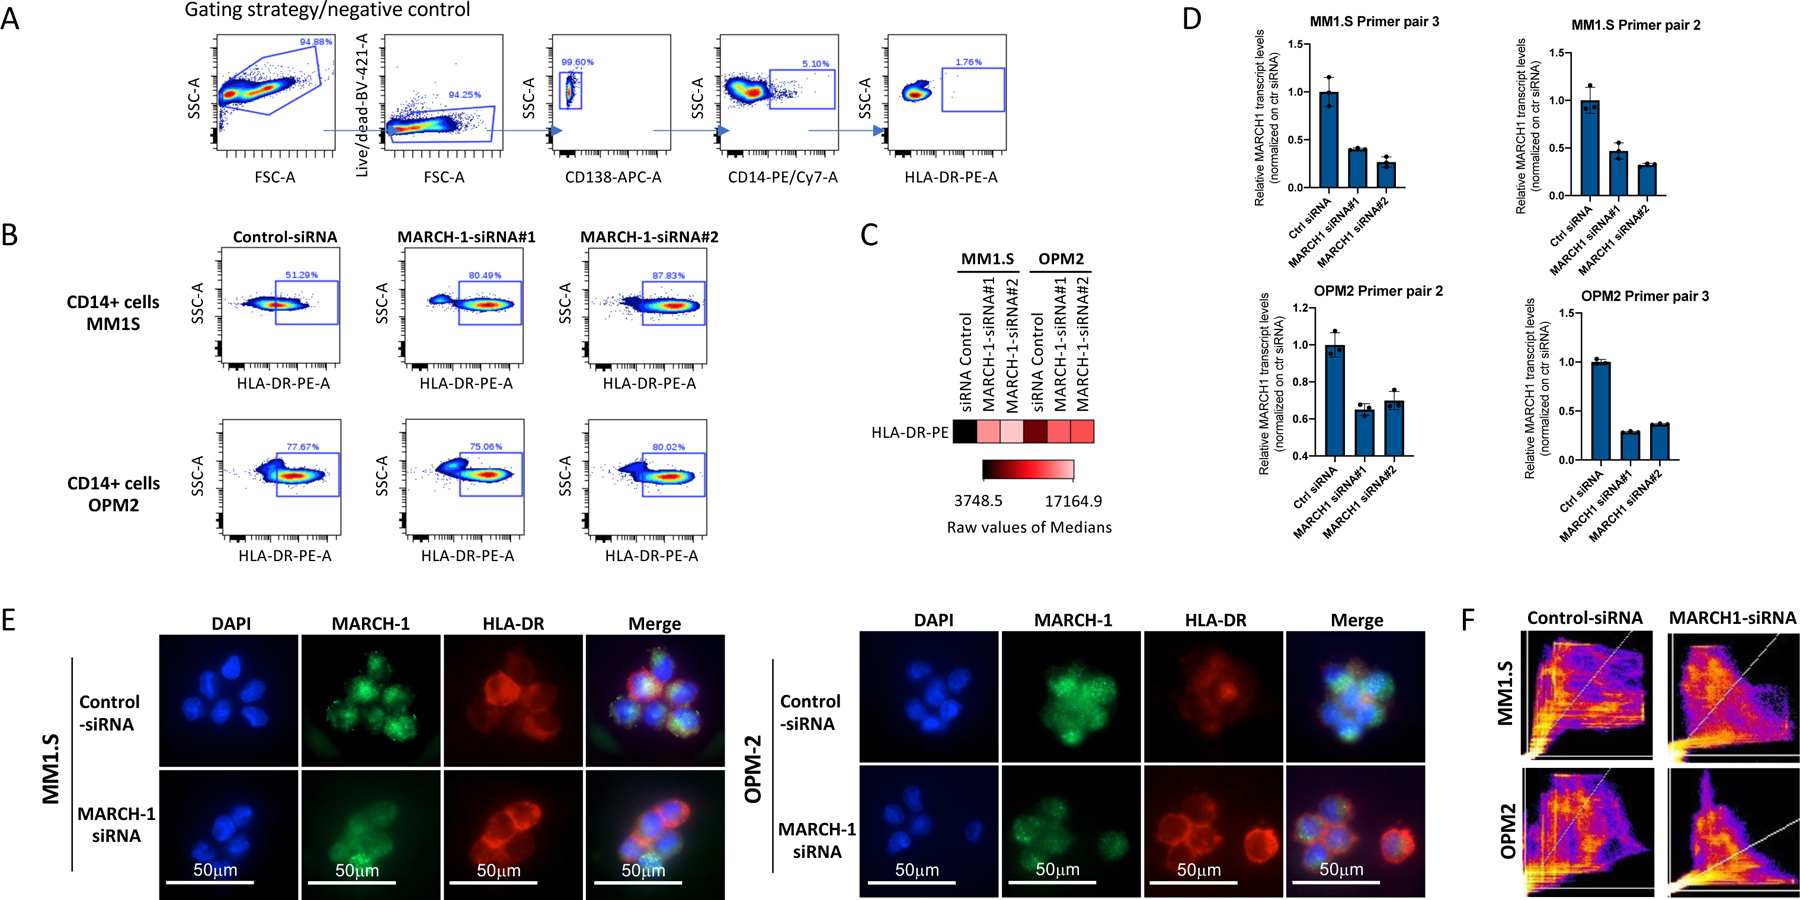
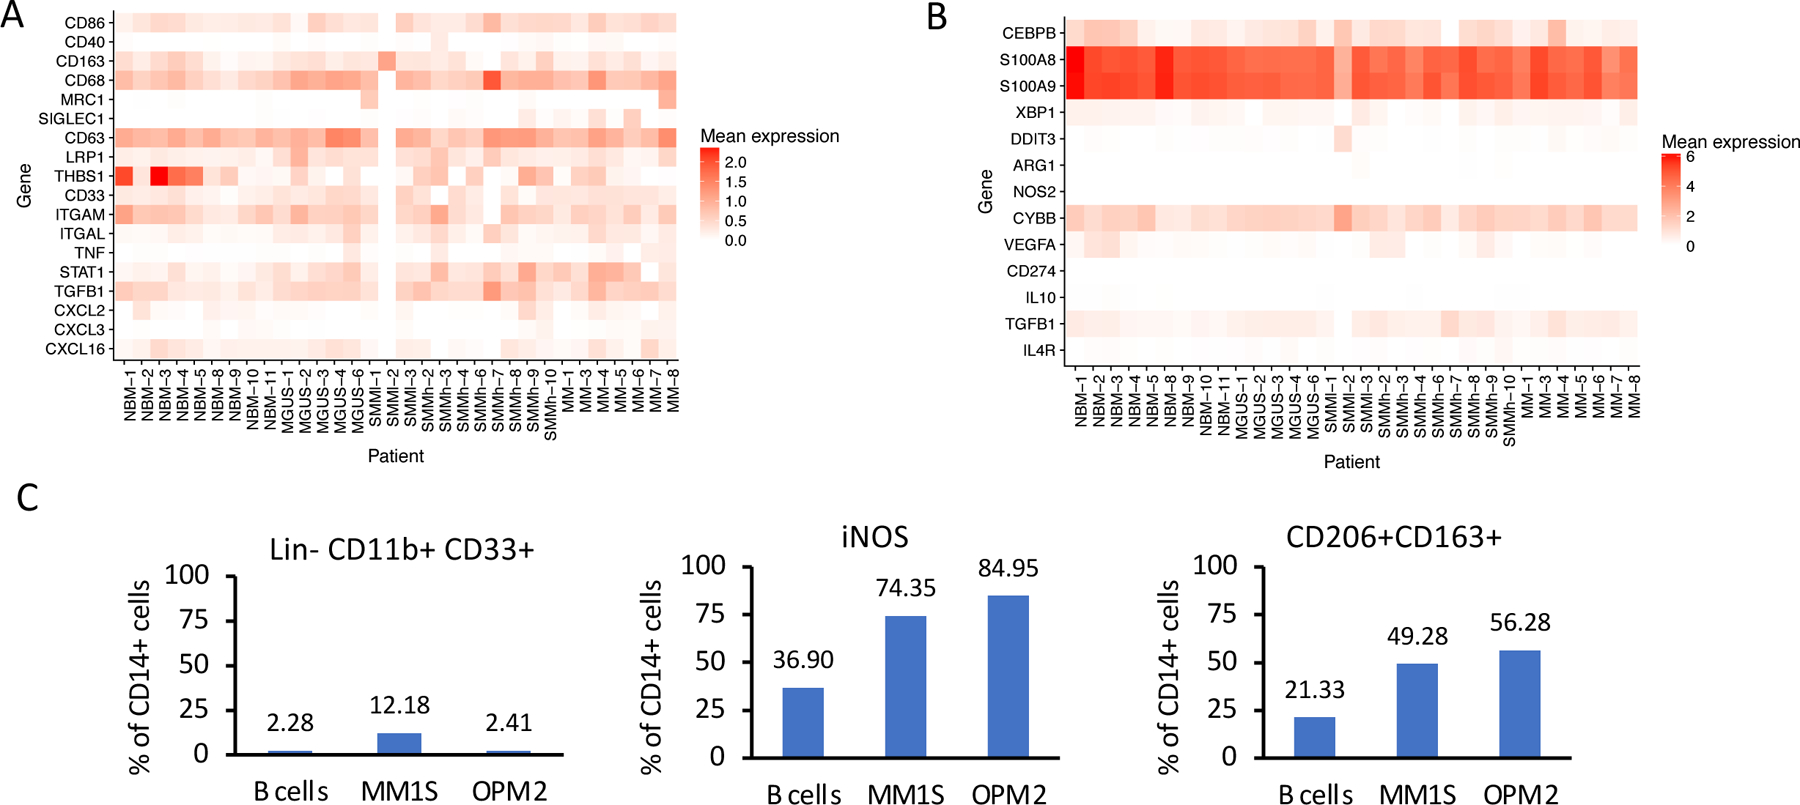
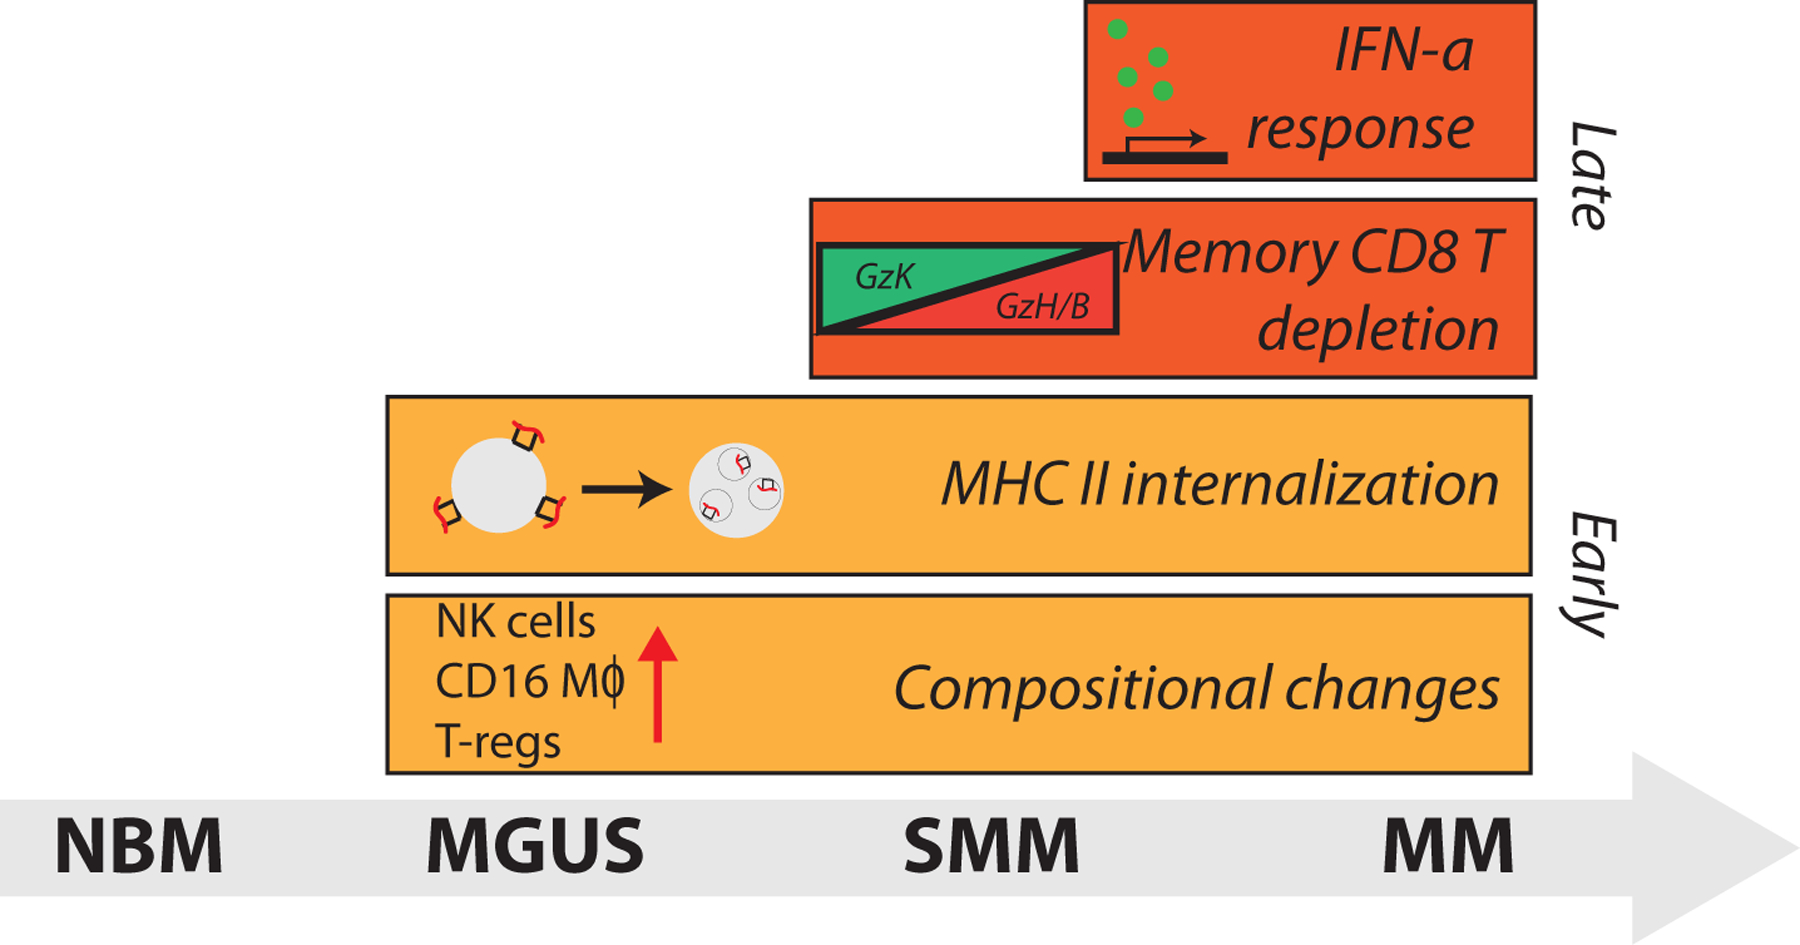
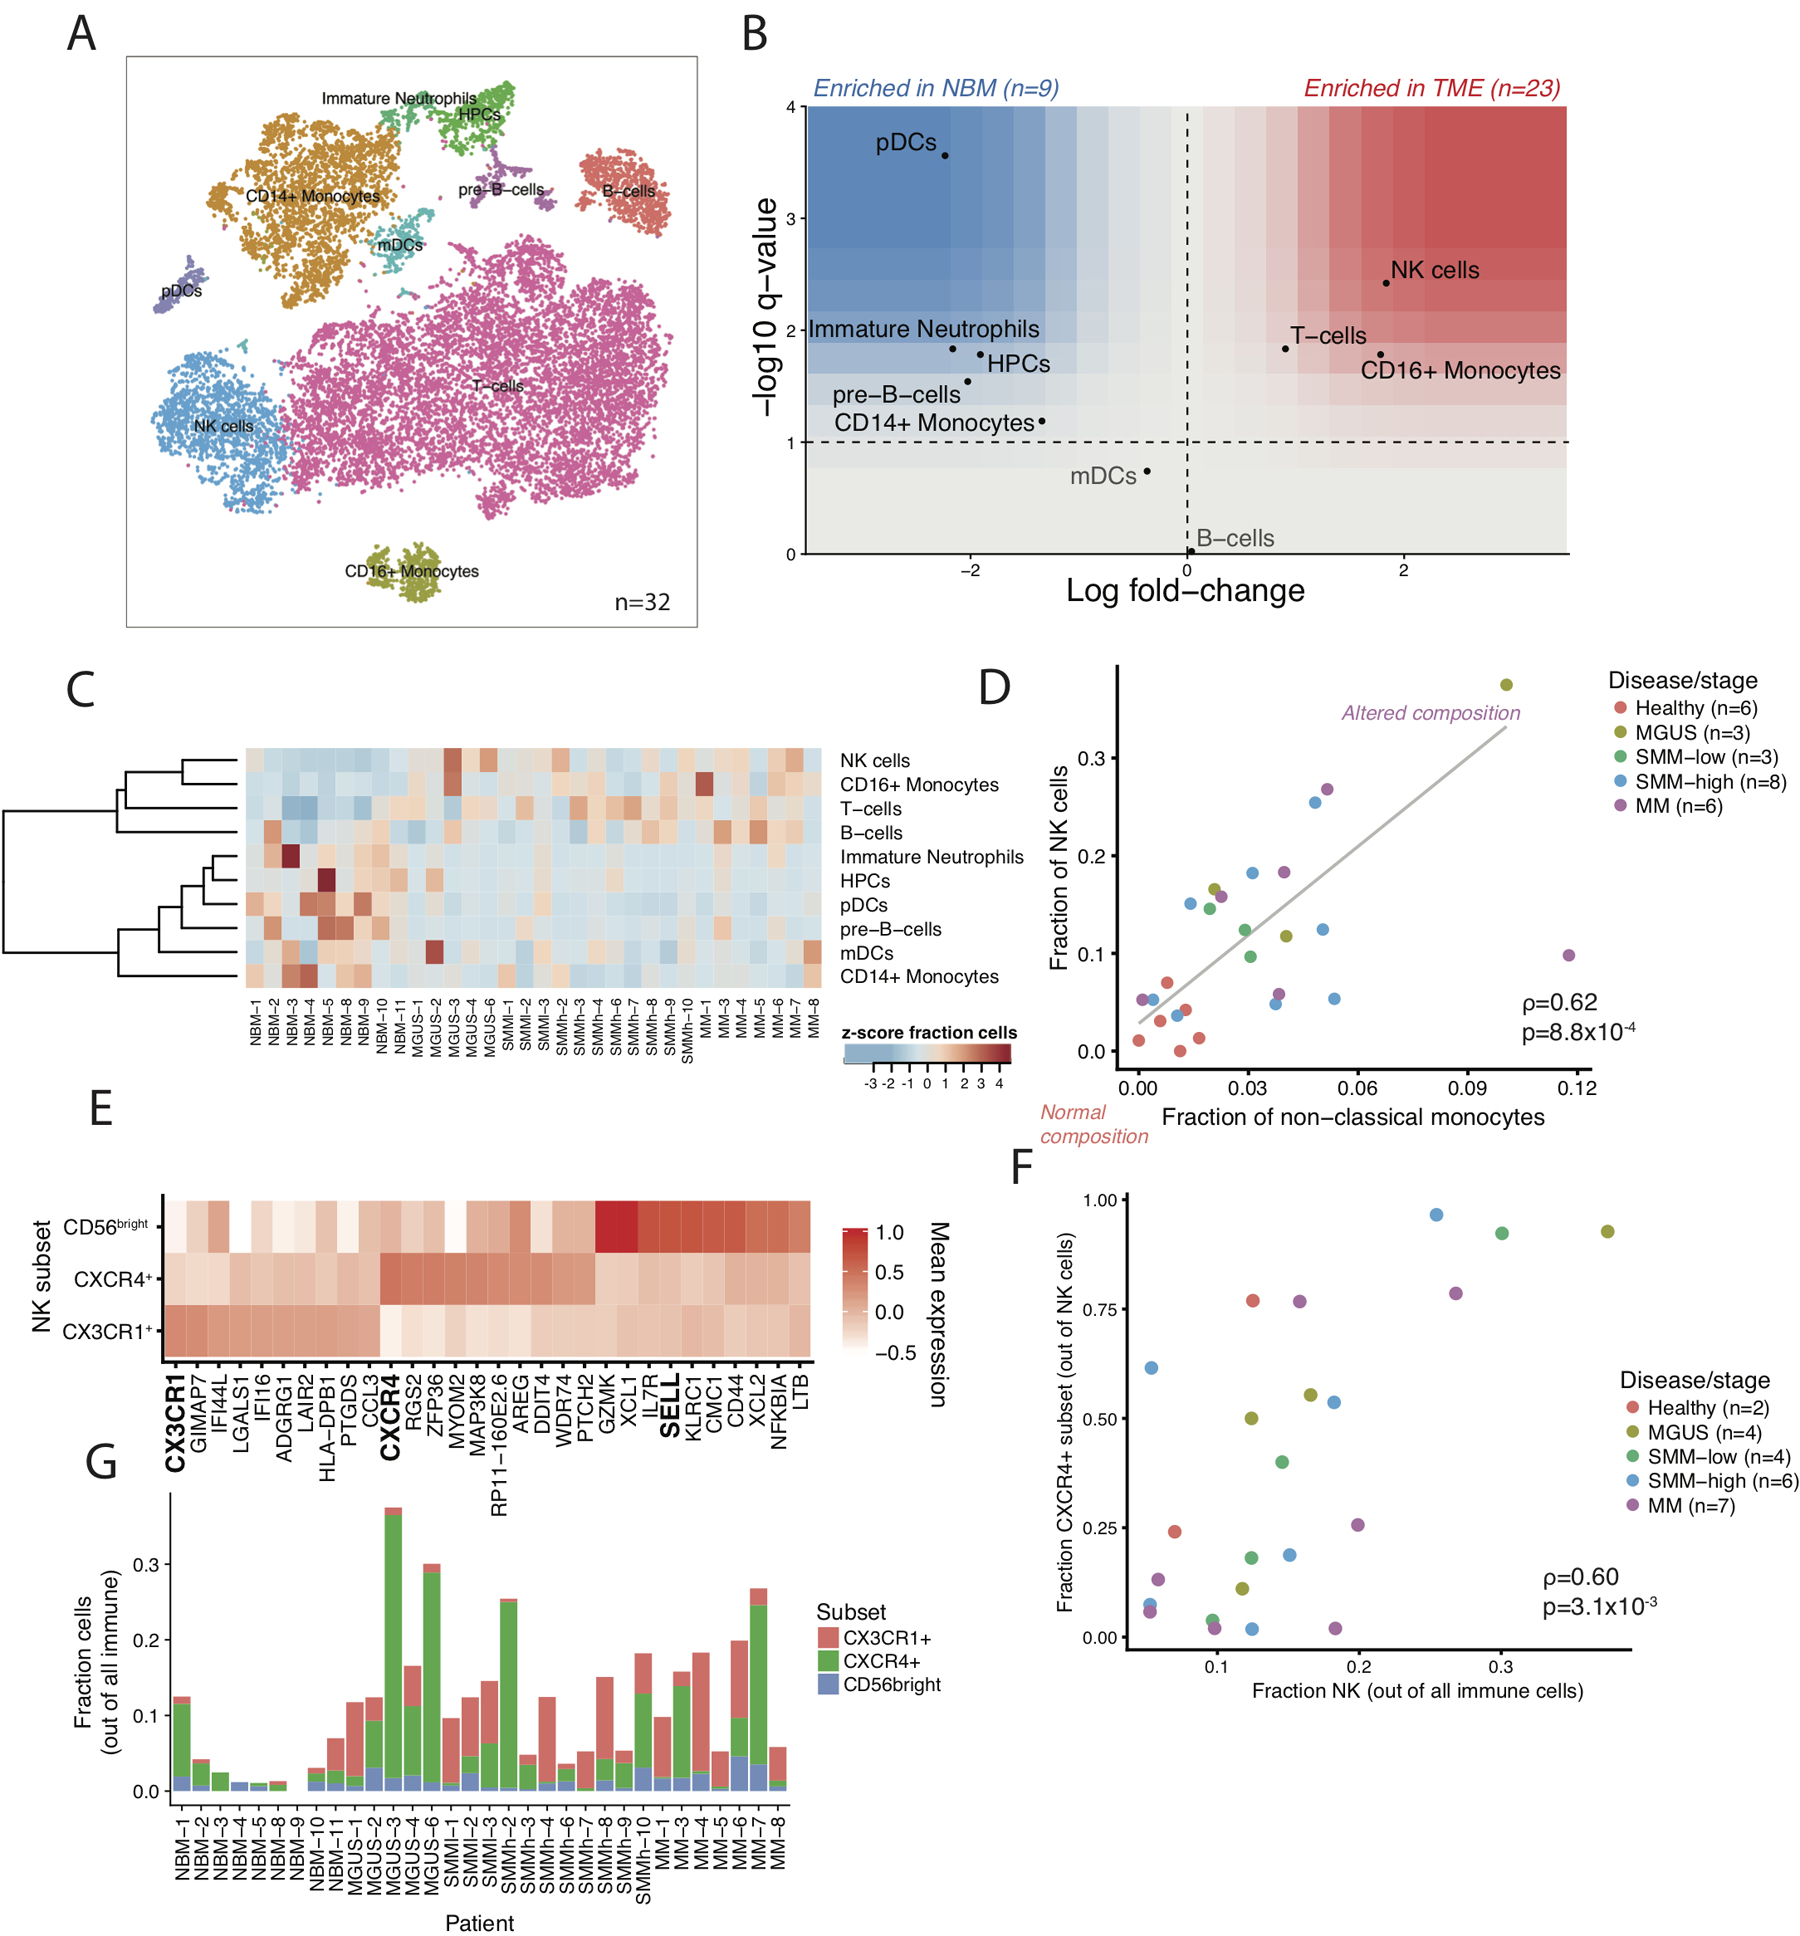
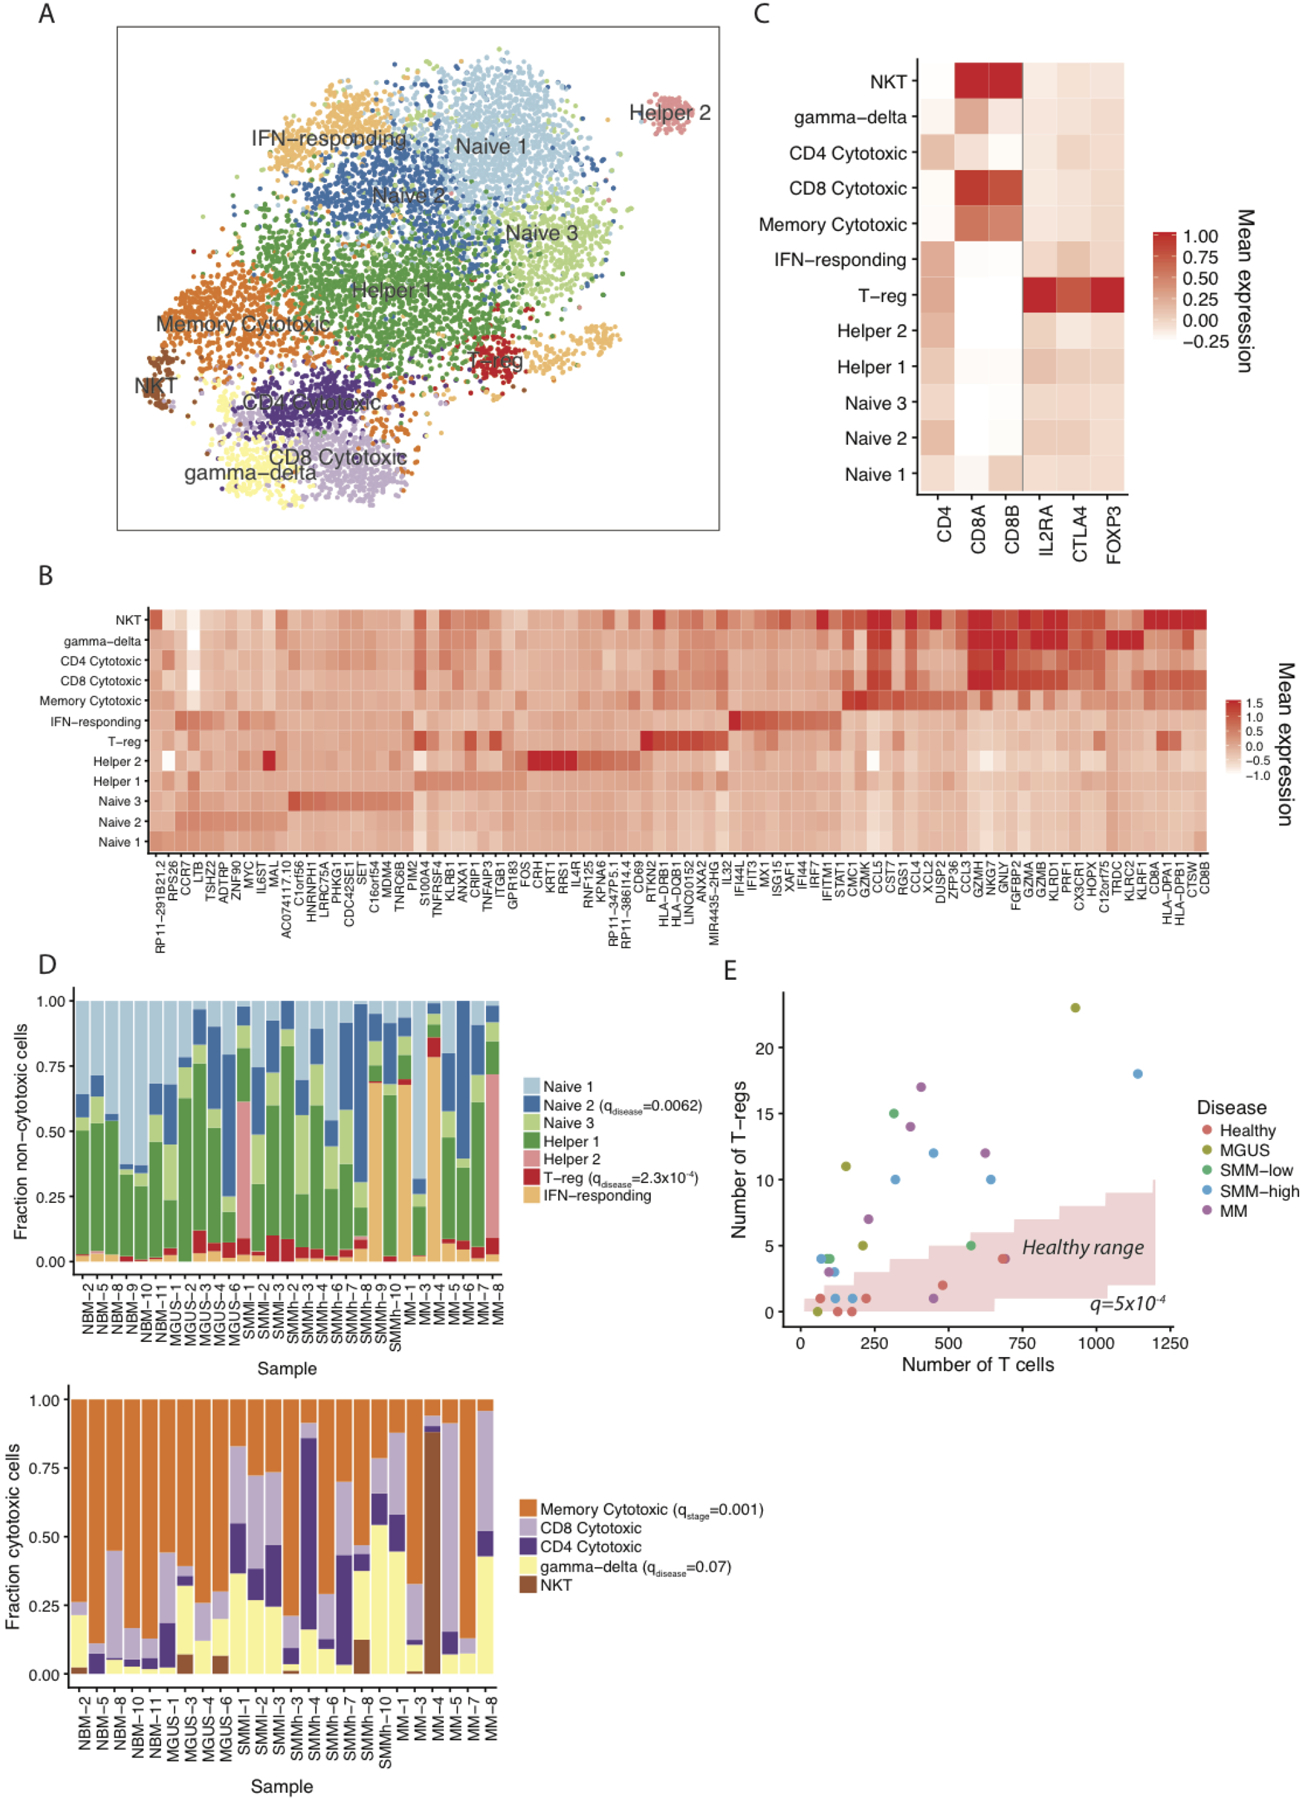
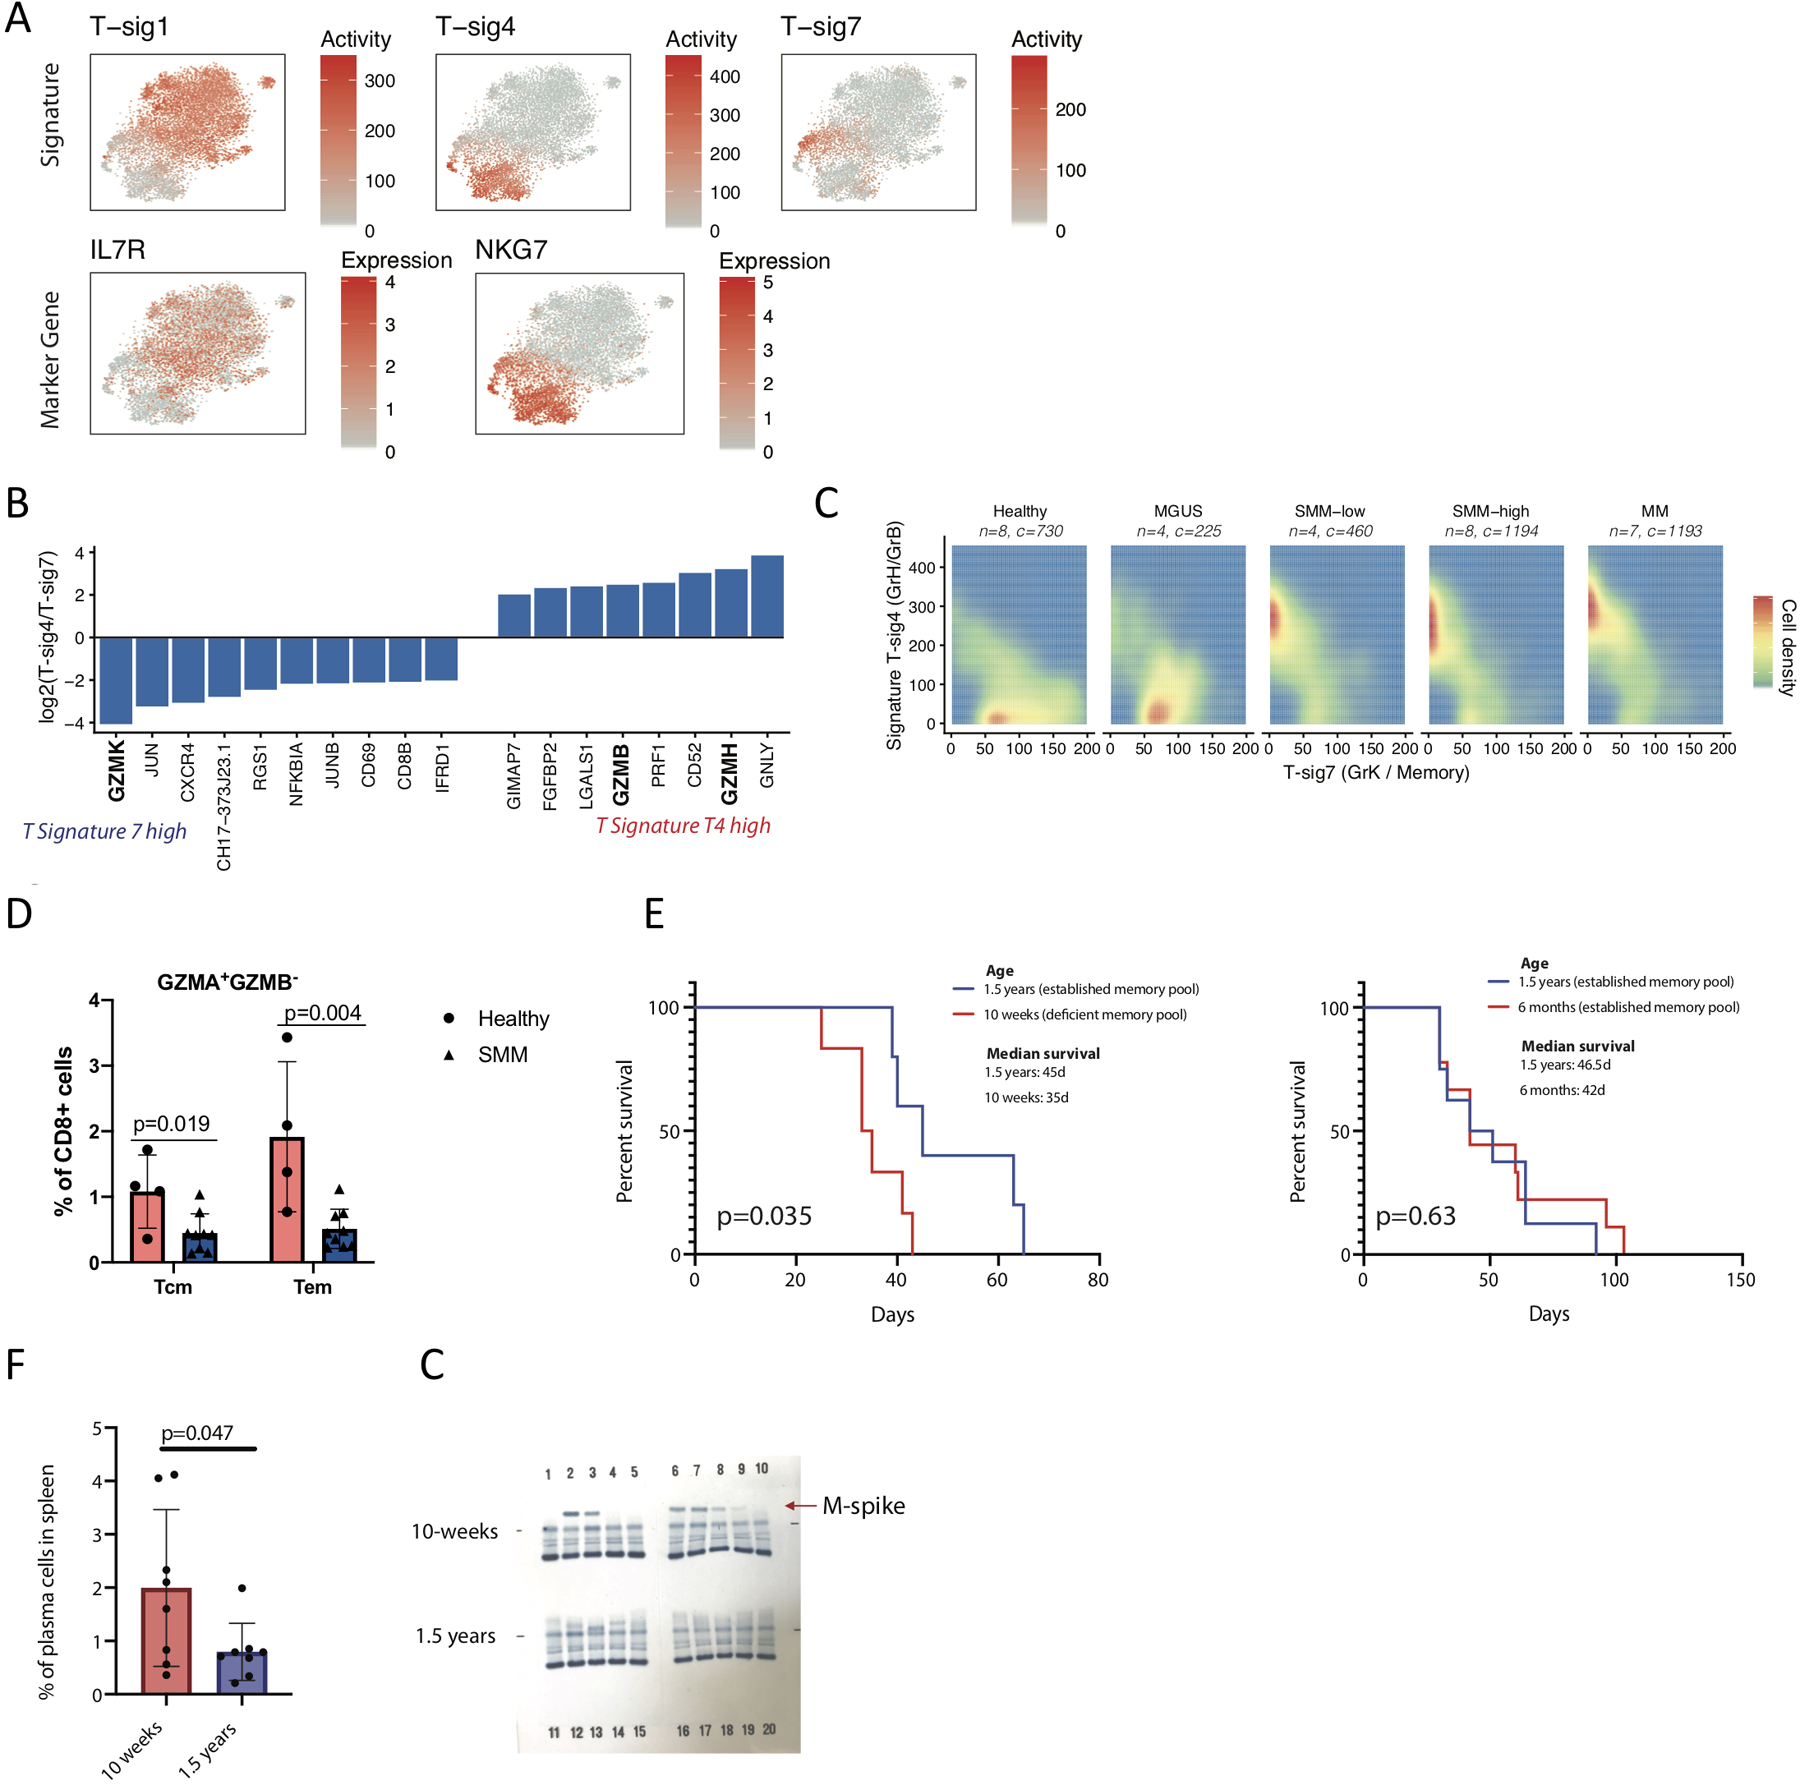
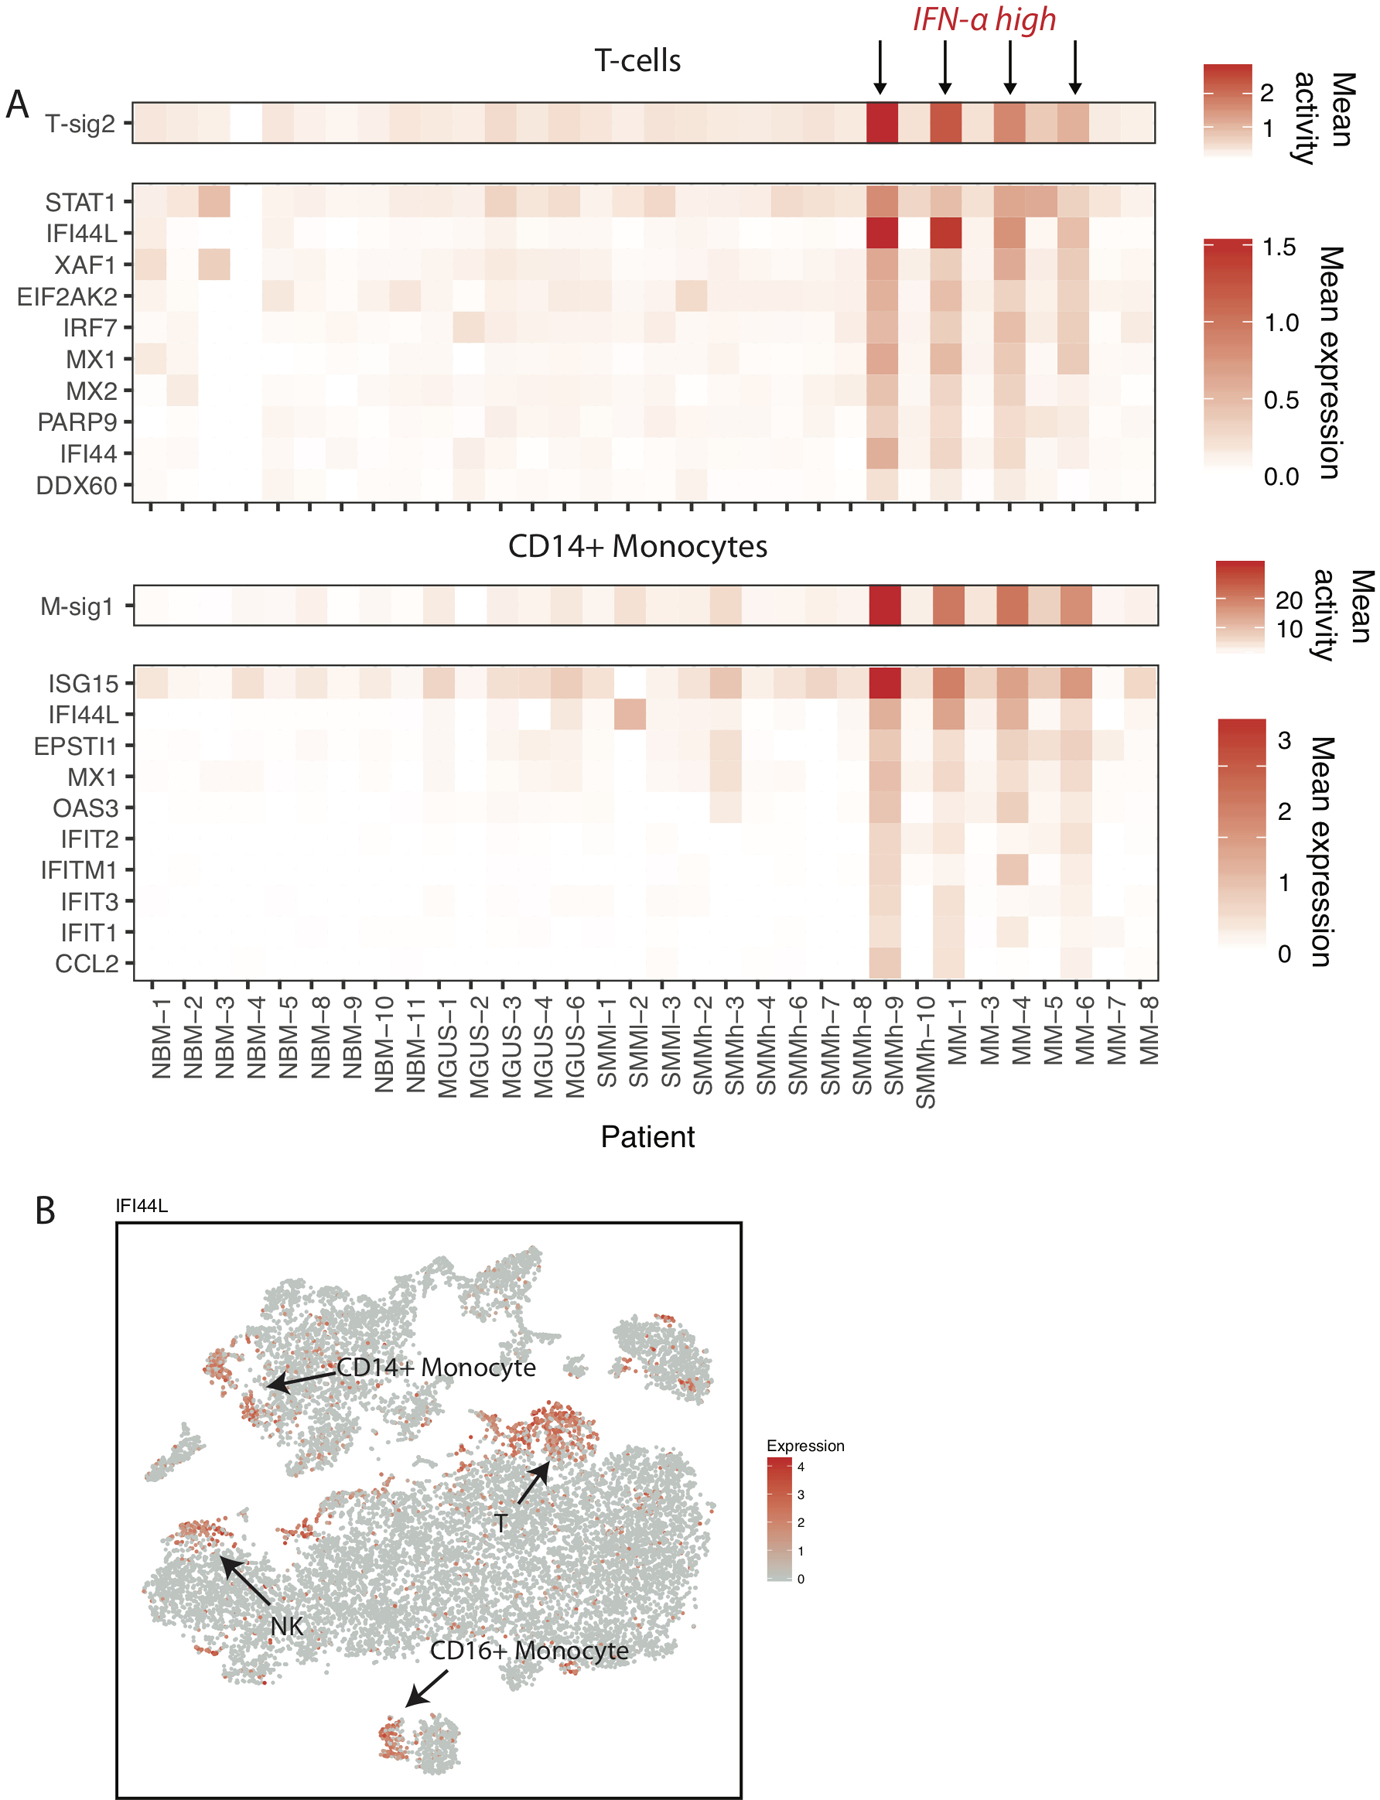
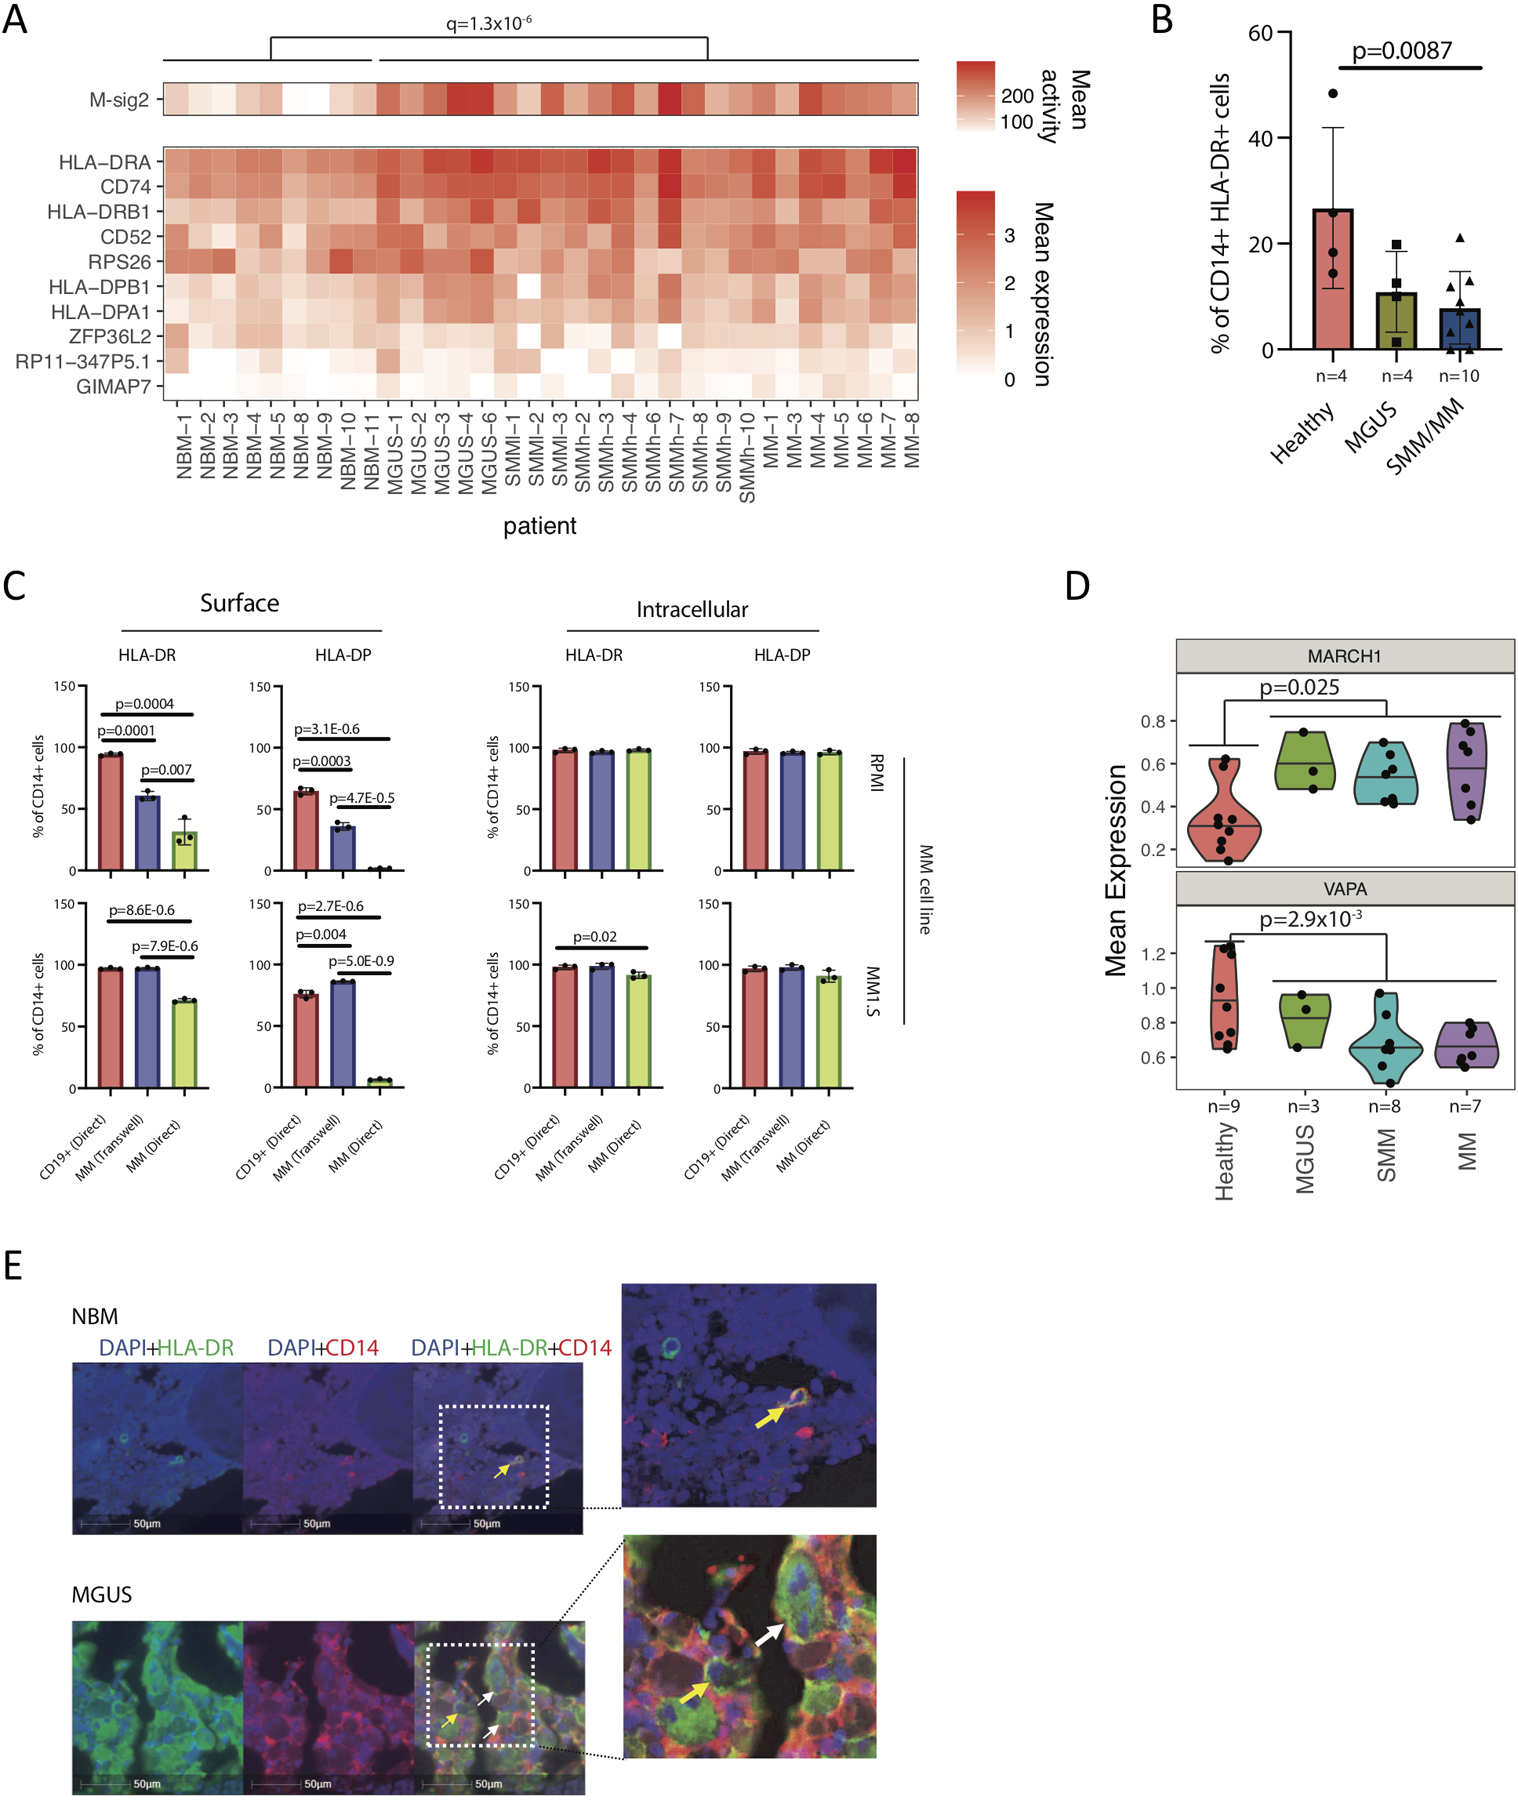
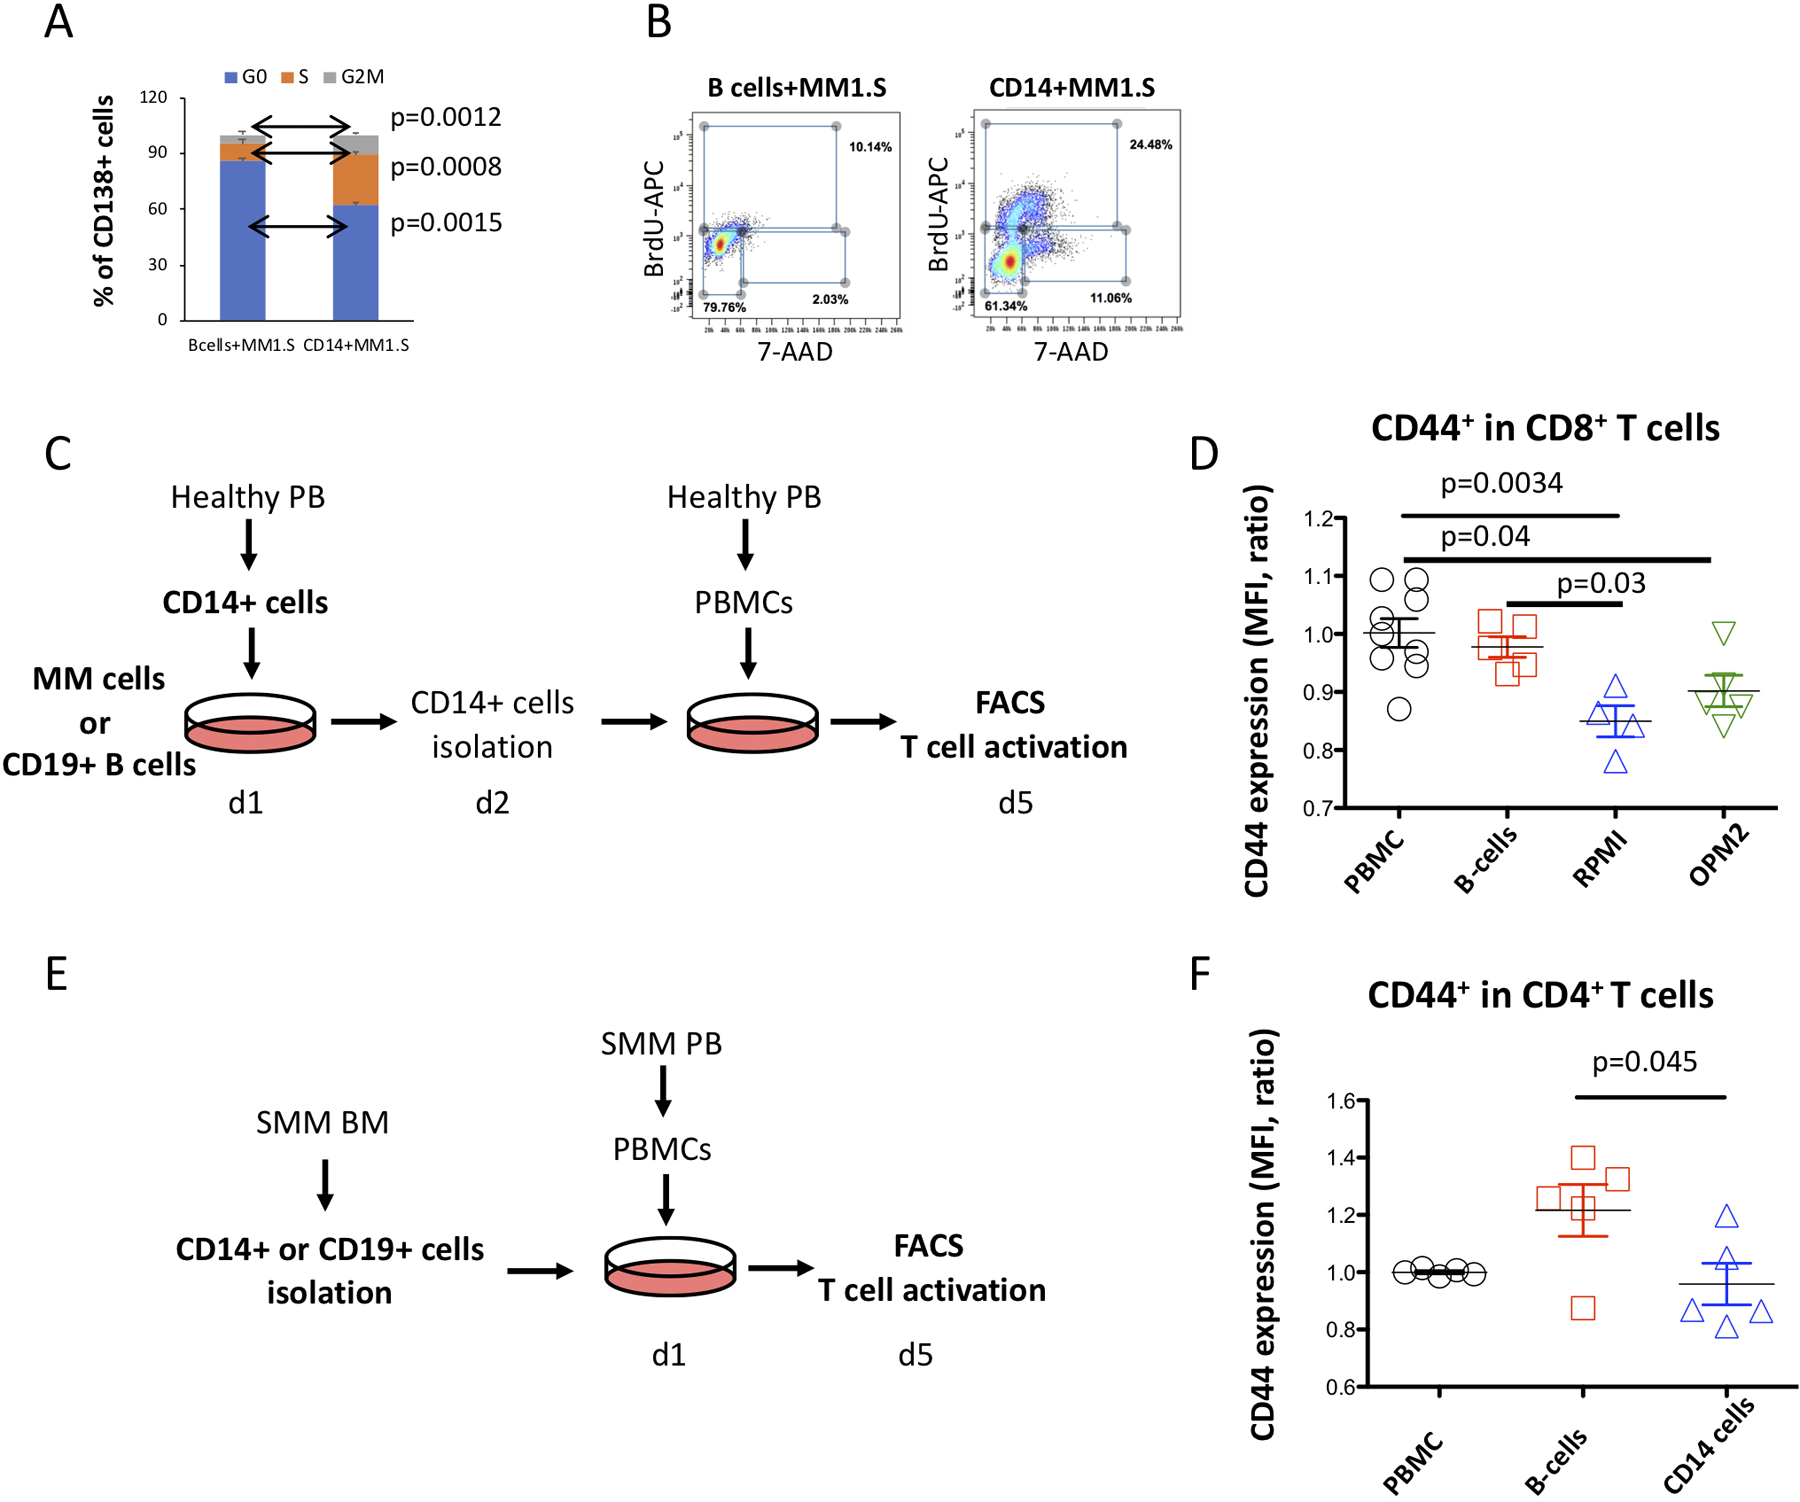
Precursor states of Multiple Myeloma (MM) and its native tumor microenvironment need in-depth molecular characterization to better stratify and treat patients at risk. Using single-cell RNA sequencing of bone marrow cells from precursor stages, MGUS and smoldering myeloma (SMM), to full-blown MM alongside healthy donors, we demonstrate early immune changes during patient progression. We find NK cell abundance is frequently increased in early stages, and associated with altered chemokine receptor expression. As early as SMM, we show loss of GrK+ memory cytotoxic T-cells, and show their critical role in MM immunosurveillance in mouse models. Finally, we report MHC class II dysregulation in CD14+ monocytes, which results in T cell suppression in vitro. These results provide a comprehensive map of immune changes at play over the evolution of pre-malignant MM, which will help develop strategies for immune-based patient stratification.

Keywords: MGUS; SMM; immune microenvironment; multiple myeloma; plasma cells; single-cell RNA sequencing; tumor microenvironment.


Conflict of interest statement

COMPETING INTERESTS STATEMENT G.G. receives research funds from IBM and Pharmacyclics. I.M.G. has a consulting/advisory role with GSK, AbbVie, Bristol-Myers Squibb (BMS). I.M.G has a consulting role with Sanofi, Janssen, Takeda, Celgene, Karyopharm, GNS, Cellectar, Medscape, Genetech, Adaptive, Aptitude, Curio Science, Magenta, Oncopeptides. I.M.G. received research funding/ honoraria from Celgene, Takeda, BMS, Janssen Pharmaceuticals, and Amgen.

Figures

Extended Data Figure 1.
Extended Data Figure 1.. Marker genes demonstrating cell type identity of immune cell clusters.
tSNE representation of CD45 cell populations. In each subplot, cells are colored by log-normalized expression values for a given cell type specific marker gene.
Extended Data Figure 2.
Extended Data Figure 2.. Single-cell RNA sequencing results indicate changes in NK cell compartment as compared to healthy donors.
(A) A significant increase in fraction of NK cells in patients with malignant cells expressing IgG heavy chain. Fractions of NK cells are plotted for patients grouped by immunoglobulin heavy chain. Violin plots show minimum, median, and maximum values. A two-tailed t-test was performed on n=19 patient samples with df=12. (B) Spearman correlation between NK cell fraction and CXCR4+ subset frequency calculated on 10,0000 samples with replacement of data points. 95% confidence interval is shown. (C) Grouping of samples above and below median values for NK cell frequencies and CXCR4+ subset fractions. Points on the median were assigned in the conservative direction (i.e. to obtain a less significant p-value). A two-sided fisher-exact test was performed on n=23 patient samples.
Extended Data Figure 3.
Extended Data Figure 3.. Compositional alterations in immune populations of diseased patients as compared to healthy donors.
CyTOF profiling of 4 healthy donors and 13 MGUS-MM patients show (A) significantly increased numbers of CD3+CD4+ T cells in BM aspirates of the patients as compared to healthy BM with mean values of 2.3 and 11.12 for CD3+CD4+, 1.6 and 3.7 for NK, 1.5 and 0.5 for dendritic cells (DC) in healthy donors and MM patients respectively. Significant difference between groups was tested using a two-sided t-test. Bars represent SD. (B) Plasmacytoid DC (pDC) are significantly enriched in healthy BM as compared to MM patients with mean values of 1.2 and 0.26 respectively. Mean values for monocytic DC (mDC) are 3.7 and 3.2 for healthy donors and MM patients respectively. Significant difference between groups was tested using a two-sided t-test. Bars represent average deviation. (C) Classical monocytes (cMonoc) are enriched in BM aspirates of healthy donors compared to MM patients with respective mean values of 67.7and 26.5. Mean values for non-classical monocytes (nc Monoc) were 13.1 and 44.4 for healthy donors and MM patients respectively. Significant difference between groups was tested using a two-sided t-test. Bars represent average deviation. (D) Proportion of CD66b+ cells in BM aspirates of SMM patients and healthy donors. Mean values are 23.8 and 20.6 for healthy donors and MM patients respectively. Significant difference between groups was tested using a two-sided t-test. Bars represent SD.
Extended Data Figure 4.
Extended Data Figure 4.. Transcriptional alterations in cytotoxic T cell populations of diseased patients as compared to healthy donors.
(A) Distribution of the Granzyme expression in T-cell cluster. GZMA+GZMB corresponds to the Granzyme K expressing cells. (B) Normalized expression values for four exhaustion-related genes across different T cell subsets, pooling cells across patients. (C) Normalized expression values for four exhaustion-related genes across different donors and patients, pooling cells across T subsets. (D) Heatmap of immune checkpoint molecules expression levels on different subsets of bone marrow T cells in SMM patients (n=8) as compared to healthy donors (n=4). Individual patients show increased levels of PD-1 and TIGIT in GrB expressing effector cells. Colored scale represents transformed ratio of protein expression. Barplots show variable expression of TIGIT (with mean values of 0.01 vs 0.12), PD-1 (0.52 vs. 0.55) and TIM-3 (0.39 vs. 0.51) in GrB-expressing T effectors from healthy BM and SMM patients respectively. Significant difference between groups was tested using a two-sided t-test. Bars represent SD. (E) Healthy memory cells show significantly higher expression of PD-1 compared to those of SMM patients with mean values of 19.5 and 4.7 respectively. Significant difference between groups was tested using a two-sided t-test. Bars represent SD.
Extended Data Figure 5.
Extended Data Figure 5.. IFN type-1 signaling increases in plasma cells during disease progression.
Expression of ISG-15 (A) and MX1 (B) increases during disease progression. Significant difference is observed between MGUS and MM stage, indicating an increase of IFN signals at later stages in the disease progression (GSE6477). Box plot displays the first quartile, median and third quartile for the gene expression levels, bars indicate the minimum and maximum value. Significant difference between groups was tested using one-way ANOVA and Tukey multiple comparison tests for healthy donors (ND, n=15), MGUS (n=21), SMM (n=23) and newly diagnosed MM (n=75).
Extended Data Figure 6.
Extended Data Figure 6.. Marker genes demonstrating cell type identity of monocytic clusters.
(A) Mean expression of MHC II encoding genes. Violin plots show minimum, median, and maximum values. A BH-corrected two-tailed t-test was performed on n=32 patient samples. (B) Heatmap of expression values for the top 10 genes with enriched expression in all monocytes discovered by k-nearest neighbors’ subclustering. Expression values are centered and normalized for each gene.
Extended Data Figure 7.
Extended Data Figure 7.. Dysregulation of HLA-DR surface representation in monocytes from diseased environment.
(A) qPCR data demonstrate significant increase of HLA-DR expression in CD14+ monocytes after co-culture with MM cell lines. CD14+ cells alone and those co-cultured with B cells were used as a control. Median ratios were 1.54 for B cells, 2.07 for MM1.S cells, 3.28 for KMS-18, 8.34 for RPMI and 3.12 for OPM2 cells as compared to CD14+ control (1.0). Bars represent SD. Experiment was performed twice with independent donors in triplicates. Representative data from one experiment is shown. (B) Immunofluorescence staining of tissue microarrays from MGUS, SMM and MM patients (n=45, TMA performed in triplicates, total of 135 BM sections analysed) demonstrates prevalent intracellular accumulation of HLA-DR (green) in CD14-expressing monocytes (red) in disease settings. Membrane-bound localization of HLA-DR was observed in healthy bone marrow monocytes. (yellow arrows point on cells with HLA-DR localized to the cell membrane, white arrows point on cells with HLA-DR accumulated in the cytoplasm.
Extended Data Figure 8.
Extended Data Figure 8.. MARCH-1 dependent internalization of HLA-DR in CD14+ monocytes in myeloma environment.
(A) Gating strategy for HLA-DR on CD14+ cells. (B) Knockdown of MARCH-1 by siRNA rescues presentation of HLA-DR molecules on the surface of CD14+ monocytes co-cultured with MM cells. Representative FACS profiles show higher numbers of HLA-DR+ cells after MARCH-1 knockdown with siRNA (experiment performed 3 times with 3 different donors using 2 different cell lines/2 different siRNA for MARCH-1, non-targeting si-RNA is used as a control). (C) Mean fluorescence intensity demonstrates the two to 4.5-fold increase in the levels of HLA-DR protein expression on the cell surface of CD14+ cells. (D) qPCR data for relative expression of MARCH-1 in CD14+ cells after siRNA knockdown as compared to the si-RNA control. Assay performed twice with independent donors/2 cell lines/2 siRNAs, performed in triplicates. Representative data from one experiment is shown. In MM1.S cells, siRNA knockdown leads to reduction of MARCH-1 expression to 0.46 and 0.32 (median value, amplified with primer pair 2) and to 0.40 and 0.26 (median value, amplified with primer pair 3) as compared to control siRNA (median value, 1.0). In OPM2 cells, siRNA knockdown leads to reduction of MARCH-1 expression to 0.65 and 0.7 (median value, amplified with primer pair 2) and to 0.29 and 0.36 (median value, amplified with primer pair 3) as compared to control siRNA (median value, 1.0). Bars represent STDEVP. (E) CD14+ cells with lower levels of MARCH-1 have increased HLA-DR protein on their cell surface. Experiment performed twice with two independent donors/2 cell lines/2 siRNAs. (F) Stronger correlation of DAPI and HLA-DR localization in MM1.S and OPM2 cells in control cells as compared to those after MARCH-1-siRNA transfection. Experiment performed twice with two independent donors/2 cell lines/2 siRNAs.
Extended Data Figure 9.
Extended Data Figure 9.. CD14+ monocytes do not show the M-MDSC phenotype after co-culture with MM cells.
Expression of different markers for (A) macrophages/monocytes and (B) MDSCs on CD14+ cells in patients and healthy donors. (C) CD14+ cells from healthy donors were co-cultured with MM cells. FACS analysis was performed on day 3 after co-culture. Representative results from one out of two independent experiments performed with two healthy donors/2 different cell lines. Due to restricted cell numbers, no replicates could be used. All donors have similar distribution of cells as compared to controls.
Extended Data Figure 10:
Extended Data Figure 10:. Alterations in tumor microenvironment start from the precursor stages of the MM and exhibit heterogeneous changes in the immune cell repertoire.
Illustration of immune alterations observed during progression. Bars begin at the stage in which they are first observed in our dataset.
Figure 1.
Figure 1.. The immune landscape in healthy and MM samples.
(A) tSNE representation of immune cells identified in CD45+ population. (B) Immune composition changes between normal and cancer samples. For each cell type, the log fold- change in mean cell fraction between tumor and normal samples, with -log10 Benjamin-Hochberg corrected two-sided Wilcoxon rank sum p- values on the y-axis using n=32 patient samples. (C) Distribution of different cell types in CD45+ fraction for individual patients and healthy donors. Cell type fractions are z-standardized across patients. (D) Proportion of NK cells correlated with numbers of non-classical monocyte cell fractions indicating inflammatory environment in patients as compared to healthy controls. Only samples with at least 200 total cells are shown. Correlation is assessed by Spearman coefficient on n=26 patient samples. (E) Distribution of NK cell subsets in the BM microenvironment. Heatmap shows the mean expression of highly represented individual marker genes per cluster. (F) Scatter plot of the fraction of NK cells in a given patient that are CXCR4+ vs the fraction of all immune cells that are NK. Only samples with at least 50 NK cells are shown. Correlation is assessed by Spearman coefficient on n=23 patient samples. (G) Proportion of distinct NK-cell subsets per sample. Samples with high NK-cell enrichment are largely composed of the CXCR4+ subtype. Only samples with at least 50 NK cells are shown on n=23 patient samples.
Figure 2.
Figure 2.. Heterogeneous composition of T cells in diseased bone marrow microenvironment.
(A) tSNE visualization of T cell clusters localized in the BM. (B) Mean expression of differentially expressed marker genes per cluster. (C) Mean expression of individual genes additionally used for cluster definition. (D) Distribution of non-cytotoxic and cytotoxic T populations in individual samples. Only samples with at least 50 cells of the corresponding type are shown. (E) Significant enrichment of regulatory T cells in the bone marrow of diseased patients (q=0.0005 df=26.1, BH-corrected two-tailed t-test on fraction of Tregs between NBM and disease samples using n=29 patient samples with at least 50 T cells).
Figure 3.
Figure 3.. Skewed differentiation of cytotoxic T cells in MM patients at early disease stage.
(A) tSNE representation colored by T cell signature activity and marker genes for broad characteristic signatures. (B) Log fold-change of NMF gene weightings between cytotoxic T cell signatures T4 and T7. (C) Distribution of cells expressing Granzyme B/H (T-sig7) and Granzyme K (T-sig4) cytotoxic signatures in healthy donors and different stages of disease. Only T cells expressing one of the two signatures (>100 T-sig4 or >50 T-sig7 activity) are shown. (D) CyTOF data shows decreased numbers of cytotoxic memory cells in the BM of SMM patients as compared to healthy donors (with median value of 1.08 vs 0.45 for central memory cells, Tcm; 1.92 vs. 0.51 for effector memory cells, Tem, in healthy BM and SMM patients respectively). CyTOF was performed on CD138- cells from BM aspirates of SMM patients (n=9) and healthy donors (n=4) using Granzyme B-171Yb, Granzyme A-149Sm and Maxpar® Human T-Cell Phenotyping Panel Kit, 16 Marker. Cell subsets were defined as suggested by the manufacturer. Significance was tested with two-tailed t-test, bars represent SD. (E) Memory cells are critical for immunosurveillance in MM. Significantly shorter survival of 10 weeks old KaLwRj mice (n=6) after injection with 5TGM1 MM cells compared to older animals (n=5). No difference in survival of myeloma-injected mice was obtained in groups with established memory cell pool (6 months old KaLwRj mice, n=9, vs. 1.5 years old KaLwRj mice, n=10). Significance was tested with the log-rank (Mantel-Cox) test. (F) Early accumulation of CD138+ plasma cells in the spleen of 10 weeks old Bl6 mice (n=8) at 3 weeks post Vk*MYC MM cell injection as compared to older animals (n=8), with median value of 1.99 in younger animals as compared to 0.78 in older mice. Significant difference was tested with two-tailed t-test, bars represent SD. (G) Faster abundance of monoclonal proteins (M-spike) in the blood of 10 weeks old Bl6 mice (n=10) at 3 weeks post Vk*MYC MM cell injection compared to 1.5 years old mice (n=10). QuickGel Split-Beta gels separate serum proteins by the classic electrophoresis zones with monoclonal proteins appearing as a specific band (M-spike). Gel has been cut from outside, no samples/bands are removed. Experiment was repeated twice with the same results, representative data from one experiment is shown.
Figure 4.
Figure 4.. Interferon type-1 target genes are significantly upregulated in patients compared to healthy donors.
(A) Mean T-sig2 and M-sig1 cell signature activity across samples, and mean expression of genes most highly weighted in these signatures. (B) tSNE representation of cells colored by IFI44L expression.
Figure 5.
Figure 5.. Dysregulation of MHC II in CD14+ monocytes in MM environment.
(A) Mean activity of MHC II gene signature (M-sig2) and mean expression of these genes across samples, grouped by stage of progression. Significance was tested by a BH-corrected two-tailed t-test with df=19.7 on n=30 patient samples with at least 10 CD14+ monocytes. (B) HLA-DR cell surface protein expression measured by CyTOF across samples. Significantly lower levels of HLA-DR molecules were observed on the surface of CD14+ monocytes/macrophages in patients (SMM and MM samples) as compared to healthy donors (NBM), with median value of 26.7 for NBM, 10.9 and 7.9 for SMM and MM samples respectively. Significant difference was tested with two-tailed t-test, bars representing SD. (C) Myeloma cells significantly downregulate surface representation of MHC II on CD14+ monocytes after direct co-culture. Human CD14+ monocytes were isolated from blood of healthy donors and co-cultured with CD19+ B cells or MM1.S and RPMI8226 (RPMI) myeloma cells. FACS analysis was performed on day 3 of co-culture. Median values for surface expression on CD14+ cells co-cultured with CD19+ cells or with RPMI cells in transwell or direct co-culture were 94.2, 60.4 and 31.3 for HLA-DR; 64.6, 35.9 and 1.7 for HLA-DP respectively. Median values of 97.0, 97.2 and 91.2 for HLA-DR; 75.8, 86.2 and 6.4 for HLA-DP were detected on the surface of CD14+ cells after similar experimental settings with MM1.S cells. The median proportion of CD14+ intracellularly expressing HLA-DR was 97.8, 96.4 and 98.0; 96.7, 95.9 and 96.0 for HLA-DP in co-culture with RPMI; 97.9, 98.6 and 91.9 for HLA-DR, 96.8, 97.8 and 90.9 for HLA-DP in co-culture with MM1.S cells respectively. Experiment was performed with three independent donors/2 different cell lines in triplicates. (Significance was derived from technical replicates, but different donors demonstrate similar loss of HLA-DR expression as compared to controls, t-test 2-sided; error bars indicate SD) (D) Immunofluorescence staining of tissue microarrays from MGUS patients demonstrates intracellular accumulation of HLA-DR (green) in CD14-expressing monocytes (red) as compared to membrane-bound localization of HLA-DR in healthy bone marrow monocytes (BM tissue microarrays of MGUS, SMM and MM patients (n=45, performed in triplicates, total of 135 BM sections, yellow arrows point on cells with HLA-DR localized to the cell membrane, white arrows point on cells with HLA-DR accumulated in the cytoplasm). (E) Upregulated MARCH-1 expression and decreased VAPA levels in CD14+ cells from BM of MM patients, compared to healthy donors. Violin plots show minimum, medium, and maximum values, and a BH-corrected two-tailed t-test was performed on n=27 patient samples with >=50 CD14+ monocytes.
Figure 6.
Figure 6.. CD14-expressing monocytes from myeloma environment can enhance proliferation of myeloma cells and suppress the T cell activation.
(A) Proportion of MM1.S cells in the G0, S- and G2M cell cycle phases assessed from frequency of myeloma cells that incorporated 5-bromo-2’-deoxyuridine (BrdU) into cellular DNA in presence of CD14+HLA-DRlow monocytes or B-cells. Median values for MM1.S cells in G0, S and G2M phase of cell cycle were 86.1, 9.3 and 4.6 for controls co-cultured with B-cells as compared to 62.4, 27.1 and 10.6 for co-culture with CD14+HLA-DRlow cells. Error bars indicate average deviation, representative data from one out of three independent experiments performed with three healthy donors. (B) Representative FACS profiles show distribution of MM cells in the different cell cycle phases. (C) Experimental design for T cell activation assay of CD14+ cells from MM environment. CD14+ cells isolated from PB of healthy donors were co-cultured with MM cell lines or healthy B-cells as a control. Next day, CD14+ cells were isolated from the MM co-culture and placed into culture with healthy PBMC. At day 5, activation of T cells was analyzed using FACS. (D) CD8+ T cells co-cultured with CD14+ cells pre-conditioned with RPMI myeloma cells show decreased levels of CD44 as compared to controls pre-cultured with B cells. Median fluorescence intensity for PBMC controls were 1.0 as compared to 0.98 for B cells, 0.85 for RPMI and 0.9 for OPM2 cells. (One-way ANOVA and Tukey multiple comparison tests were used to test significant differences between groups, statistics were derived from three independent experiments performed in duplicates, bars indicate SD). (E) Experimental design for T cell activation assay of CD14+ cells from SMM patients. CD14+ or B cells isolated from the BM of SMM patients were co-cultured with PBMC. At day 5, activation of T cells was analyzed using FACS. (F) CD4+ T cells co-cultured with CD14+ cells from SMM patients show decreased levels of CD44 as compared to controls. Median fluorescence intensity for PBMC controls were 1.0 as compared to 1.2 for B cells and 0.96 for CD14+ SMM cells. (One-way ANOVA and Tukey multiple comparison tests were used to test significant differences between groups, statistics were derived from three independent experiments performed in duplicates, bars indicate SD).

Comment in

References

    1. Kyle RA & Rajkumar SV Multiple myeloma. Blood 111, 2962–2972, doi:10.1182/blood-2007-10-078022 (2008). - DOI - PMC - PubMed
    1. Landgren O Monoclonal gammopathy of undetermined significance and smoldering multiple myeloma: biological insights and early treatment strategies. Hematology Am Soc Hematol Educ Program 2013, 478–487, doi:10.1182/asheducation-2013.1.478 (2013). - DOI - PubMed
    1. Rajkumar SV Multiple myeloma: 2011 update on diagnosis, risk-stratification, and management. Am J Hematol 86, 57–65, doi:10.1002/ajh.21913 (2011). - DOI - PubMed
    1. Kyle RA et al. Monoclonal gammopathy of undetermined significance (MGUS) and smoldering (asymptomatic) multiple myeloma: IMWG consensus perspectives risk factors for progression and guidelines for monitoring and management. Leukemia 24, 1121–1127, doi:10.1038/leu.2010.60 (2010). - DOI - PMC - PubMed
    1. Rajkumar SV et al. Serum free light chain ratio is an independent risk factor for progression in monoclonal gammopathy of undetermined significance. Blood 106, 812–817, doi:10.1182/blood-2005-03-1038 (2005). - DOI - PMC - PubMed

Publication types