. 2021 Oct;12(5):879-893.
doi: 10.1007/s12975-020-00878-x. Epub 2021 Jan 6.

Reparative System Arising from CCR2(+) Monocyte Conversion Attenuates Neuroinflammation Following Ischemic Stroke

Affiliations

Reparative System Arising from CCR2(+) Monocyte Conversion Attenuates Neuroinflammation Following Ischemic Stroke

Joohyun Park et al. Transl Stroke Res. 2021 Oct.

Abstract

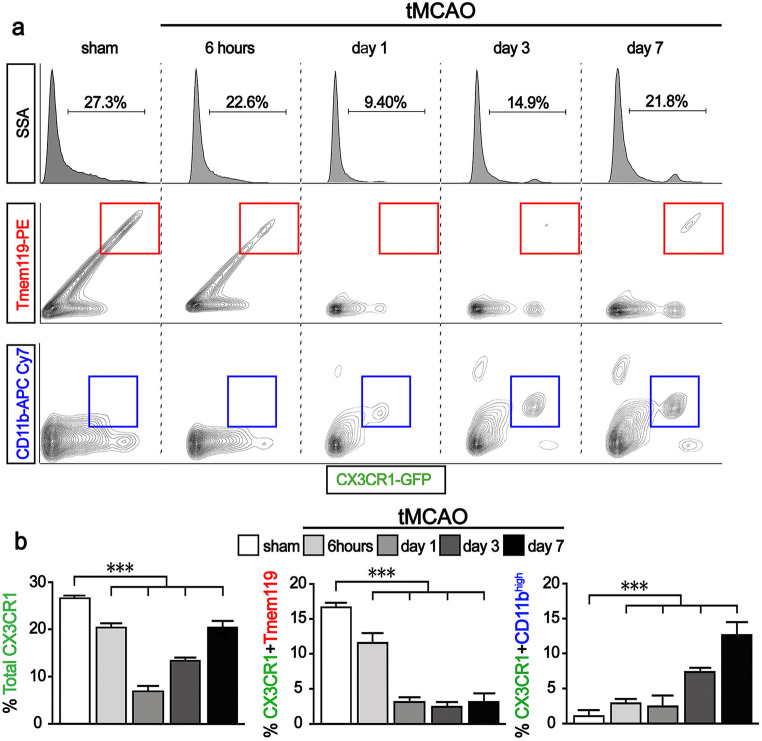
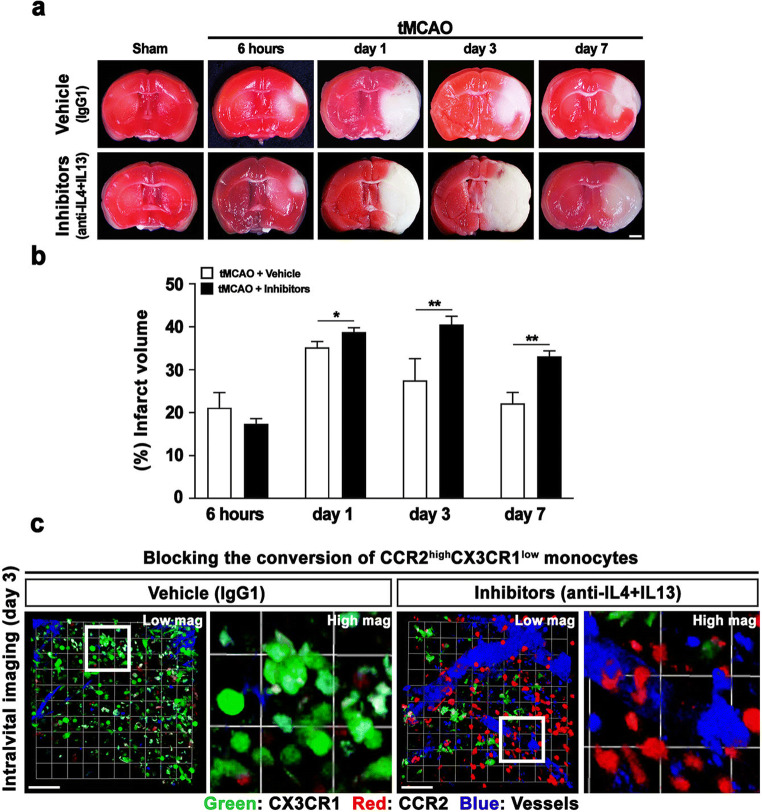
Monocytes recruitment from the blood to inflamed tissues following ischemic stroke is an important immune response to wound healing and tissue repair. Mouse monocytes can be endogenously divided into two distinct populations: pro-inflammatory or classical monocytes that express CCR2highCX3CR1low and circulate in blood, and anti-inflammatory or non-classical monocytes that express CCR2lowCX3CR1high and patrol locally. In this study of transgenic mice with functional CX3CR1GFP/+ or CX3CR1GFP/+-CCR2RFP/+, we found that CCR2highCX3CR1low monocytes recruited to the injured brain were cytokine-dependently converted into CCR2lowCX3CR1high macrophages, especially under the influence of IL-4 and IL-13, thereby attenuating the neuroinflammation following sterile ischemic stroke. The overall data suggest that (1) the regulation of monocyte-switching is one of the ultimate reparative strategies in ischemic stroke, and (2) the adaptation of monocytes in a locally inflamed milieu is vital to alleviating the effects of ischemic stroke through innate immunity.

Keywords: CCR2; CX3CR1; Macrophages; Monocytes conversion; Neuroinflammation ischemic stroke.


Conflict of interest statement

The authors declare that they have no competing interests.

Figures

Fig. 1
Fig. 1
The Iba1+, Tmem119, and CX3CR1+ cell levels were significantly elevated days 3 and 7 after ischemic stroke. a Illustrated TTC staining images of the ROI of the brain after ischemic stroke. Representative confocal images for ROI. Images were obtained from day 3 after ischemic stroke. Lens magnification, × 10 (tile scanning 10 × 10, blue box), × 30 (white box). Scale bar = 20 μm. b Captured images taken from sham to day 7 by two-photon microscope after ischemic stroke showing a gradual increase in CX3CR1(+) cells. High-magnification images of morphological alterations of GFP-expressing cells in a time-dependent manner. Blood vessels were labeled with Texas red dextran via the retro-orbital sinus. Scale bar = 20 μm. Lens magnification, × 20. c, e Images taken from sham to day 7 show a significant increase in Iba1, but a lack of Tmem119 expression. The expression of Iba1 and Tmem119 was detected by confocal microscope. Scale bar, 20 μm. Lens magnification, × 40. Data are representative of five independent experiments. d, f Quantitative analysis of relative fluorescence of Iba1- or Tmem119-expressing cells in a time-dependent manner after ischemic stroke. n = 5 mice per group independent experiments; error bars, mean ± SD (***p < 0.001, Bonferroni’s multiple comparison test)
Fig. 2
Fig. 2
The increased GFP-expressing CX3CR1(+) cells come from the blood-derived macrophages. a Flow cytometry analysis for distinguishing blood-derived macrophages (CX3CR1+, Tmem119, CD11bhigh) from microglia (CX3CR1+, Tmem119+, CD11bhigh). b Quantification of FACS analysis. Graphs shown are representative results from three different markers conjugated GFP, PE, and APC-CY, respectively. Data are presented as mean ± SD of at least five independent experiments (***p < 0.001, Bonferroni’s multiple comparison test)
Fig. 3
Fig. 3
Infiltrating CCR2highCX3CR1low blood-derived monocytes convert into CCR2lowCX3CR1high macrophages days 3 and 7 after ischemic stroke. a Immunofluorescent images showing CCR2(+) monocytes (red) located in the peri-infarctlesion of ischemic stroke using CX3CR1gfp/+-CCR2rfp/+ double-labeled functional transgenic mice. At days 3 and 7, CCR2(+) monocytes overexpress GFP, affecting morphological phenotypes. Scale bar = 20 μm. Lens magnification, × 40. b Quantitative analysis of infiltrating CCR2(+) cells. Data represent the mean ± SD of at least five independent experiments (*p < 0.05, **p < 0.01, ***p < 0.001, Bonferroni’s multiple comparison test). c Representative ex vivo brain images showing temporal changes in GFP or RFP epi-fluorescent intensity after ischemic stroke using CX3CR1GFP/+-CCR2RFP/+ double-labeled functional mice. d Quantitative analysis of fluorescence intensity in a time-dependent manner after ischemic stroke. Data represent the mean ± SD of five independent experiments (*p < 0.05, **p < 0.01, ***p < 0.001, Bonferroni’s multiple comparison test). e Time-lased intravital captured images showing the conversion of CCR2RFP/+ monocytes to CX3CR1-overexpressing macrophages day 3 after ischemic stroke. Scale bar (1 unit) = 5.3 μm. Lens magnification, × 20. f Quantitative analysis of fluorescence intensity of GFP and RFP over time after ischemic stroke
Fig. 4
Fig. 4
The induction of CCR2highCX3CR1low monocytes switching into CCR2lowCX3CR1high macrophages by cytokines IL-4 and IL-13. a Representative images of protein expression profiles obtained by comprehensive protein array in each group of brain tissues. Black squares on a dotted line indicate representative cytokines. b Quantification of representative cytokine levels after ischemic stroke in a time-dependent manner. Data represent the mean ± SD of three independent experiments (*p < 0.05, **p < 0.01, ***p < 0.001, Bonferroni’s multiple comparison test). c Representative immunocytochemical images of conversion of CCR2highCX3CR1low to CCR2lowCX3CR1high monocytes obtained by the confocal orthogonal projection technique after z-stack imaging. X-Z and Y-Z cross-sectional images show the co-localization of RFP and GFP. Comparative single-plane images of converted versus non-converted monocytes. Scale bar = 20 μm. Lens magnification, × 63. d Immunocytochemistry showing the conversion of isolated splenic monocytes. At days 3 to 7, the number of monocytes converted from CCR2highCX3CR1low monocytes to CCR2lowCX3CR1high (yellowish color) was significantly increased by cytokines IL-4 and IL-13 when compared to sham and LPS groups. Scale bar = 20 μm. Lens magnification, × 40. e Quantitative analysis of the intensity of GFP- or RFP-expressing monocytes in a time-dependent manner. Data represent the mean ± SD of at least five independent experiments (*p < 0.05, **p < 0.01, ***p < 0.001, Bonferroni’s multiple comparison test). f Representative real-time images from a CCR2RFP/+-CX3R1GFP/+ double-labeled splenic monocytes. Scale bars = 20 μm. Lens magnification, × 20. Representative monocyte conversion images from white squares of low magnification images. Magnification, × 80. g Quantification of live imaging analysis. Graphs shown are representative results as mean ± SD of at least five independent experiments
Fig. 5
Fig. 5
The treatment of IL-4 and IL-13 inhibitors affected the infarct volume and the CCR2(+) monocytes conversion into CX3CR1 macrophages after ischemic stroke. a Representative images showing the cerebral infarction by TTC staining, time-dependently. Scale bars = 2 mm. Lens magnification, × 4. b Quantitative analysis of cerebral infarct volume. Data are presented as mean ± SD of at least three independent experiments (*p < 0.05, **p < 0.01, unpaired t test). c Time-lapsed captured images obtained from intravital imaging showing the effects of inhibitors related with the CCR2(+) monocytes conversion (IgG1-treated vs Inhibitors-treated). Data are representative of three independent experiments. Scale bars = 20 μm. Lens magnification, × 20 (low mag.), × 64 (high mag.). Brain vessels shown in blue were stained with CF®405M-conjugated wheat germ agglutinin. CCR2 and CX3CR1 positive cells, which endogenously express RFP and GFP, were shown in red and green, respectively

References

    1. Moskowitz MA, Lo EH, Iadecola C. The science of stroke: mechanisms in search of treatments. Neuron. 2010;67(2):181–198. doi: 10.1016/j.neuron.2010.07.002. - DOI - PMC - PubMed
    1. Liu YZ, Wang C, Wang Q, Lin YZ, Ge YS, Li DM, Mao GS. Role of fractalkine/CX3CR1 signaling pathway in the recovery of neurological function after early ischemic stroke in a rat model. Life Sci. 2017;184:87–94. doi: 10.1016/j.lfs.2017.06.012. - DOI - PubMed
    1. Jin R, Yang G, Li G. Inflammatory mechanisms in ischemic stroke: role of inflammatory cells. J Leukoc Biol. 2010;87(5):779–789. doi: 10.1189/jlb.1109766. - DOI - PMC - PubMed
    1. Wang G, Zhang J, Hu X, Zhang L, Mao L, Jiang X, Liou AKF, Leak RK, Gao Y, Chen J. Microglia/macrophage polarization dynamics in white matter after traumatic brain injury. J Cereb Blood Flow Metab. 2013;33(12):1864–1874. doi: 10.1038/jcbfm.2013.146. - DOI - PMC - PubMed
    1. Kim JY, Park J, Chang JY, Kim SH, Lee JE. Inflammation after ischemic stroke: the role of leukocytes and glial cells. Exp Neurobiol. 2016;25(5):241–251. doi: 10.5607/en.2016.25.5.241. - DOI - PMC - PubMed

Publication types

LinkOut - more resources