. 2021 Jun;43(3):1405-1422.
doi: 10.1007/s11357-020-00305-x. Epub 2021 Jan 7.

Decreased parenchymal arteriolar tone uncouples vessel-to-neuronal communication in a mouse model of vascular cognitive impairment

Affiliations

Decreased parenchymal arteriolar tone uncouples vessel-to-neuronal communication in a mouse model of vascular cognitive impairment

Ki Jung Kim et al. Geroscience. 2021 Jun.

Abstract

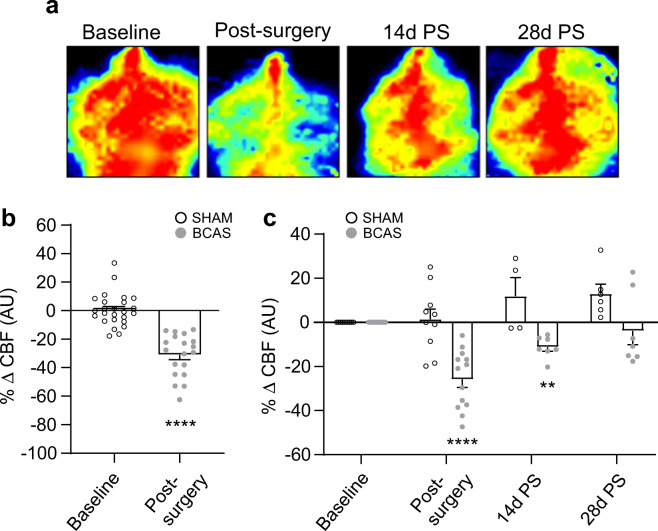
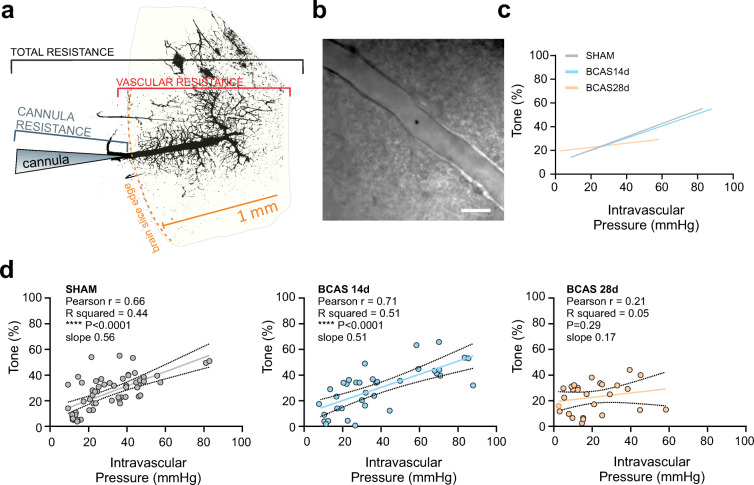
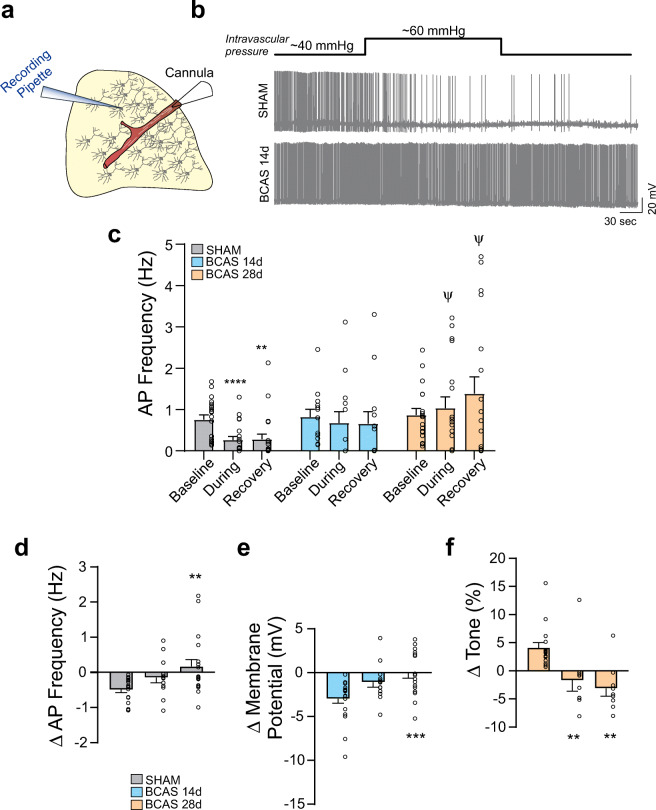
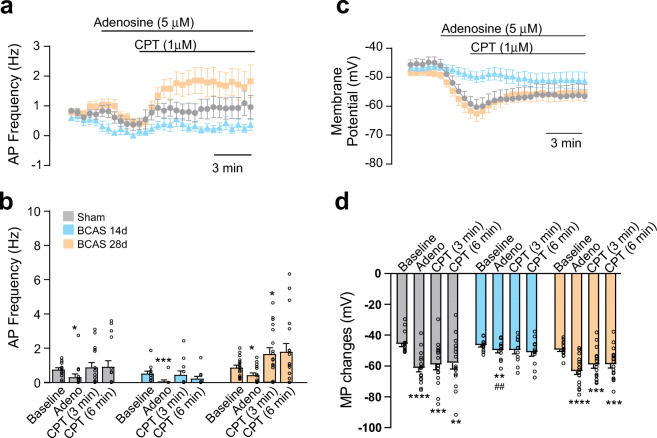
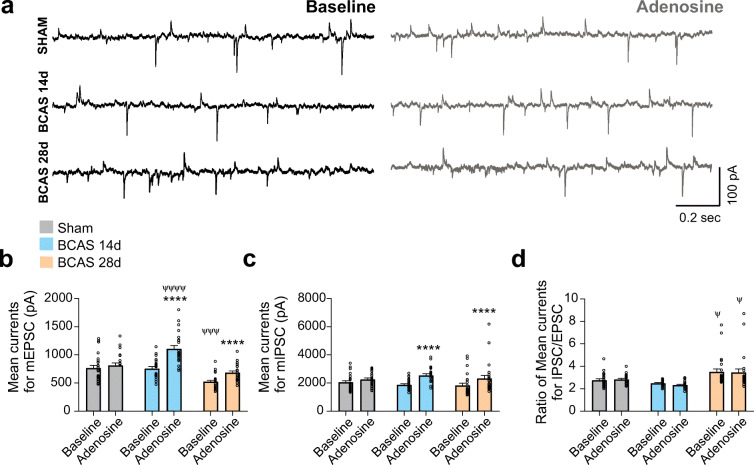
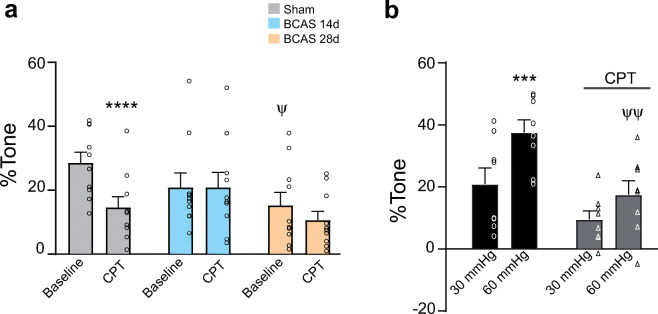
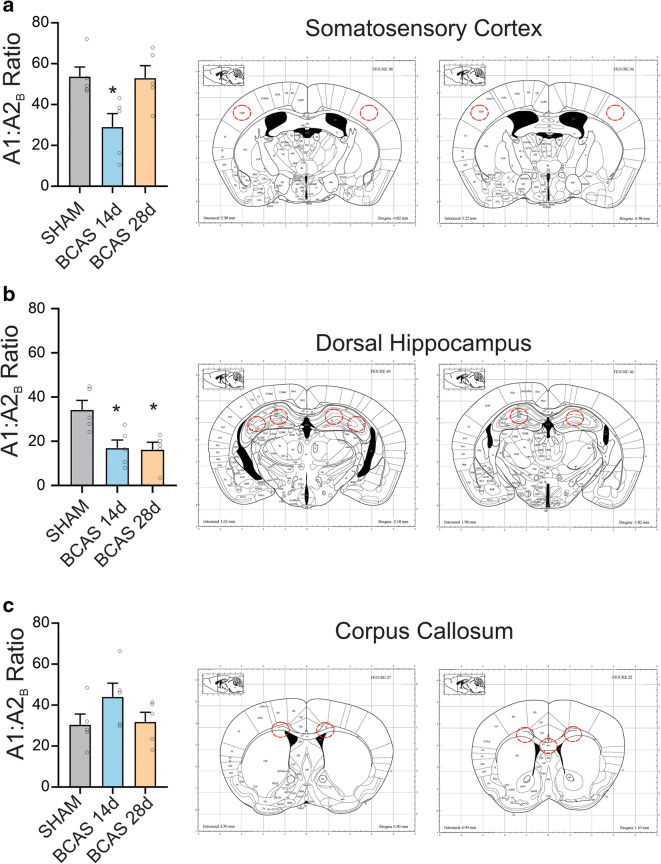
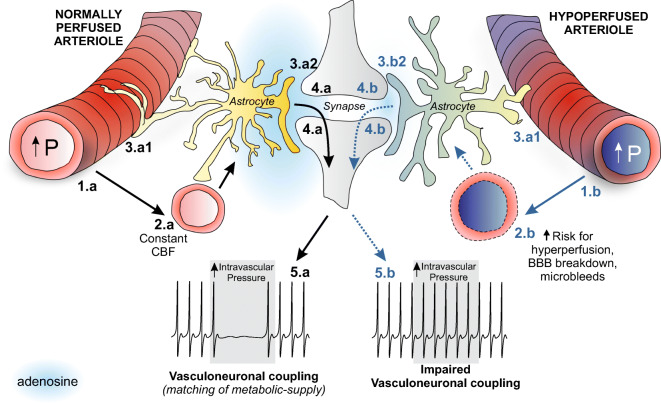
Chronic hypoperfusion is a key contributor to cognitive decline and neurodegenerative conditions, but the cellular mechanisms remain ill-defined. Using a multidisciplinary approach, we sought to elucidate chronic hypoperfusion-evoked functional changes at the neurovascular unit. We used bilateral common carotid artery stenosis (BCAS), a well-established model of vascular cognitive impairment, combined with an ex vivo preparation that allows pressurization of parenchymal arterioles in a brain slice. Our results demonstrate that mild (~ 30%), chronic hypoperfusion significantly altered the functional integrity of the cortical neurovascular unit. Although pial cerebral perfusion recovered over time, parenchymal arterioles progressively lost tone, exhibiting significant reductions by day 28 post-surgery. We provide supportive evidence for reduced adenosine 1 receptor-mediated vasoconstriction as a potential mechanism in the adaptive response underlying the reduced baseline tone in parenchymal arterioles. In addition, we show that in response to the neuromodulator adenosine, the action potential frequency of cortical pyramidal neurons was significantly reduced in all groups. However, a significant decrease in adenosine-induced hyperpolarization was observed in BCAS 14 days. At the microvascular level, constriction-induced inhibition of pyramidal neurons was significantly compromised in BCAS mice. Collectively, these results suggest that BCAS uncouples vessel-to-neuron communication-vasculo-neuronal coupling-a potential early event in cognitive decline.

Keywords: A1R; Adenosine; Hypoperfusion; Myogenic tone; Neurovascular unit.


Figures

Fig. 1
Fig. 1
BCAS surgery-induced changes in CBF. a Temporal laser Doppler scan images at baseline (prior to BCAS surgery), immediately post-surgery (PS), and 14 or 28 days PS. b CBF measured in sham and BCAS mice at baseline and immediately PS (n = 25 for sham and n = 19 for BCAS). c CBF measured in sham and BCAS mice at baseline, immediately PS (n = 10 for sham and BCAS), and 14 days (n = 4/10 for sham/BCAS) or 28 days PS (n = 6/7 for sham/BCAS). CBF values are presented as means ± SEM, expressed as a percentage of baseline (#P < 0.05, sham versus baseline; ****P < 0.0001 BCAS versus baseline; mixed-effects model repeated-measures ANOVA followed by Dunnett’s multiple comparison test)
Fig. 2
Fig. 2
BCAS-driven changes in parenchymal arteriolar tone. a Components of the brain slice cannulation technique that define the elements that contribute to the total resistance of the system: cannula resistance and vascular resistance (resistance of the perfused network downstream from the cannulated parenchymal arteriole). The binary image corresponds to a cannulated arteriole labeled with FITC (post-experiment) to define the downstream vascular network. b Representative differential interference contrast image of a cannulated parenchymal arteriole in a brain slice. c Averaged linear regression line for the intravascular pressure-versus-tone (%) relationship for sham (n = 15 vessels from 11 mice), BCAS 14 d (n = 9 vessels from 6 mice), and BCAS 28 d (n = 10 vessels from 8 mice) groups. d Intravascular pressure-versus-tone (%) responses for each experimental group shown in c
Fig. 3
Fig. 3
BCAS-induced impairments in VNC. a Illustration of a pressurized brain slice preparation showing the position of the cannulated arteriole relative to the recorded pyramidal neuron (typically < 100 μm). b Representative membrane potential traces showing the response of a pyramidal neuron to an increase in intravascular pressure from ~ 40 to 60 mmHg. c Summary data showing AP frequency in response to increases in intravascular pressure within a nearby parenchymal arteriole (sham, n = 20 neurons from 6 mice; BCAS 14 d, n = 13 neurons from 3 mice; BCAS 28 d, n = 18 neurons from 4 mice). Data are presented as means ± SEM (**P < 0.01 versus baseline for within-group comparisons; ψP < 0.05 versus sham for between-group comparisons; two-way repeated-measures ANOVA followed by Dunnett’s multiple comparison test). d Summary data showing the change (Δ) in AP frequency, e membrane potential (mV), and f tone in response to an increase in intravascular pressure within a nearby parenchymal arteriole in sham (n = 16 arterioles from 6 mice), BCAS 14 d (n = 9 arterioles from 3 mice) and BCAS 28 d (n = 9 arterioles from 4 mice) groups. Data are presented as means ± SEM (**P < 0.01, ***P < 0.001 versus baseline; two-way repeated-measures ANOVA followed by Kruskal-Wallis test)
Fig. 4
Fig. 4
Adenosine-evoked changes in pyramidal neuron activity in sham and BCAS mice. a Average AP frequency in response to bath-applied adenosine followed by the A1R blocker, CPT. b Summary data showing AP frequency in sham (n = 16 neurons from 5 mice), BCAS 14 d (n = 12 neurons from 4 mice), and BCAS 28 d (n = 18 neurons from 4 mice) groups. c Average membrane potential (mV) changes in response to bath-applied adenosine followed by the A1R blocker, CPT (same neurons as in a, b). d Summary data showing membrane potential changes in sham, BCAS 14 d, and BCAS 28 d groups (same neurons as in a, b). Data are presented as means ± SEM (*P < 0.05, ***P < 0.001 versus baseline; two-way repeated-measures ANOVA followed by Dunnett’s multiple comparison test)
Fig. 5
Fig. 5
Adenosine-evoked changes in pyramidal neuron activity: excitatory and inhibitory currents. a Representative traces of miniature EPSCs and IPSCs at baseline (left) and in the same neuron in response to bath-applied adenosine (right) under voltage-clamp conditions. b Average mean EPSC currents, c IPSC currents, and d IPSC/EPSC ratios for all groups (sham, n = 24 neurons from 4 mice; BCAS 14 d, n = 24 neurons from 4 mice; BCAS 28 d, n = 24 neurons from 4 mice). Data are presented as means ± SEM (****P < 0.0001 for within-group comparisons; two-way repeated-measures ANOVA followed by Sidak’s test; ψψψP = 0.0001, ψP < 0.05 for between-group comparisons; two-way repeated-measures ANOVA followed by or Dunnett’s multiple comparison test)
Fig. 6
Fig. 6
Adenosine-evoked parenchymal arteriole responses. a Effects of A1R blockade with CPT on parenchymal arteriolar tone (sham, n = 10 vessels from 6 mice; BCAS 14 d, n = 9 vessels from 5 mice; BCAS 28 d, n = 10 vessels from 4 mice). b Parenchymal arteriole responses to an increase in intravascular pressure in the absence and presence of CPT (n = 8 vessels from 4 mice). Data are presented as means ± SEM (*P < 0.05, **P < 0.01, ***P < 0.001 ****P < 0.0001 for within-group comparisons, two-way repeated-measures ANOVA followed by Sidak’st test; ψψP < 0.005 for between-group comparisons, two-way repeated-measures ANOVA followed by Dunnett’s multiple comparison test)
Fig. 7
Fig. 7
Reduced A1R to A2BR mRNA ratio in BCAS 14 d. Summary of the mean fold change in mRNA expression of A1R relative to A2BR in Sham, BCAS 14 d, and BCAS 28 d groups (n = 5 mice per group). Schematics to the right show the corresponding brain regions from where brain punches were obtained (modified from Paxinos mouse atlas). Data are presented as mean ± SEM (*P < 0.05 versus sham, one-way ANOVA followed by Tukey’s multiple comparison test)
Fig. 8
Fig. 8
Working model for impaired vasculo-neuronal coupling in BCAS. We predict that in a normally perfused neurovascular unit (NVU), an increase in intravascular pressure (1.a) will cause parenchymal arteriolar constriction. The resulting biomechanical stimulation at the NVU (i.e., mediated via increased tone) triggers an increase in astrocyte Ca2+ (2.a) and release of ATP/adenosine both at the gliovascular interface (3.a1) as well as the synapse (3.a2). A1R activation on parenchymal arterioles contributes to the maintenance of myogenic constriction. At the synapse, A1R activation causes suppression of neuronal activity (4.a). Thus, the increased parenchymal arteriolar constriction, which would decrease downstream blood flow, suppresses neuronal activity to keep metabolic demands and supply in balance (5.a). On the other hand, in a hypoperfused NVU, the increase in intravascular pressure fails to induce myogenic constriction and consequent biomechanical stimulation on astrocytes (1.b), increasing the risk for hyperperfusion, breakdown of the blood-brain barrier (BBB), and microbleeds. Furthermore, blunted biomechanics at the NVU (i.e., due to lack of tone) (2.b) along with a potential decrease in A1R-mediated signaling (3b1, 3b2) fails to decrease neuronal activity (4.b), increasing the risk for unbalanced metabolic demands and supply (5.b)

Similar articles

Cited by

References

    1. D’Haeseleer M, Beelen R, Fierens Y, Cambron M, Vanbinst AM, Verborgh C, et al. Cerebral hypoperfusion in multiple sclerosis is reversible and mediated by endothelin-1. Proc Natl Acad Sci U S A. 2013;110(14):5654–5658. - PMC - PubMed
    1. Hostenbach S, Pauwels A, Michiels V, Raeymaekers H, Van Binst AM, Van Merhaeghen-Wieleman A, et al. Role of cerebral hypoperfusion in multiple sclerosis (ROCHIMS): study protocol for a proof-of-concept randomized controlled trial with bosentan. Trials. 2019;20(1):164. - PMC - PubMed
    1. Fernandez-Seara MA, Mengual E, Vidorreta M, Aznarez-Sanado M, Loayza FR, Villagra F, et al. Cortical hypoperfusion in Parkinson’s disease assessed using arterial spin labeled perfusion MRI. Neuroimage. 2012;59(3):2743–2750. - PubMed
    1. de la Torre JC. Cerebral hemodynamics and vascular risk factors: setting the stage for Alzheimer’s disease. J Alzheimers Dis. 2012;32(3):553–567. - PubMed
    1. de la Torre JC. Vascular risk factors: a ticking time bomb to Alzheimer’s disease. Am J Alzheimers Dis Other Dement. 2013;28(6):551–559. - PMC - PubMed

Publication types

LinkOut - more resources