. 2021 Apr;18(2):1207-1225.
doi: 10.1007/s13311-020-00969-5. Epub 2021 Jan 6.

A Novel Second-Generation EP2 Receptor Antagonist Reduces Neuroinflammation and Gliosis After Status Epilepticus in Rats

Affiliations

A Novel Second-Generation EP2 Receptor Antagonist Reduces Neuroinflammation and Gliosis After Status Epilepticus in Rats

Asheebo Rojas et al. Neurotherapeutics. 2021 Apr.

Abstract

Prostaglandin-E2 (PGE2), an important mediator of inflammation, achieves its functions via four different G protein-coupled receptors (EP1, EP2, EP3, and EP4). We previously demonstrated that the EP2 receptor plays a proinflammatory and neurodegenerative role after status epilepticus (SE). We recently developed TG8-260 as a second-generation highly potent and selective EP2 antagonist. Here, we investigate whether TG8-260 is anti-inflammatory and combats neuropathology caused by pilocarpine-induced SE in rats. Adult male Sprague-Dawley rats were injected subcutaneously with pilocarpine (380-400 mg/kg) to induce SE. Following 60 min of SE, the rats were administered three doses of TG8-260 or vehicle and were allowed to recover. Neurodegeneration, neuroinflammation, gliosis, and blood-brain barrier (BBB) integrity were examined 4 days after SE. The results confirmed that pilocarpine-induced SE results in hippocampal neurodegeneration and a robust inflammatory response that persists days after SE. Furthermore, inhibition of the EP2 receptor by TG8-260 administered beginning 2 h after SE significantly reduced hippocampal neuroinflammation and gliosis but, in distinction to the earlier generation EP2 antagonist, did not mitigate neuronal injury or BBB breakdown. Thus, attenuation of neuroinflammation and gliosis is a common feature of EP2 inhibition following SE.

Keywords: BBB.; COX-2; EP2; PGE2; Pilocarpine; TG8-260; gliosis; hippocampus; inflammation; neurodegeneration; status epilepticus.


Figures

Fig. 1
Fig. 1
Prolonged neuronal activation induced by pilocarpine. (A) Experimental paradigm of chemical administration in a rat model of pilocarpine-induced status epilepticus. (B) Fluorescent images taken from the hippocampus (50× magnification) that reveal positive ΔFosb staining in neurons in rats that experienced SE 24 h earlier but not in rats that did not experience status epilepticus. (C) ΔFosb induction is also prominent 24 h after SE onset in the amygdala and piriform cortex (PC), but not in rats that did not experience SE. The images shown are representative of five sections each from at least three rats. Scale bar, 500 μm
Fig. 2
Fig. 2
Inflammatory mediators 24 h following pilocarpine-induced SE. (A) Experimental paradigm of chemical administration in a rat model of pilocarpine-induced status epilepticus. (B) Rats were injected with pilocarpine to induce SE for 1.5 h and were euthanized 24 h later. qPCR was performed to determine the quantity of gene products. Shown is a plot of the mRNA fold change for 63 inflammation-related genes in non-seizure control rats administered saline (blue squares) and rats that experienced SE following pilocarpine administration (red circles). The genes are arranged on the y-axis according to gene expression change after pilocarpine from lowest (top) to highest (bottom). The dashed lines represent the approximate boundaries for differentially expressed downregulated and upregulated mRNAs. Arrows indicate key inflammatory mediators investigated by qRT-PCR 4 days after SE as shown in Fig. 6A. Each symbol represents an individual rat
Fig. 3
Fig. 3
TG8-260 modulates LPS induced inflammation in the BV2-hEP2 cell line. Shown are the mean fold change in mRNA expression of a small panel of inflammatory mediators in BV2-hEP2 cells upon treatment with lipopolysaccharide (LPS, 100 ng/ml), the EP2 agonist ONO-AE1-259-01 (30 nM) and TG8-260 (0.3 or 1 μM). BV2-hEP2 were seeded at 200,000 cells/well and incubated overnight. The cultures were treated in duplicate with vehicle, TG8-260 or ONO-AE1-259-01 for 1 h and then LPS or its vehicle were added for an additional 2 h. Analyte mRNAs were measured by qRT-PCR (see Table 3 for primer sequences). Although fold changes are shown in the figure, ΔΔCT values were used for statistical analysis as they are normally distributed. Differences in chemical treatment were analyzed by repeated measures ANOVA-with post hoc Holm-Sidak multiple comparisons test. * = p < .05, ** = p < .01. The experiment was repeated with five independent cultures of different passages. Data are mean ± standard error of the mean
Fig. 4
Fig. 4
Pharmacokinetics of TG8-260. (A) the plasma and brain levels of TG8-260 in adult female C57BL/6 mice that received TG8-260 in the vehicle 5% NMP, 5% solutol-HS15, 90% saline (mean ± standard error of the mean, n = 3 mice) (single dose, 20 mg/kg, i.p.). More than a 7-fold plasma concentration above the KB value was attained at 24 h. (B) brain and plasma levels of TG8-260 in saline and pilocarpine-induced SE rats. TG8-260 (25 mg/kg, i.p.) dissolved in the vehicle 5% NMP, 5% solutol-HS15, 90% saline was administered 1 h after saline or termination of pilocarpine-induced SE by diazepam, and whole blood and brain was collected 6 h later. n = 6 rats for saline and 7 rats for pilocarpine-SE. Data are mean ± standard error of the mean. The amount of TG8-260 present in the samples was quantified by LC-MS/MS analysis. The concentration of TG8-260 in the brain of SE rats is 2-fold higher than control rats
Fig. 5
Fig. 5
TG8-260 attenuates hippocampal neuroinflammation. (A) Experimental paradigm of chemical administration in rats. (B) The mean difference between vehicle and TG8-260 is shown in the Gardner-Altman estimation plots. Both groups are plotted on the left axes; the mean difference is plotted on a floating axis on the right as a bootstrap sampling distribution. The mean difference is depicted as a black circle; the 95% confidence interval is indicated by the ends of the vertical bar. The change in abundance of 10 inflammatory mediator mRNAs from the hippocampus of rats 4 days after injection with pilocarpine to induce status epilepticus is shown. Post-SE treatment was three doses of TG8-260 (n = 9 rats) or vehicle (n = 9 rats). Following pilocarpine-induced SE, the mRNA fold change for all 10 mediators as a group was significantly reduced by TG8-260 compared to vehicle (p = .00002, paired t test on ΔΔCT values). Data are mean ± SEM. The other five inflammatory mediators that are not labeled in the figure are: IL-1β, IL-6, IL-15, TNFα, and COX-2. (C) Change in mRNA abundance of CCL3 mRNA in the hippocampus of rats administered TG8-260 or vehicle after pilocarpine-induced SE (p = .01, t test using ΔΔCT values). Each symbol represents a single rat
Fig. 6
Fig. 6
Pilocarpine-induced CCL3 upregulation in microglia. Representative fluorescence images showing negative CCL3 immunostaining in the hippocampal CA1 (A) and CA3 (B) region of rats that did not experience SE. Positive CCL3 staining was detected in microglia in the CA1 (C) and CA3 (D) regions of the hippocampus 24 h after pilocarpine-induced SE. The dashed lines represent the principal cell layers in the CA1 and CA3 regions. The arrows indicate typical positive CCL3 staining. Scale bar is 40 μm (AD). S. radiatum = stratum radiatum. Positive CCL3 staining was detected in CD11b expressing microglia in the amygdala region (E) 24 h after pilocarpine-induced SE. The arrows and arrowheads indicate typical positive CCL3 and CD11b staining. Scale bar is 10 μm in (E)
Fig. 7
Fig. 7
TG8-260 reduces COX-2 induction in principal neurons following pilocarpine. Fluorescent images taken from the CA3 and CA1 regions in the hippocampus, the amygdala and parietal cortex (50× magnification) reveal basal expression of neuronal COX-2 in rats that did not experience status epilepticus (A) and prominent COX-2 staining (green) in rats 24 h after pilocarpine-induced SE (B). The images shown are representative of five sections each from three rats. Scale bar, 50 μm. (C) Western blot of COX-2 protein levels (bands in the top box) on day 4 in the cortex of rats that experienced SE induced by pilocarpine followed by administration of TG8-260 or vehicle. The bands in the lower box show the level of β-Actin from the same samples used as a loading control. Each lane represents an individual rat and five rats were chosen as representatives of the group. (D) The band intensity of COX-2 was normalized to the housekeeping β-Actin for each sample. The symbols represent each individual rat within the group. Data are mean ± standard error of the mean. p = .03, t test comparing pilocarpine-SE vehicle–treated rats to SE rats administered TG8-260
Fig. 8
Fig. 8
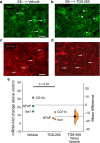
TG8-260 blunts hippocampal microgliosis. Representative fluorescence images (100× total magnification) taken from the hippocampal CA3 region showing positive Iba1 immunostaining (green) as a microglial marker in vehicle (A) and TG8-260 (B) injected rats 4 days after pilocarpine-induced SE as well as GFAP immunostaining (red) as an astrocyte marker in vehicle (C) and TG8-260 (D) injected rats. Four days after pilocarpine-induced status epilepticus, microgliosis was obvious in the sections obtained from rats administered vehicle as defined by the increased size of the cell body and amoeboid appearance (short and thick processes). The arrows in panel A indicate typical activated microglia. The arrowheads in panel B indicate typical resting microglia. Astrogliosis was not as obvious. The arrows in panels C and D indicate typical resting astrocytes. Scale bar, 20 μm. (E) the mean difference between vehicle and TG8-260 is shown in the Gardner-Altman estimation plot. The mean difference is plotted on a floating axis on the right as a bootstrap sampling distribution. Change in abundance of three glial marker mRNAs from the hippocampus of rats 4 days after injection with pilocarpine to induce status epilepticus. Post-SE treatment was three doses of TG8-260 (n = 9 rats) or vehicle (n = 9 rats). Following pilocarpine-induced status epilepticus, the mRNA fold change for the three glial markers as a group was significantly reduced by TG8-260 compared to vehicle (p = .02, paired t test on fold change values). The symbols are the average fold change of 9 rats for each glial marker
Fig. 9
Fig. 9
Neurodegeneration following pilocarpine-induced status epilepticus. Representative images of FluoroJade B staining in hippocampal sections (40 μm) in the hilus, CA1 and CA3 regions for rats treated with vehicle (A) 4 days after pilocarpine-induced status epilepticus and rats injected with three doses of TG8-260 (B). Images were taken at a total magnification of × 50. The images are representative of 8 sections per rat. Scale bar, 100 μm. The mean difference in the number of injured neurons between vehicle and TG8-260 treated rats that experienced pilocarpine-induiced SE is shown in the Gardner-Altman estimation plots for FluoroJade B positive cells (FJB+) in the hilus (C), CA1 (D), and CA3 (E). In each plot both groups are plotted on the left axes; the mean difference is plotted on a floating axes on the right as a bootstrap sampling distribution. The mean difference is depicted as a dot; the 95% confidence interval is indicated by the ends of the vertical bar
Fig. 10
Fig. 10
Blood–brain barrier leakiness is unaffected by TG8-260. (A) the amount of serum albumin in the cortex 4 days after SE was used to assess the integrity of the blood–brain barrier as all rats were perfused with sterile saline to remove blood from the brain. The albumin levels (black bands, below) in the cortex of non-seizure controls or rats that experienced 60 min of SE induced by pilocarpine that received TG8-260 (25 mg/kg, i.p.) or the vehicle (5% NMP, 5% solutol-HS15 and 90% saline) at 2, 8 and 20 h after SE onset were measured by western blot with β-actin (bottom bands) used as a loading control. (B) the band intensity of the albumin was normalized to the housekeeping β-actin. The albumin level was similar for TG8-260 and vehicle-treated rats after SE [171 ± 40% of control for vehicle-treated rats (n = 9) versus 221 ± 55% of control for TG8-260 injected rats (n = 9)]. The data are mean ± standard error of the mean. The symbols represent each individual rat within the group. p > 0.05, one-way ANOVA with post hoc Bonferroni test with selected pairs (comparing pilocarpine-vehicle vs pilocarpine-TG8-260)

Similar articles

Cited by

References

    1. Jiang J, Ganesh T, Du Y, Quan Y, Serrano G, Qui M, et al. Small molecule antagonist reveals seizure-induced mediation of neuronal injury by prostaglandin E2 receptor subtype EP2. Proc Natl Acad Sci U S A. 2012;109(8):3149–54. doi: 10.1073/pnas.1120195109. - DOI - PMC - PubMed
    1. Jiang J, Quan Y, Ganesh T, Pouliot WA, Dudek FE, Dingledine R. Inhibition of the prostaglandin receptor EP2 following status epilepticus reduces delayed mortality and brain inflammation. Proc Natl Acad Sci U S A. 2013;110(9):3591–6. doi: 10.1073/pnas.1218498110. - DOI - PMC - PubMed
    1. Jiang J, Yang MS, Quan Y, Gueorguieva P, Ganesh T, Dingledine R. Therapeutic window for cyclooxygenase-2 related anti-inflammatory therapy after status epilepticus. Neurobiol Dis. 2015;76:126–36. doi: 10.1016/j.nbd.2014.12.032. - DOI - PMC - PubMed
    1. Rojas A, Ganesh T, Lelutiu N, Gueorguieva P, Dingledine R. Inhibition of the prostaglandin EP2 receptor is neuroprotective and accelerates functional recovery in a rat model of organophosphorus induced status epilepticus. Neuropharmacology. 2015;93:15–27. doi: 10.1016/j.neuropharm.2015.01.017. - DOI - PMC - PubMed
    1. Rojas A, Ganesh T, Manji Z, O'Neill T, Dingledine R. Inhibition of the prostaglandin E2 receptor EP2 prevents status epilepticus-induced deficits in the novel object recognition task in rats. Neuropharmacology. 2016;110(Pt A):419–30. doi: 10.1016/j.neuropharm.2016.07.028. - DOI - PMC - PubMed

Publication types

MeSH terms

Substances