

Mechanistic Modeling of SARS-CoV-2 and Other Infectious Diseases and the Effects of Therapeutics
- PMID: 33410134
- PMCID: PMC8142935
- DOI: 10.1002/cpt.2160
Mechanistic Modeling of SARS-CoV-2 and Other Infectious Diseases and the Effects of Therapeutics
Abstract
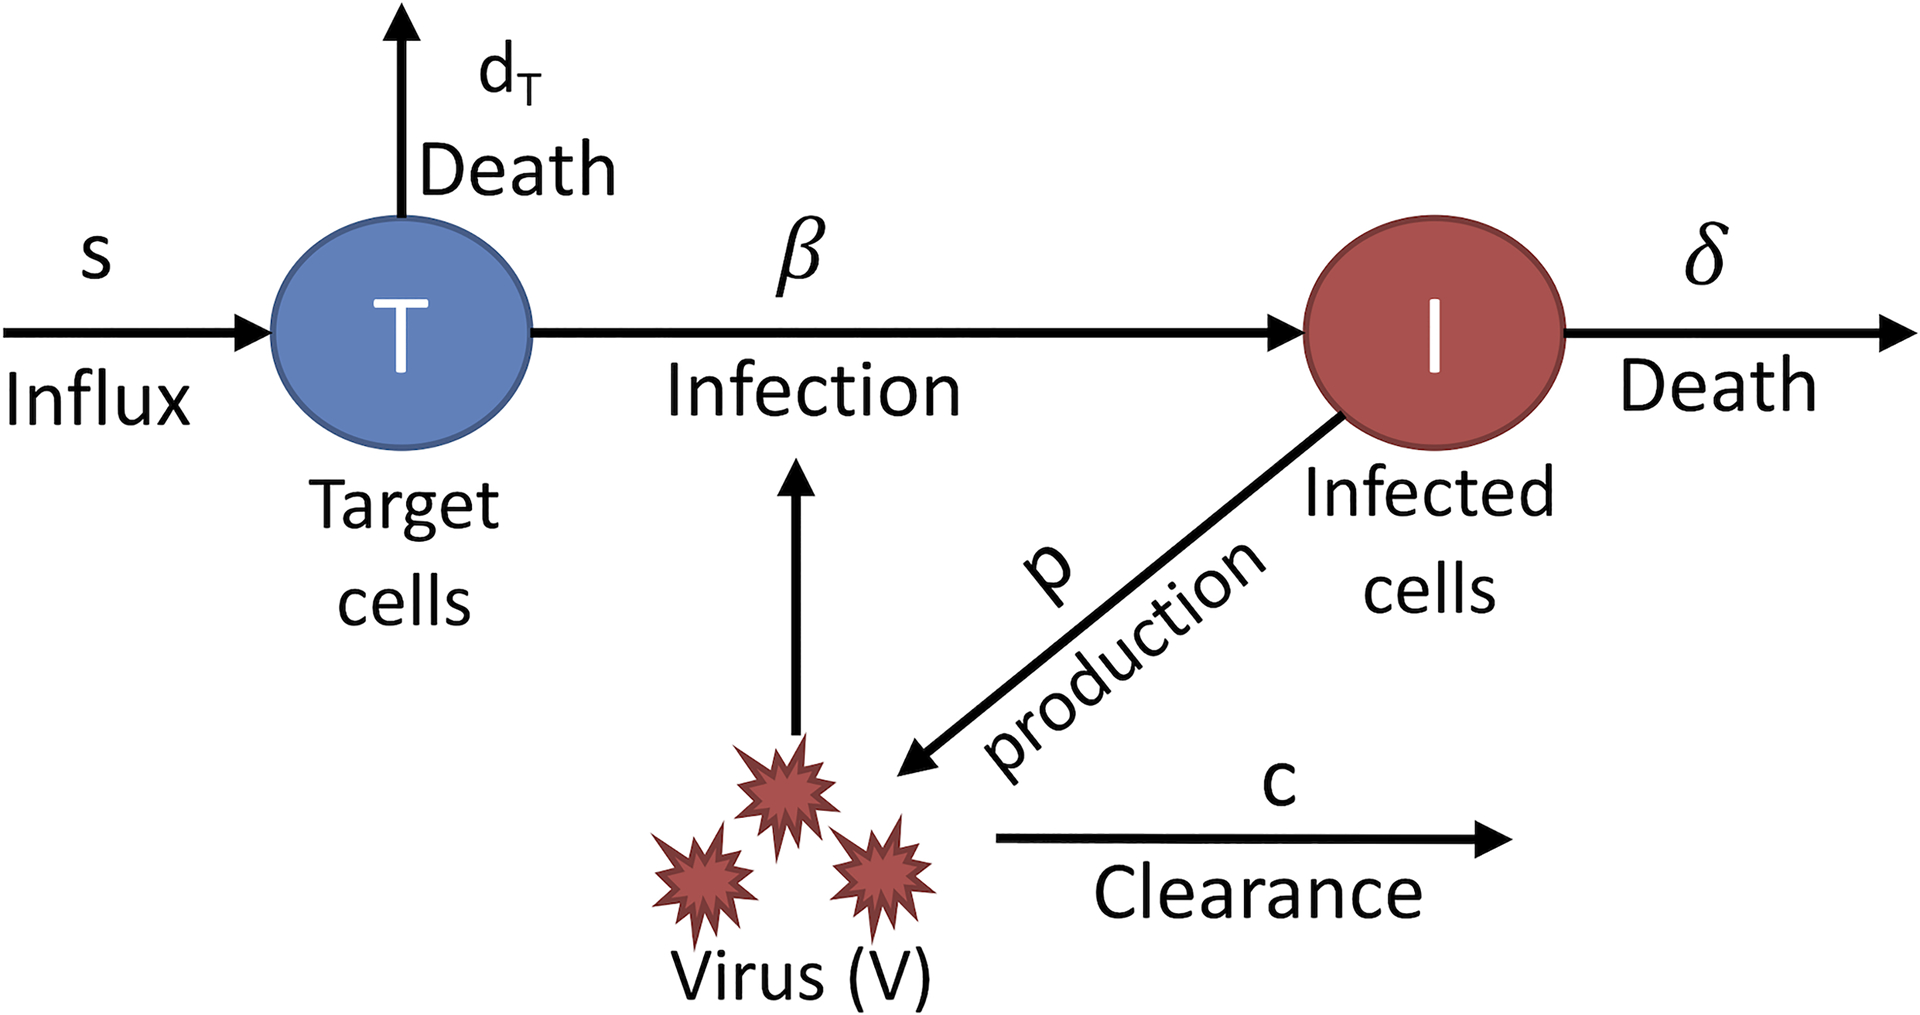
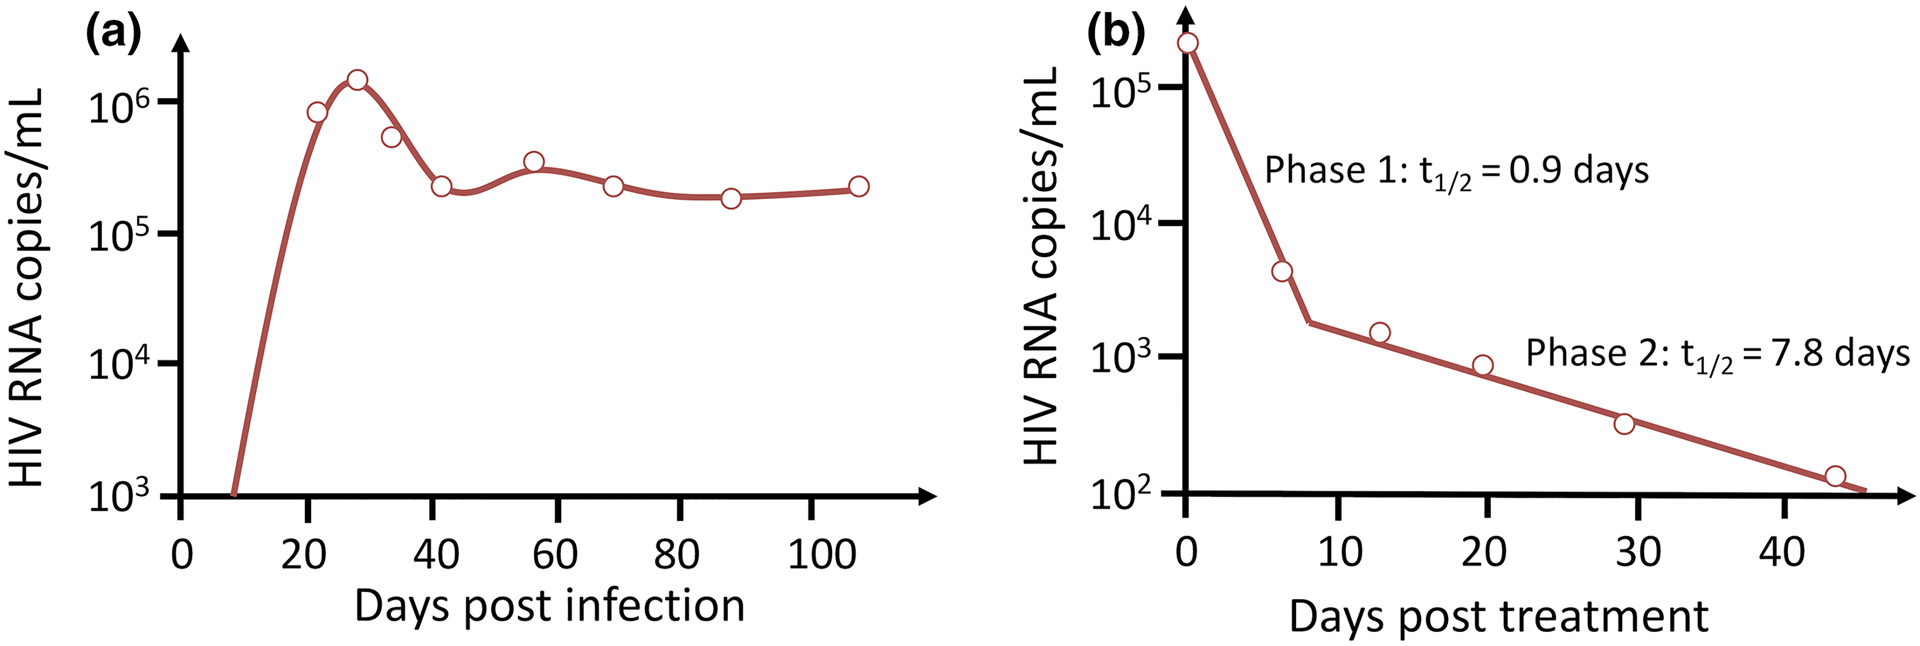
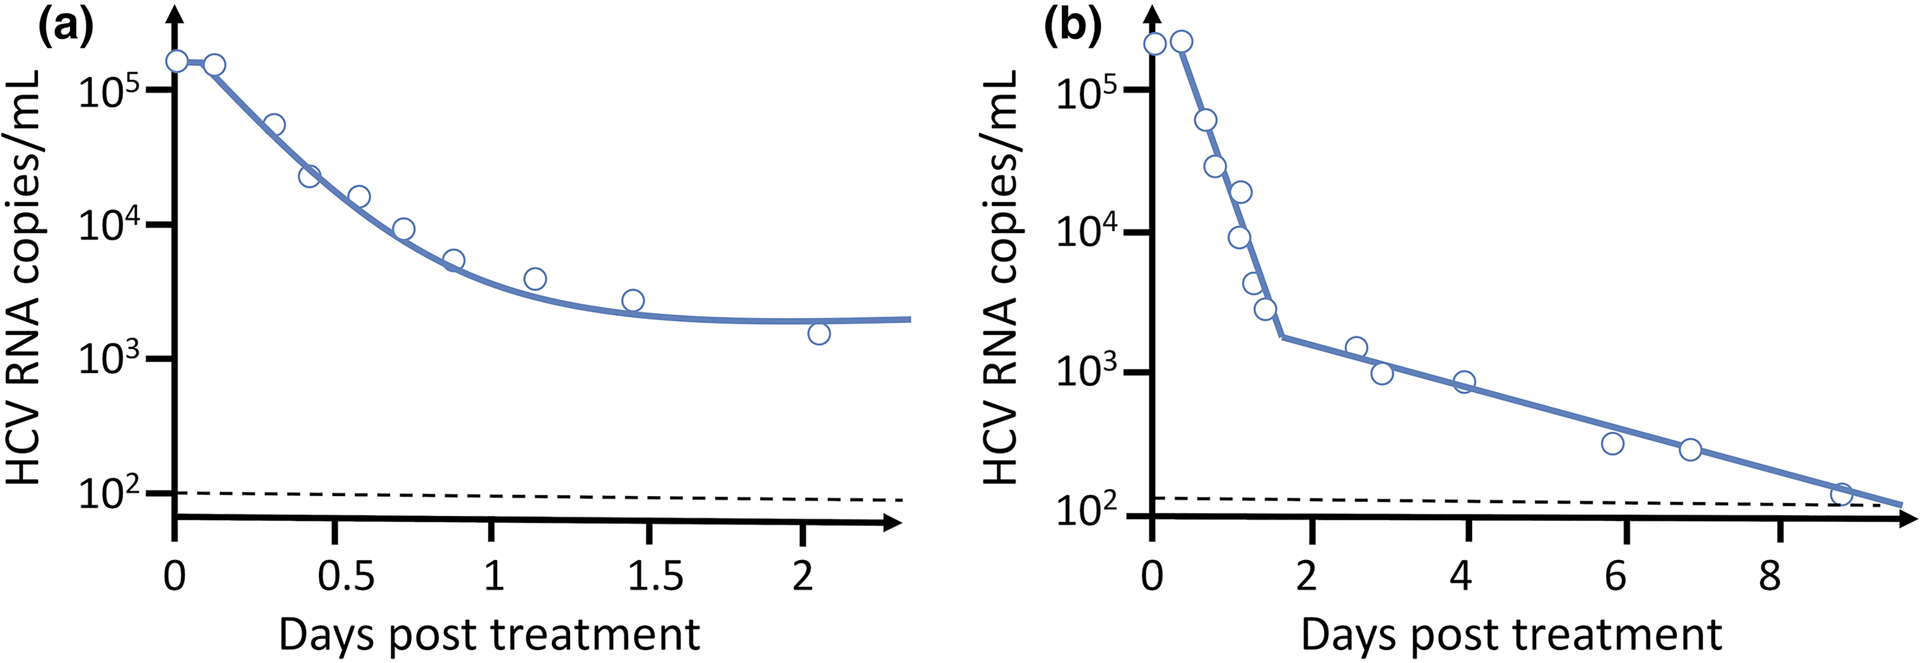
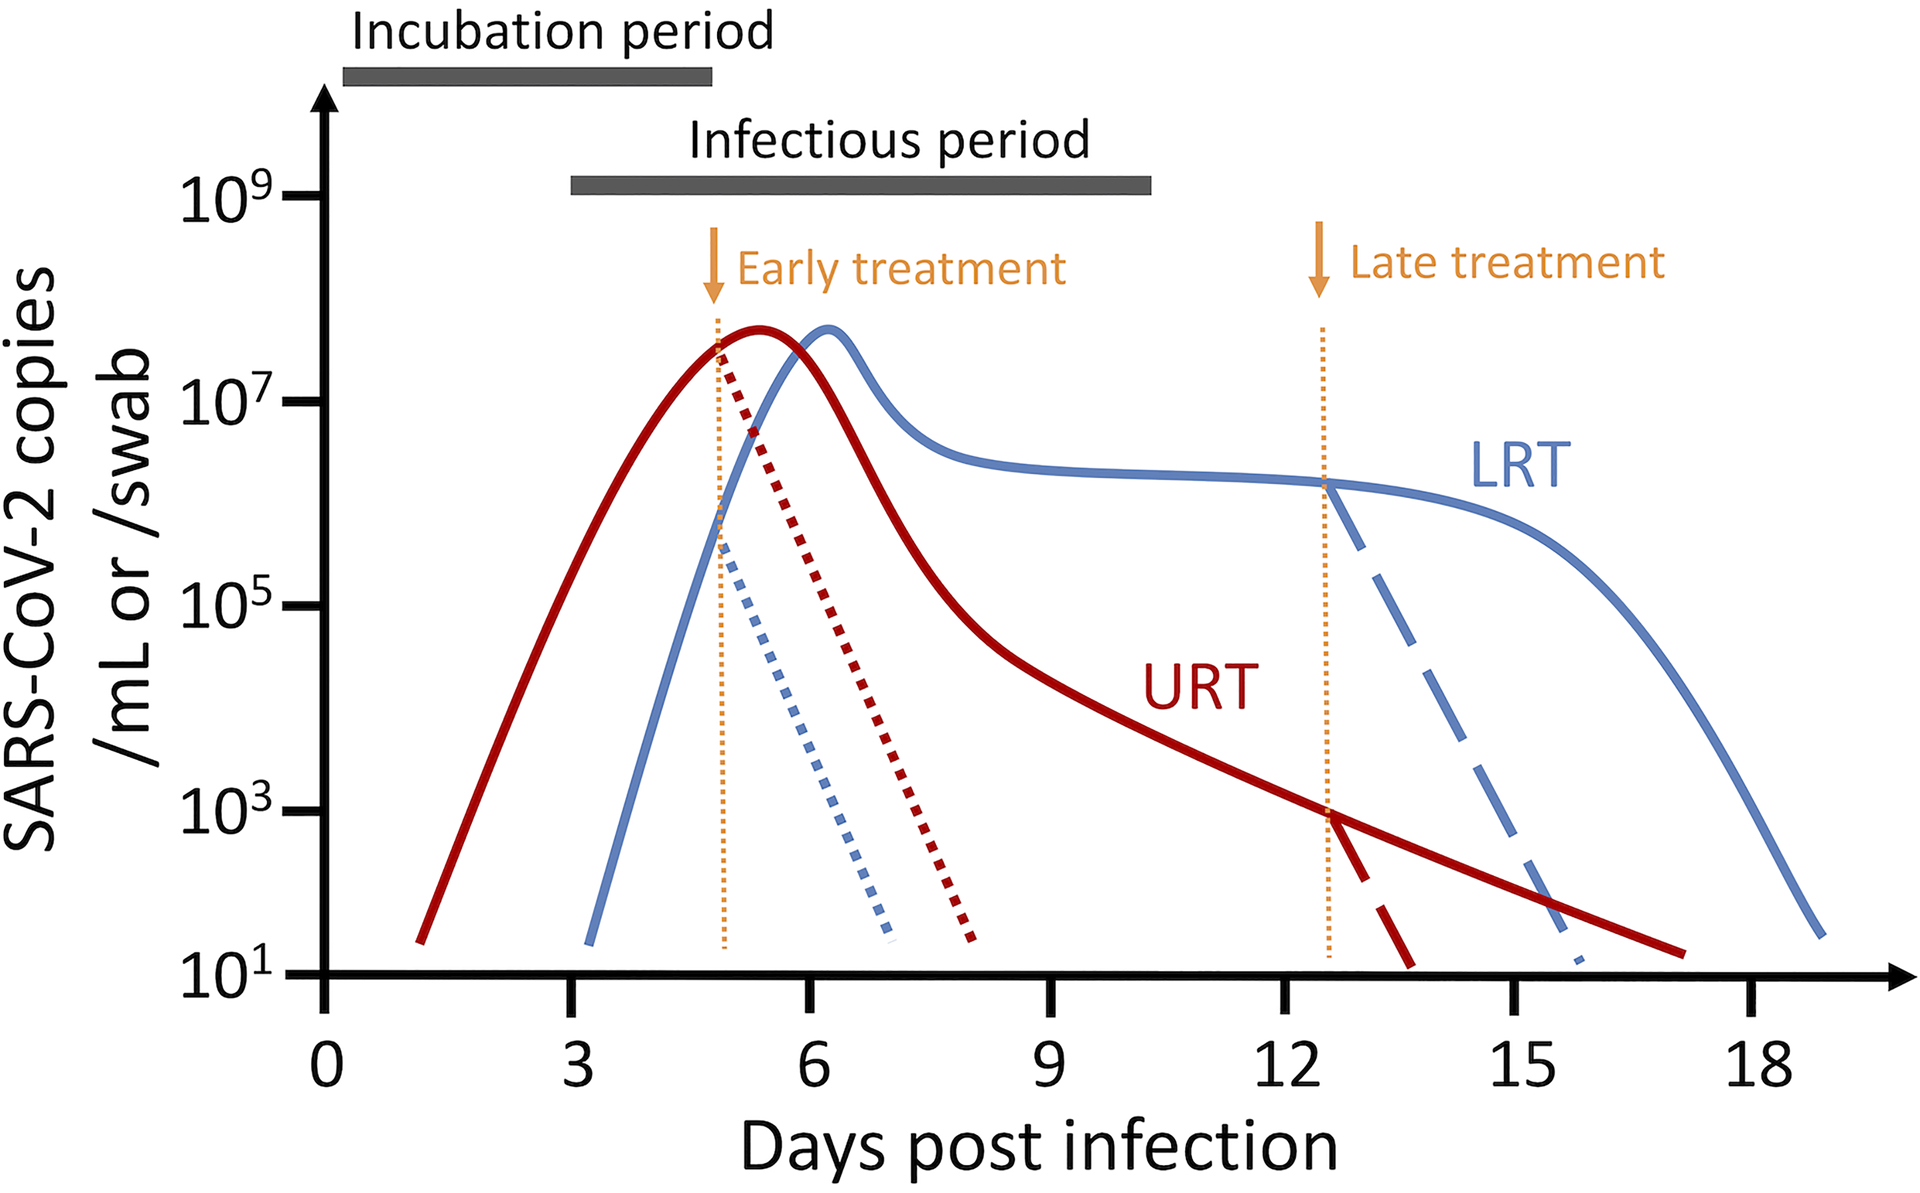
Modern viral kinetic modeling and its application to therapeutics is a field that attracted the attention of the medical, pharmaceutical, and modeling communities during the early days of the AIDS epidemic. Its successes led to applications of modeling methods not only to HIV but a plethora of other viruses, such as hepatitis C virus (HCV), hepatitis B virus and cytomegalovirus, which along with HIV cause chronic diseases, and viruses such as influenza, respiratory syncytial virus, West Nile virus, Zika virus, and severe acute respiratory syndrome coronavirus 2 (SARS-CoV-2), which generally cause acute infections. Here we first review the historical development of mathematical models to understand HIV and HCV infections and the effects of treatment by fitting the models to clinical data. We then focus on recent efforts and contributions of applying these models towards understanding SARS-CoV-2 infection and highlight outstanding questions where modeling can provide crucial insights and help to optimize nonpharmaceutical and pharmaceutical interventions of the coronavirus disease 2019 (COVID-19) pandemic. The review is written from our personal perspective emphasizing the power of simple target cell limited models that provided important insights and then their evolution into more complex models that captured more of the virology and immunology. To quote Albert Einstein, "Everything should be made as simple as possible, but not simpler," and this idea underlies the modeling we describe below.
© 2021 The Authors. Clinical Pharmacology & Therapeutics © 2021 American Society for Clinical Pharmacology and Therapeutics.
Conflict of interest statement
Conflict of interest: The authors declared no competing interests for this work.
Figures
References
-
- Ho DD, et al. Rapid turnover of plasma virions and CD4 lymphocytes in HIV-1 infection. Nature 373 123–126. (1995) - PubMed
-
- Wei X, et al. Viral dynamics in human immunodeficiency virus type 1 infection. Nature 373 117–122. (1995) - PubMed
-
- Perelson AS, Neumann AU, Markowitz M, Leonard JM, Ho DD. HIV-1 dynamics in vivo: virion clearance rate, infected cell life-span, and viral generation time. Science 271 1582–1586. (1996) - PubMed
-
- Perelson AS. Modelling viral and immune system dynamics. Nat Rev Immunol 2 28–36. (2002) - PubMed
-
- Stafford MA, et al. Modeling plasma virus concentration during primary HIV infection. J Theor Biol 203 285–301. (2000) - PubMed
Publication types
MeSH terms
Substances
Grants and funding
LinkOut - more resources
Full Text Sources
Other Literature Sources
Medical
Miscellaneous
