

Silenced lncRNA H19 and up-regulated microRNA-129 accelerates viability and restrains apoptosis of PC12 cells induced by Aβ25-35 in a cellular model of Alzheimer's disease
- PMID: 33410377
- PMCID: PMC7849745
- DOI: 10.1080/15384101.2020.1863681
Silenced lncRNA H19 and up-regulated microRNA-129 accelerates viability and restrains apoptosis of PC12 cells induced by Aβ25-35 in a cellular model of Alzheimer's disease
Abstract
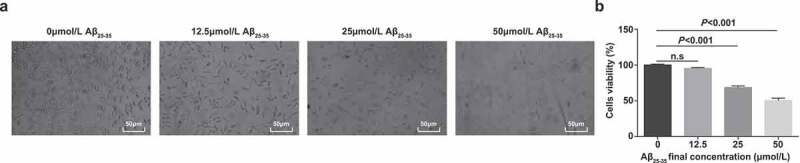
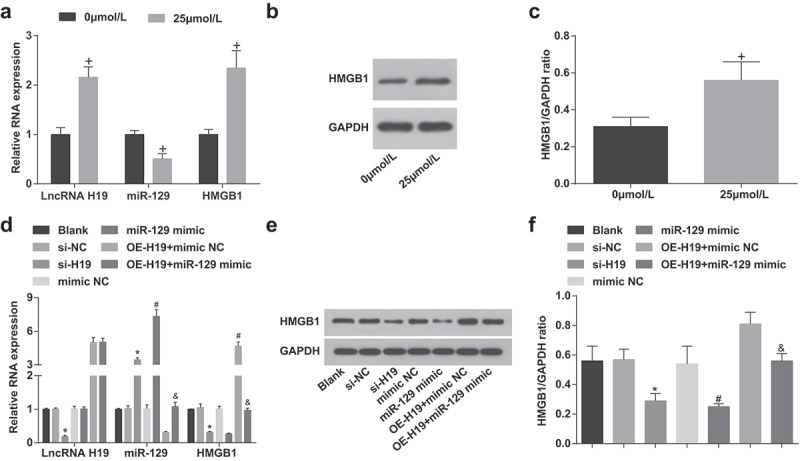
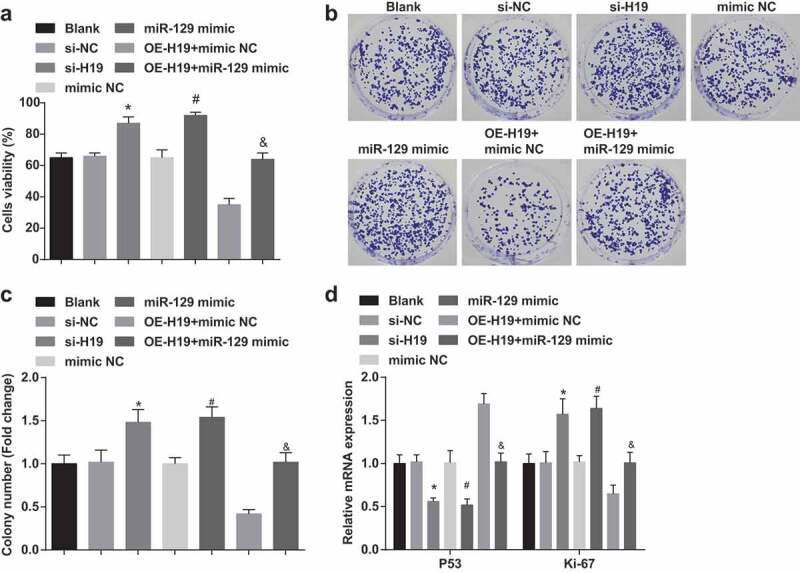
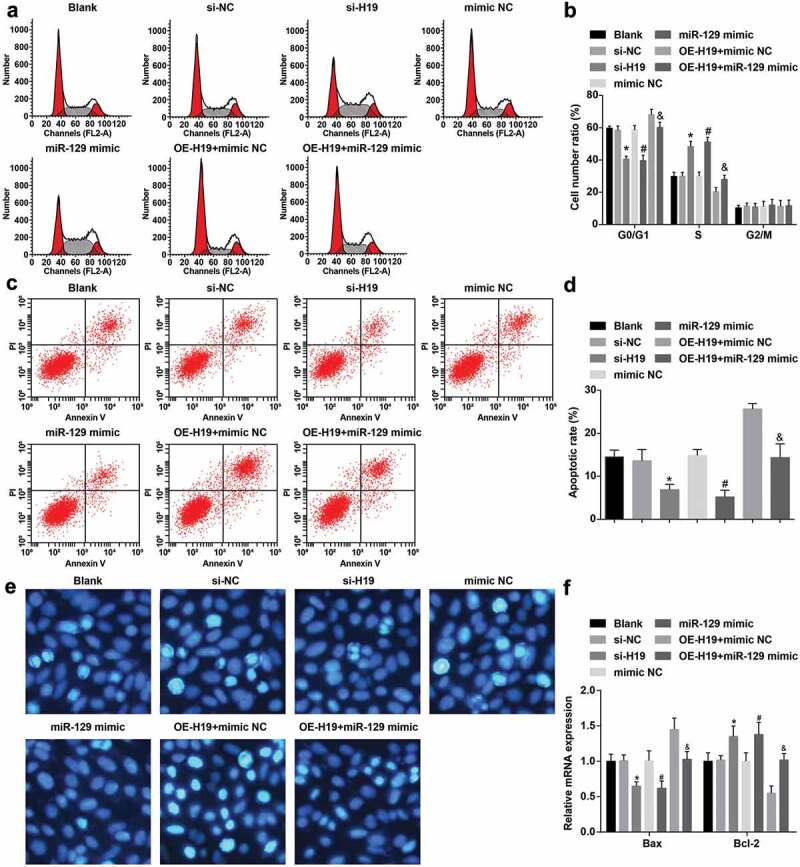
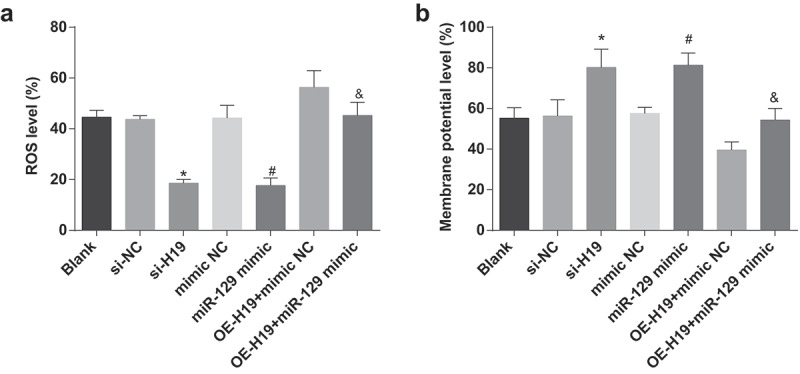
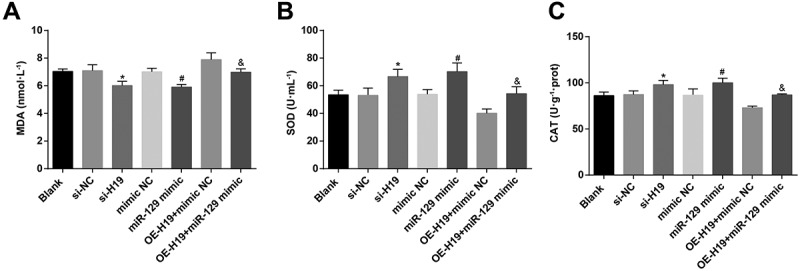
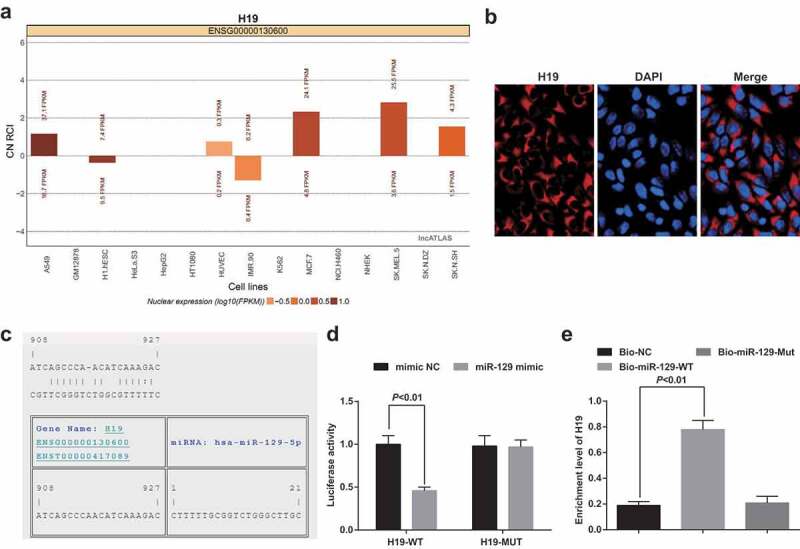
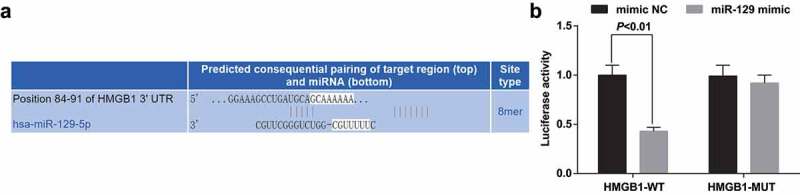
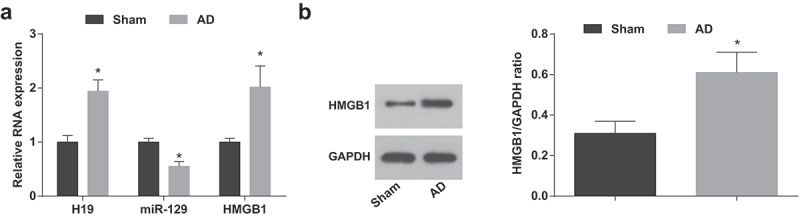
Accumulating data manifest that long non-coding RNA (lncRNAs) are involved in all kinds of neurodegenerative disorders, consisting of the onset and progression of Alzheimer's disease (AD). The study was for the research of the mechanism of lncRNA H19 (H19) in viability and apoptosis of PC12 cells induced by Aβ25-35 in a cellular model of AD with the regulation of microRNA (miR)-129 and high mobility group box-1 protein (HMGB1). An AD cellular model of PC12 cells was established using Aβ25-35. The Aβ25-35-induced PC12 cells were transfected with si-H19 or miR-129 mimic to figure their roles in cell viability,apoptosis, mitochondrial membrane potential dysfunction and oxidative stress in AD. Luciferase reporter assay and RNA-pull down assay were employed for verification of the binding relationship between H19 and miR-129 and the targeting relationship between miR-129 and HMGB1. An AD mouse model was induced and brain tissues were collected. H19, miR-129 and HMGB1 were detected in Aβ25-35-treated cells and brain tissues of AD mice. Elevated H19, HMGB1 and decreased miR-129 were found in Aβ25-35-treated PC12 cells as well as in brain tissues of AD mice. Silenced H19 or elevated miR-129 promoted viability, inhibited apoptosis, prevented mitochondrial membrane potential dysfunction and decreased oxidative stress in Aβ25-35-treated PC12 cells. H19 could specifically bind to miR-129. MiR-129 specifically suppressed HMGB1 expression. This study suggests that silenced H19 and up-regulated miR-129 accelerates viability and represses apoptosis of PC12 cells stimulated by Aβ25-35 in AD, which is beneficial for AD treatment.
Keywords: Alzheimer’s disease; Aβ25-35; MicroRNA-129; PC12 cells; apoptosis; high mobility group box-1 protein; long non-coding RNA H19; viability.
Conflict of interest statement
The authors declare that they have no conflicts of interest.
Figures
Similar articles
-
Suppression of lncRNA-ATB prevents amyloid-β-induced neurotoxicity in PC12 cells via regulating miR-200/ZNF217 axis.Biomed Pharmacother. 2018 Dec;108:707-715. doi: 10.1016/j.biopha.2018.08.155. Epub 2018 Sep 21. Biomed Pharmacother. 2018. PMID: 30248538
-
Silencing of LncRNA BDNF-AS attenuates Aβ25-35-induced neurotoxicity in PC12 cells by suppressing cell apoptosis and oxidative stress.Neurol Res. 2018 Sep;40(9):795-804. doi: 10.1080/01616412.2018.1480921. Epub 2018 Jun 14. Neurol Res. 2018. PMID: 29902125
-
MicroRNA-20b-5p aggravates neuronal apoptosis induced by β-Amyloid via down-regulation of Ras homolog family member C in Alzheimer's disease.Neurosci Lett. 2021 Jan 18;742:135542. doi: 10.1016/j.neulet.2020.135542. Epub 2020 Dec 2. Neurosci Lett. 2021. PMID: 33278507
-
Research progress on lncRNAs in Alzheimer's disease.Yi Chuan. 2022 Mar 20;44(3):189-197. doi: 10.16288/j.yczz.21-427. Yi Chuan. 2022. PMID: 35307642 Review.
-
Long noncoding RNAs and Alzheimer's disease.Clin Interv Aging. 2016 Jun 29;11:867-72. doi: 10.2147/CIA.S107037. eCollection 2016. Clin Interv Aging. 2016. PMID: 27418812 Free PMC article. Review.
Cited by
-
The Emerging Role of Autophagy-Associated lncRNAs in the Pathogenesis of Neurodegenerative Diseases.Int J Mol Sci. 2023 Jun 2;24(11):9686. doi: 10.3390/ijms24119686. Int J Mol Sci. 2023. PMID: 37298636 Free PMC article. Review.
-
Unraveling epigenomic signatures and effectiveness of electroconvulsive therapy in treatment-resistant depression patients: a prospective longitudinal study.Clin Epigenetics. 2024 Jul 17;16(1):93. doi: 10.1186/s13148-024-01704-z. Clin Epigenetics. 2024. PMID: 39020437 Free PMC article.
-
Pongamol Prevents Neurotoxicity via the Activation of MAPKs/Nrf2 Signaling Pathway in H2O2-Induced Neuronal PC12 Cells and Prolongs the Lifespan of Caenorhabditis elegans.Mol Neurobiol. 2024 Oct;61(10):8219-8233. doi: 10.1007/s12035-024-04110-x. Epub 2024 Mar 14. Mol Neurobiol. 2024. PMID: 38483657
-
Characterization of Polysaccharides from the Pericarp of Zanthoxylum bungeanum Maxim by Saccharide Mapping and Their Neuroprotective Effects.Molecules. 2023 Feb 15;28(4):1813. doi: 10.3390/molecules28041813. Molecules. 2023. PMID: 36838801 Free PMC article.
-
Crocin ameliorates neuroinflammation and cognitive impairment in mice with Alzheimer's disease by activating PI3K/AKT pathway.Brain Behav. 2024 May;14(5):e3503. doi: 10.1002/brb3.3503. Brain Behav. 2024. PMID: 38775292 Free PMC article.
References
-
- Tseng HJ, Lin M-H, Shiao Y-J, et al. Synthesis and biological evaluation of acridine-based histone deacetylase inhibitors as multitarget agents against Alzheimer’s disease. Eur J Med Chem. 2020;192:112193. - PubMed
Publication types
MeSH terms
Substances
LinkOut - more resources
Full Text Sources
Other Literature Sources
Medical