

Resection of cerebellar tumours causes widespread and functionally relevant white matter impairments
- PMID: 33410575
- PMCID: PMC7978119
- DOI: 10.1002/hbm.25317
Resection of cerebellar tumours causes widespread and functionally relevant white matter impairments
Abstract
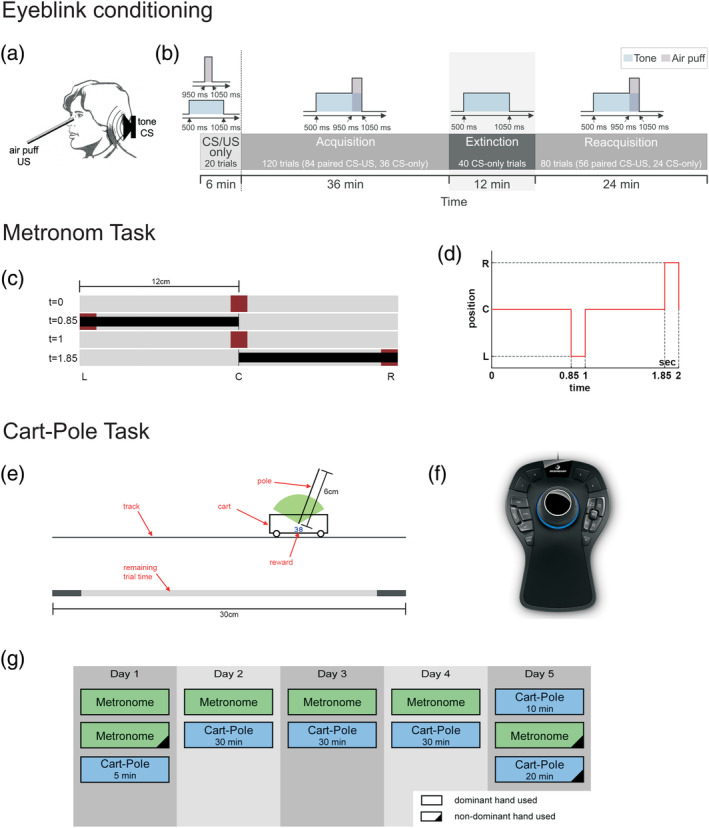
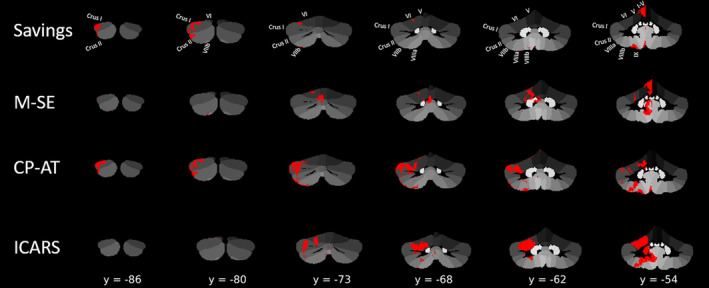
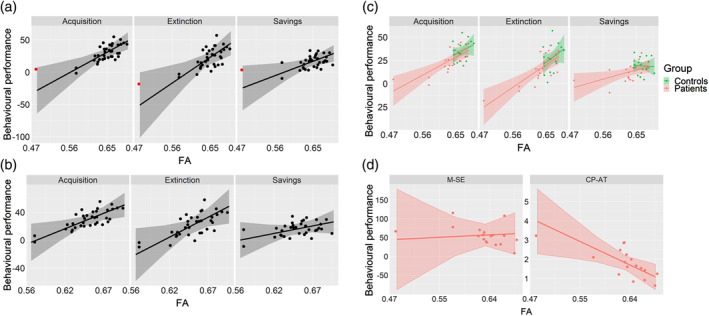
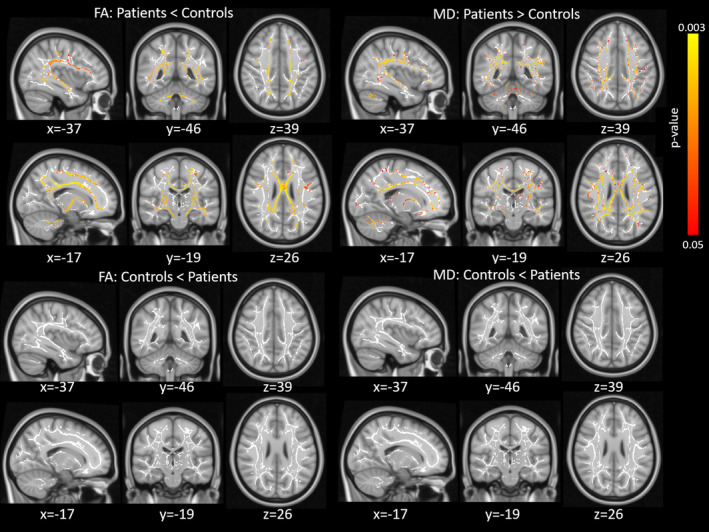
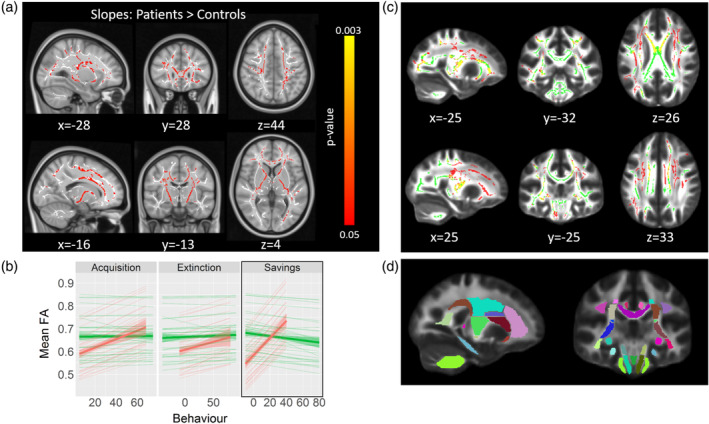
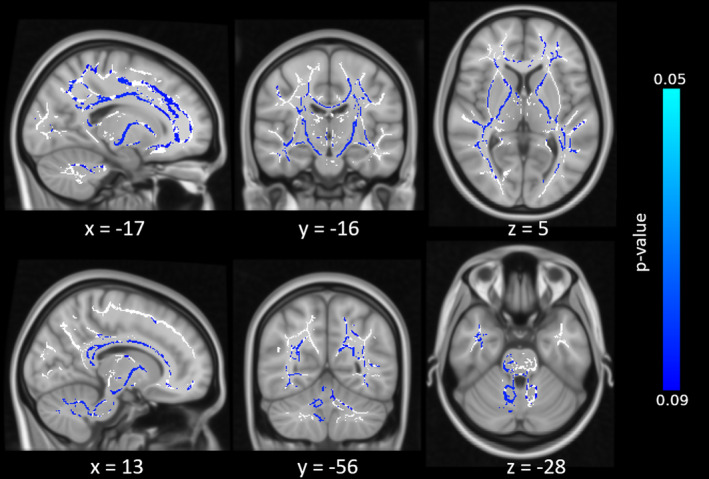
Several diffusion tensor imaging studies reveal that white matter (WM) lesions are common in children suffering from benign cerebellar tumours who are treated with surgery only. The clinical implications of WM alterations that occur as a direct consequence of cerebellar disease have not been thoroughly studied. Here, we analysed structural and diffusion imaging data from cerebellar patients with chronic surgical lesions after resection for benign cerebellar tumours. We aimed to elucidate the impact of focal lesions of the cerebellum on WM integrity across the entire brain, and to investigate whether WM deficits were associated with behavioural impairment in three different motor tasks. Lesion symptom mapping analysis suggested that lesions in critical cerebellar regions were related to deficits in savings during an eyeblink conditioning task, as well as to deficits in motor action timing. Diffusion imaging analysis of cerebellar WM indicated that better behavioural performance was associated with higher fractional anisotropy (FA) in the superior cerebellar peduncle, cerebellum's main outflow path. Moreover, voxel-wise analysis revealed a global pattern of WM deficits in patients within many cerebral WM tracts critical for motor and non-motor function. Finally, we observed a positive correlation between FA and savings within cerebello-thalamo-cortical pathways in patients but not in controls, showing that saving effects partly depend on extracerebellar areas, and may be recruited for compensation. These results confirm that the cerebellum has extended connections with many cerebral areas involved in motor/cognitive functions, and the observed WM changes likely contribute to long-term clinical deficits of posterior fossa tumour survivors.
Keywords: cerebellum; diffusion tensor imaging; eyeblink conditioning; lesion-symptom mapping; motor skill learning.
© 2020 The Authors. Human Brain Mapping published by Wiley Periodicals LLC.
Figures

Similar articles
-
Pronounced reduction of acquisition of conditioned eyeblink responses in young adults with focal cerebellar lesions impedes conclusions on the role of the cerebellum in extinction and savings.Neuropsychologia. 2016 May;85:287-300. doi: 10.1016/j.neuropsychologia.2016.03.027. Epub 2016 Mar 25. Neuropsychologia. 2016. PMID: 27020135
-
Cerebral white matter fractional anisotropy and tract volume as measured by MR imaging are associated with impaired cognitive and motor function in pediatric posterior fossa tumor survivors.Pediatr Blood Cancer. 2015 Jul;62(7):1252-8. doi: 10.1002/pbc.25485. Epub 2015 Apr 7. Pediatr Blood Cancer. 2015. PMID: 25850573
-
Cerebello-thalamo-cerebral connections in pediatric brain tumor patients: impact on working memory.Neuroimage. 2011 Jun 15;56(4):2238-48. doi: 10.1016/j.neuroimage.2011.03.065. Epub 2011 Apr 5. Neuroimage. 2011. PMID: 21473922
-
The role of diffusion tensor imaging and fractional anisotropy in the evaluation of patients with idiopathic normal pressure hydrocephalus: a literature review.Neurosurg Focus. 2016 Sep;41(3):E12. doi: 10.3171/2016.6.FOCUS16192. Neurosurg Focus. 2016. PMID: 27581308 Review.
-
Review of diffusion MRI studies in chronic white matter diseases.Neurosci Lett. 2019 Feb 16;694:198-207. doi: 10.1016/j.neulet.2018.12.007. Epub 2018 Dec 6. Neurosci Lett. 2019. PMID: 30528980 Free PMC article. Review.
Cited by
-
Networking of the Human Cerebellum: From Anatomo-Functional Development to Neurosurgical Implications.Front Neurol. 2022 Feb 4;13:806298. doi: 10.3389/fneur.2022.806298. eCollection 2022. Front Neurol. 2022. PMID: 35185765 Free PMC article. Review.
-
White matter correlates of sensorimotor synchronization in persistent developmental stuttering.J Commun Disord. 2022 Jan-Feb;95:106169. doi: 10.1016/j.jcomdis.2021.106169. Epub 2021 Nov 16. J Commun Disord. 2022. PMID: 34856426 Free PMC article.
-
White matter tract changes in pediatric posterior fossa brain tumor survivors after surgery and chemotherapy.Front Neuroimaging. 2022 Sep 20;1:845609. doi: 10.3389/fnimg.2022.845609. eCollection 2022. Front Neuroimaging. 2022. PMID: 37555139 Free PMC article.
-
Mapping of long-term cognitive and motor deficits in pediatric cerebellar brain tumor survivors into a cerebellar white matter atlas.Childs Nerv Syst. 2021 Sep;37(9):2787-2797. doi: 10.1007/s00381-021-05244-2. Epub 2021 Aug 5. Childs Nerv Syst. 2021. PMID: 34355257 Free PMC article.
-
Cerebellar glioblastoma in adults: a comparative single-center matched pair analysis and systematic review of the literature.J Cancer Res Clin Oncol. 2024 Sep 28;150(9):432. doi: 10.1007/s00432-024-05959-0. J Cancer Res Clin Oncol. 2024. PMID: 39340649 Free PMC article.
References
Publication types
MeSH terms
LinkOut - more resources
Full Text Sources
Other Literature Sources
Medical
