

Histone methyltransferase DOT1L controls state-specific identity during B cell differentiation
- PMID: 33410591
- PMCID: PMC7857439
- DOI: 10.15252/embr.202051184
Histone methyltransferase DOT1L controls state-specific identity during B cell differentiation
Abstract
Differentiation of naïve peripheral B cells into terminally differentiated plasma cells is characterized by epigenetic alterations, yet the epigenetic mechanisms that control B-cell fate remain unclear. Here, we identified a role for the histone H3K79 methyltransferase DOT1L in controlling B-cell differentiation. Mouse B cells lacking Dot1L failed to establish germinal centers (GC) and normal humoral immune responses in vivo. In vitro, activated B cells in which Dot1L was deleted showed aberrant differentiation and prematurely acquired plasma cell characteristics. Similar results were obtained when DOT1L was chemically inhibited in mature B cells in vitro. Mechanistically, combined epigenomics and transcriptomics analysis revealed that DOT1L promotes expression of a pro-proliferative, pro-GC program. In addition, DOT1L indirectly supports the repression of an anti-proliferative plasma cell differentiation program by maintaining the repression of Polycomb Repressor Complex 2 (PRC2) targets. Our findings show that DOT1L is a key modulator of the core transcriptional and epigenetic landscape in B cells, establishing an epigenetic barrier that warrants B-cell naivety and GC B-cell differentiation.
Keywords: B-cell differentiation; DOT1L; PRC2; germinal center B cell; plasma cell.
© 2021 The Authors. Published under the terms of the CC BY NC ND 4.0 license.
Conflict of interest statement
The authors declare that they have no conflict of interest.
Figures

Expression of Dot1L in different B‐cell populations (Shi et al, 2015). B1: B1 cells, MZB: marginal zone B, FOB: follicular B, GCB: germinal center B, SPLPB: spleen plasma blast, SPLPC: spleen plasma cells, and BMPC: Bone marrow plasma cells. Expression is shown as transcript per million (TPM). Results represent the data from two biological replicates except SPLPB and BMPC which lack replicates (WT; n = 2). Bars indicate mean values.
Intracellular flow cytometry staining for H3K79me2 in bone marrow B‐cell subsets as well as splenic B and T cells from MB1Cre+/−; Dot1Lwt/wt (WT) and MB1Cre+/−; Dot1Lfl/fl (KO) mice. Results represent the data from two independent experiments.
Statistical analysis of the absolute number of total nucleated cells from bone marrow B‐cell subsets. Results represent the data pooled from three independent experiments, and numbers represent biological replicates for each group (WT; n = 5, KO; n = 7), except bone marrow cellularity (WT; n = 10, KO; n = 14). Bars and error bars indicate mean ± SD.
- A
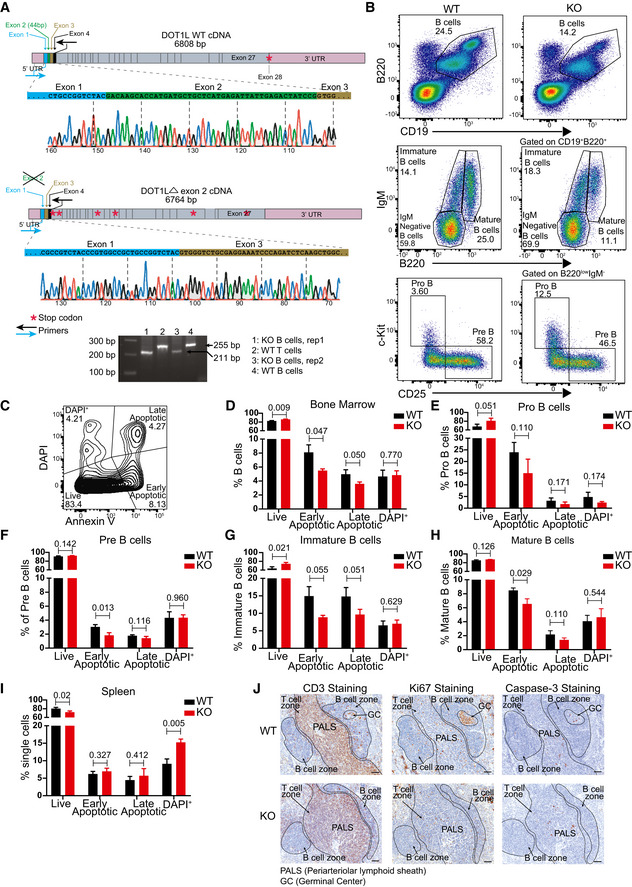
Schematic view of WT and KO (Δ exon 2) cDNA of Dot1L showing UTRs, exons, physiological translational stop codon for WT, multiple translational stop codons (position not to scale) generated after frameshifting induced in KO and location of primers used in RT–PCR to amplify the region flanking exon 2. Chromatograph generated by sanger sequencing showing Cre‐mediated deletion of exon 2 leading to joining of exon 1 to exon 3 in KO. Agarose gel picture showing the deletion of 44 bp corresponding to exon 2 specifically in KO‐B cells. Results represent the data from one experiment, and numbers represent biological replicates for each group (WT; n = 1, KO; n = 2).
- B
Representative flow cytometry plots showing gating strategy to identify and compare relative frequency of different B lineage precursor subsets in the bone marrow from WT and KO mice.
- C
Representative flow cytometry plots showing gating strategy to identify and compare relative frequency of live, early apoptotic, late apoptotic, and DAPI+ cells in bone marrow.
- D–H
Statistical analysis of the relative frequency of live, early apoptotic, late apoptotic, and DAPI+ cells from the total B lineage and its subsets in the bone marrow from WT and KO mice. Results represent the data from one experiment, and numbers represent biological replicates for each group (WT; n = 3, KO; n = 3).
- I
Statistical analysis of the relative frequency of live, early apoptotic, late apoptotic and DAPI+ cells from mature spleen B cells from WT and KO mice. Results represent the data from one experiment, and numbers represent biological replicates for each group (WT; n = 3, KO; n = 3).
- J
Immunohistochemistry staining for CD3, Ki67 and cleaved caspase‐3 on spleen sections from WT and KO mice. Results represent the data from at one experiment, and numbers represent biological replicates for each group (WT; n = 4, KO; n = 4).
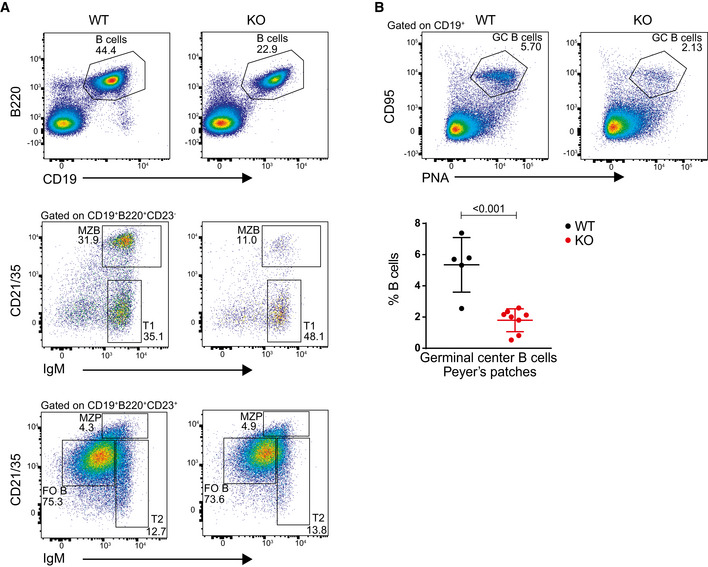
Representative flow cytometry plots showing gating strategy to identify and compare relative frequency of mature B cells and different B‐cell subsets from the spleen of WT and KO mice.
Representative flow cytometry plots showing gating strategy to identify and compare germinal center B cells from Peyer’s patches from WT and KO mice (upper panel). Statistical analysis of the percentage of germinal center B cells of total B from Peyer’s patches (lower panel). Results represent the data from three independent experiments, and numbers represent biological replicates for each group (WT; n = 5, KO; n = 8).
- A
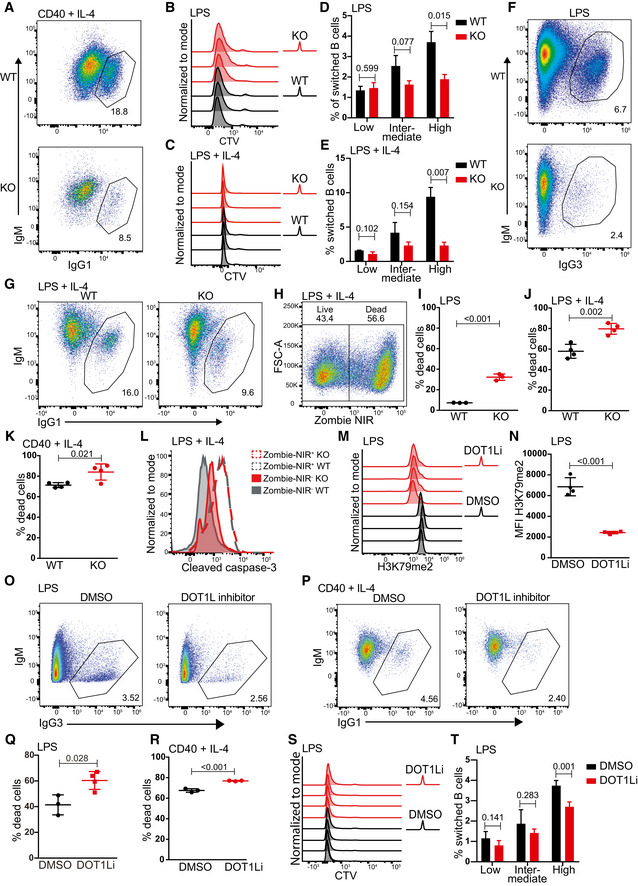
Representative flow cytometry plots showing gating strategy to identify and compare relative frequency of IgG1 switched cells from WT and KO mice after 4 days of activation with anti CD40 + IL‐4.
- B, C
Number of cell divisions traced by CTV dilution of B cells after 4 days of stimulation with LPS (B) or LPS + IL‐4 (C). Data represent three biological replicates for each genotype.
- D, E
Statistical analysis of the percentage of IgG1 switched cells per generation of proliferating B cells after 4 days of stimulation with LPS (D) or LPS + IL‐4 (E). Results represent the data from one experiment and numbers represent biological replicates for each group (WT; n = 3, KO; n = 3).
- F, G
Representative flow cytometry plots showing gating strategy to identify and compare relative frequency of IgG1 switched cells from WT and KO mice after 4 days of activation with LPS (F) or LPS + IL‐4 (G).
- H
Representative flow cytometry plot from single cells showing gating strategy to identify live (Zombie NIR−) and dead cells (Zombie NIR+) after 4 days of stimulation with LPS + IL‐4.
- I–K
Statistical analysis of dead cells indicated as the percentage of total single cells after 4 days of stimulation with LPS (I), LPS + IL‐4 (J) or anti‐CD40 + IL‐4 (K). Results represent the data from one experiment and numbers represent biological replicates for each group (I: (WT) n = 3, (KO) n = 3; J: (WT) n = 4, (KO) n = 4; K: (WT) n = 4, (KO) n = 4).
- L
Representative histograms indicating the levels of cleaved caspase‐3 in live (Zombie NIR−) after 4 days of stimulation with LPS + IL‐4. Cleaved caspase‐3 levels on dead (Zombie NIR+) population shown, as positive control.
- M
Intracellular flow cytometry staining for H3K79me2 in activated B‐cell after 4 days of stimulation with LPS either in the presence of DOT1L inhibitor, Pinometostat or DMSO as a control. Data represent three biological replicates for each treatment.
- N
Statistical analysis of Median Fluorescence Intensity (MFI) of H3K79me after 4 days of stimulation with LPS either in the presence of DOT1L inhibitor, Pinometostat or DMSO as a control is shown. Results represent the data from one experiment, and numbers represent biological replicates for each treatment (n = 4).
- O, P
Representative flow cytometry plots showing gating strategy to identify and compare relative frequency of switched cells after 4 days of stimulation of naive B cells with LPS (O) or LPS + IL‐4 (P) either in the presence of DOT1L inhibitor, Pinometostat, or DMSO as a control.
- Q, R
Statistical analysis of dead cells indicated as the percentage of total single cells after 4 days of stimulation with LPS (Q) or LPS + IL‐4 (R) either in the presence of DOT1L inhibitor, Pinometostat, or DMSO as a control. Results represent the data from one experiment, and numbers represent biological replicates for each treatment (n = 4).
- S
Number of cell divisions traced by CTV dilution of B cells after 4 days of stimulation with LPS either in the presence of the DOT1L inhibitor Pinometostat or DMSO as a control. Data represent four biological replicates for each treatment.
- T
Statistical analysis of the percentage of IgG3 switched cells per generation of proliferating B cells after 4 days of stimulation with LPS either in the presence of the DOT1L inhibitor Pinometostat or DMSO as a control. Results represent the data from one experiment, and numbers represent biological replicates for each treatment (n = 4).
- A–E
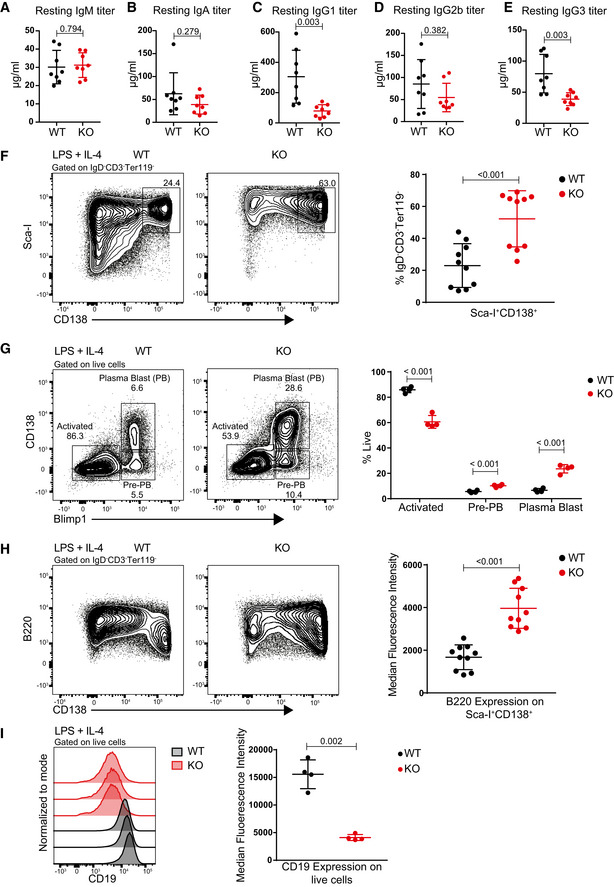
Statistical analysis of resting serum titers of IgM (A), IgA (B), IgG1 (C), IgG2b (D), and IgG3 (E) from WT and KO mice. P‐value for IgA (B) was calculated by Mann–Whitney test. Results represent the data from two independent experiments and numbers represent biological replicates for each group (WT; n = 8, KO; n = 8).
- F
Representative flow cytometry plots showing gating strategy to identify and compare plasma cells (Sca‐I+CD138+) between WT and KO cells after 4 days of stimulation with LPS + IL‐4 (left panel) and statistical analyses of their relative numbers (right panel). Results represent the data from three independent experiments, and numbers represent biological replicates for each group (WT; n = 10, KO; n = 10).
- G
Representative flow cytometry plots showing gating strategy to identify and compare activated B cells (CD138+ Blimp1+), Pre‐PB cells (CD138− Blimp1+) and plasma blast (PB) cells between WT and KO cells after 4 days of stimulation with LPS + IL‐4 (left panel) and statistical analyses of their relative numbers (right panel). Results represent the data from one experiment, and numbers represent biological replicates for each group (WT; n = 4, KO; n = 4).
- H
Representative flow cytometry plots showing the relative surface density for B220 (CD45R) of WT and KO cells after 4 days of stimulation with LPS + IL‐4 (left panel) and statistical analysis of MFI of B220 for each group (right panel). Results represent the data from three independent experiments, and numbers represent biological replicates for each group (WT; n = 10, KO; n = 10).
- I
Representative histograms showing the relative surface density for CD19 on total live WT and KO cells after 4 days of stimulation with LPS + IL‐4 (left panel) and statistical analysis of MFI of CD19 for each group (right panel). Results represent the data from one experiment, and numbers represent biological replicates for each group (WT; n = 4, KO; n = 4).
- A–C
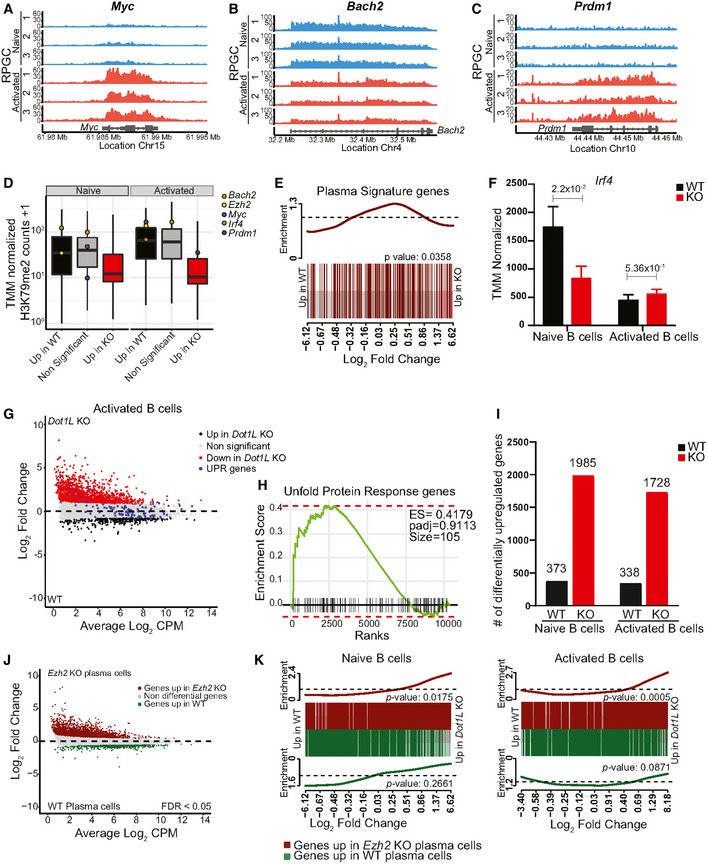
H3K79me2 methylation at the Myc (A), Bach2 (B), and Prdm1 (C) loci from WT activated and naïve B cells, as determined by ChIP‐seq reads per genomic content (RPGC). Data represent three independent biological replicates for each condition.
- D
Box plot showing the distribution of mean WT H3K79me2 level for Bach2, Ezh2, Myc, Irf4, and Prdm1 among different indicated gene sets from activated and naïve B cells. Boxes in Box plot indicate Inter quartile range (IQR) and whiskers show 1.5 IQR of highest and lowest quartile. Central horizontal line within the bars represent median of the TMM normalized H3K79me2 counts + 1 values of the respective genes for each condition. Results represent the data generated from three biological replicates for each group.
- E
Relative distribution of plasma cell signature genes between WT and Dot1L‐KO naïve B cells depicted by BARCODE plot. The P‐values calculated via FRY test show the statistical significance of enrichment of each gene set. P‐value less than 0.05 was considered as significant.
- F
Differential (FDR < 0.05) expression of Irf4 transcripts as indicated by counts per million after TMM normalization from naïve and activated B cells from WT and KO mice. Data were generated from three independent biological replicates for each genotype. Bars and error bars indicate mean ± SD. Statistical significance is indicated by FDR after the Benjamini–Hochberg multiple testing correction performed by edgeR package using R language.
- G
MA‐Plot of normalized RNA‐Seq data generated from three independent biological replicates for each genotype showing relative distribution of Unfold protein response (UPR) genes between WT and Dot1L‐KO Activated B cells.
- H
Lack of significant enrichment of UPR gene set between WT and Dot1L‐KO activated B cells shown by Fast gene set enrichment analysis.
- I
Number of differentially (FDR < 0.05) expressed genes from naïve and activated WT and Dot1L‐KO B cells. Results represent the data generated from three biological replicates for each group and condition.
- J
MA‐Plot of normalized RNA‐Seq data generated from three independent biological replicates for each genotype showing differentially (FDR < 0.05) expressed genes between Ezh2‐KO and ‐WT plasma cells, using data GSE103126 (Guo et al, 2018).
- K
Relative distribution of up‐ (dark‐red) and downregulated (green) genes from Ezh2‐KO plasma cells between WT and Dot1L‐KO naïve and activated B cells depicted by BARCODE plot. The P‐values calculated via FRY test show the statistical significance of enrichment of each gene set. A P‐value of less than 0.05 was considered as significant.
- A–G
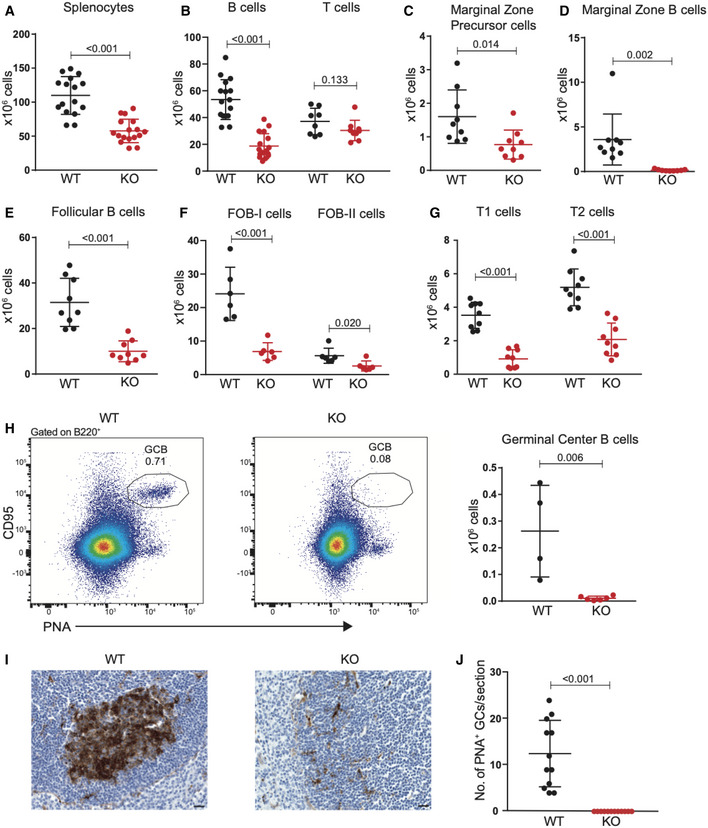
Statistical analysis of absolute number of total nucleated splenocytes, splenic B‐ and T‐cells, and indicated mature B‐cell subsets in WT and KO mice. Results represent the data pooled from at least two independent experiments and numbers represent biological replicates for each group (A: (WT) n = 16, (KO) n = 17; B (B‐cells): (WT) n = 16, (KO) n = 17; B (T‐cells): (WT) n = 8, (KO) n = 9; C–E: (WT) n = 9, (KO) n = 9; F: (WT) n = 6, (KO) n = 6; G: (WT) n = 9, (KO) n = 9).
- H
Representative flow cytometry plots showing gating strategy (left panel) to identify germinal center B cells (PNAhigh, CD95+) from the spleen of unchallenged WT and KO mice and statistical analysis of their absolute number (right panel). Results represent the data pooled from two independent experiments, and numbers represent biological replicates for each group (WT; n = 4, KO; n = 6).
- I
Identification of germinal centers by lectin histochemistry of Peanut agglutinin (PNA) in spleens from WT and KO mice. The scale bar: 20 μm.
- J
Quantification of germinal centers identified in spleen sections as shown in (I). Results represent the data from one experiment, and numbers represent biological replicates for each group (WT; n = 6, KO; n = 6).
- A
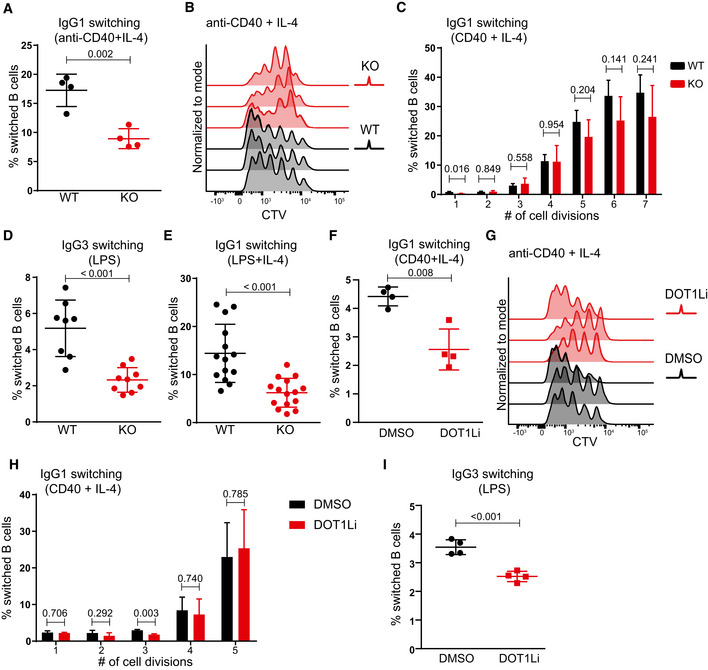
Statistical analysis of IgG1 switching of Dot1L‐proficient (WT) and Dot1L‐deficient (KO) B cells after 4 days of activation with anti‐CD40 + IL‐4. Results represent the data from one experiment, and numbers represent biological replicates for each group (WT; n = 4, KO; n = 4).
- B
Number of cell divisions traced by CTV dilution of B cells stimulated for 4 days with anti‐CD40 + IL‐4. Data represent three biological replicates for each genotype.
- C
Statistical analysis of the percentage of IgG1 switched cells per generation of proliferating WT and KO B cells after 4 days of stimulation with anti‐CD40 + IL‐4. Results represent the data from one experiment, and numbers represent biological replicates for each group (WT; n = 4, KO; n = 4).
- D, E
Statistical analysis of switching of WT and KO naïve B cells activated for 4 days with LPS alone (IgG3 switching) (D) or with LPS + IL‐4 (IgG1 switching) (E). Results represent the data pooled from at least four independent experiments, and numbers represent biological replicates for each group (D: (WT) n = 8, (KO) n = 9; E: (WT) n = 11, (KO) n = 13).
- F
Statistical analysis of IgG1 switching of naïve B cells after 4 days of activation with anti‐CD40 + IL‐4 in the presence of the DOT1L inhibitor Pinometostat or DMSO as a control. Results represent the data from one experiment, and numbers represent biological replicates for each treatment (n = 4).
- G
Number of cell divisions traced by CTV dilution of B cells stimulated for 4 days with anti‐CD40 + IL‐4 either in the presence of DOT1L inhibitor Pinometostat or DMSO as a control. Data represents three biological replicates for each treatment.
- H
Statistical analysis of the percentage of IgG1 switched cells per generation of proliferating WT B cells after 4 days of stimulation with anti‐CD40 + IL‐4 either in the presence of DOT1L inhibitor Pinometostat or DMSO as a control. Results represent the data from one experiment, and numbers represent biological replicates for each treatment (n = 3).
- I
Statistical analysis of IgG3 switching of naïve B cells after 4 days of activation with LPS alone in the presence of the DOT1L inhibitor Pinometostat or DMSO as a control. Results represent the data from one experiment, and numbers represent biological replicates for each treatment (n = 4).
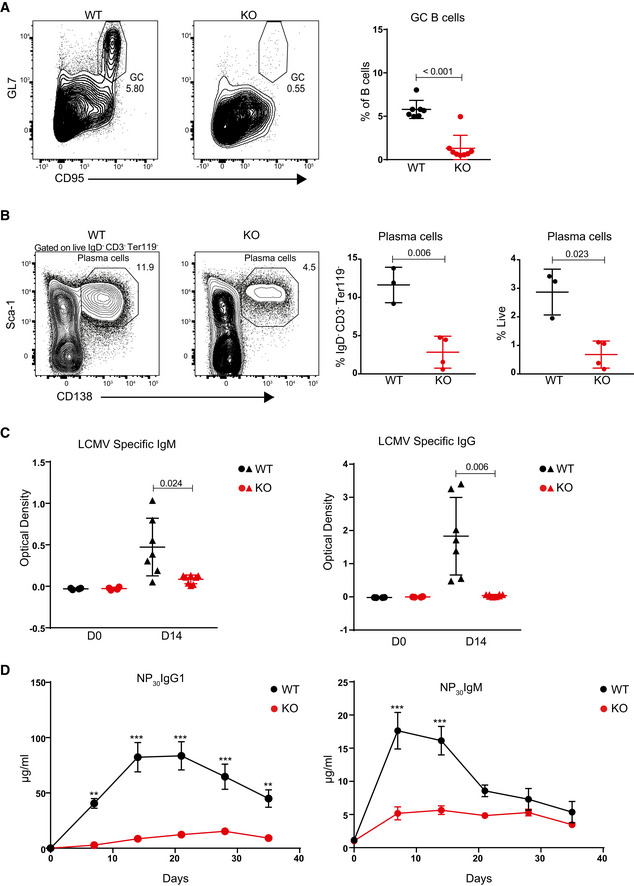
Representative flow cytometry plots showing gating strategy to identify splenic GC B cells 14 days after LCMV Armstrong infection in WT and Dot1L‐KO mice (left panel) and statistical analysis of their relative number. Results represent the data from two experiments, and numbers represent biological replicates for each group (WT; n = 7, KO; n = 8).
Representative flow cytometry plots showing gating strategy to identify plasma cells from the spleen 14 days after LCMV Armstrong infection (left panel) and statistical analysis of their relative number (right panel). Results represent the data from one experiment, and numbers represent biological replicates for each group (WT; n = 3, KO; n = 4).
Statistical analysis of serum titers of LCMV‐specific IgM and IgG of WT and KO mice before (D0) and 14 days after (D14) LCMV Armstrong infection. Results represent the data from two experiments, and numbers represent biological replicates for each group (WT; n = 7, KO; n = 8).
Statistical analysis of serum titers of NP‐specific IgG1 and IgM quantified by ELISA from WT and KO mice at the indicated days following immune challenge. Adjusted P‐value were calculated using two‐way ANOVA. Error bars indicate mean ± standard error of mean (SEM). Results represent the data from one experiment, and numbers represent biological replicates for each group (WT; n = 6, KO; n = 6).***P‐value < 0.0001 and **P‐value < 0.001.
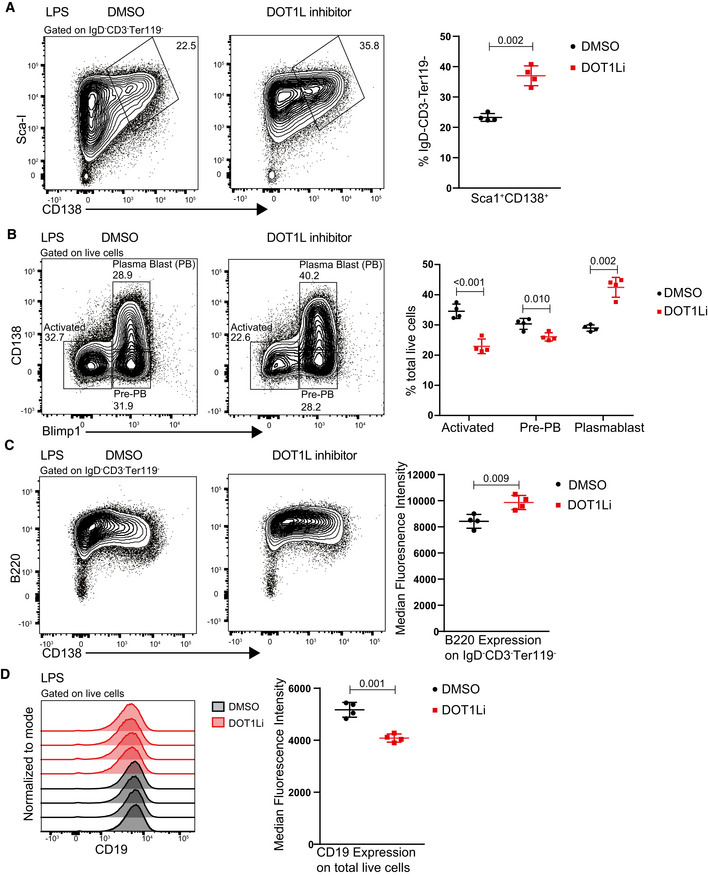
Representative flow cytometry plots showing gating strategy to identify and compare plasma cells (Sca‐I+CD138+) after 4 days of stimulation with LPS either in the presence of DOT1L inhibitor, Pinometostat, or DMSO as a control (left panel) and statistical analyses of their relative numbers (right panel). Results represent the data from one experiment, and numbers represent biological replicates for each treatment (n = 4).
Representative flow cytometry plots showing gating strategy to identify and compare activated B cells (CD138+ Blimp1+), Pre‐PB cells (CD138− Blimp1+) and plasma blast (PB) cells after 4 days of stimulation with LPS either in the presence of DOT1L inhibitor, Pinometostat, or DMSO as a control (left panel) and statistical analyses of their relative numbers (right panel). Results represent the data from one experiment, and numbers represent biological replicates for each treatment (n = 4).
Representative flow cytometry plots showing the relative surface density for B220 (CD45R) after 4 days of stimulation with LPS either in the presence of DOT1L inhibitor, Pinometostat or DMSO as a control (left panel) and statistical analysis of MFI of B220 for each treatment (right panel). Results represent the data from one experiment, and numbers represent biological replicates for each treatment (n = 4).
Representative histograms showing the relative surface density for CD19 on total live cells after 4 days of stimulation with LPS (left panel) and statistical analysis of MFI of CD19 for each treatment (right panel). Results represent the data from one experiment, and numbers represent biological replicates for each treatment (n = 4).
- A
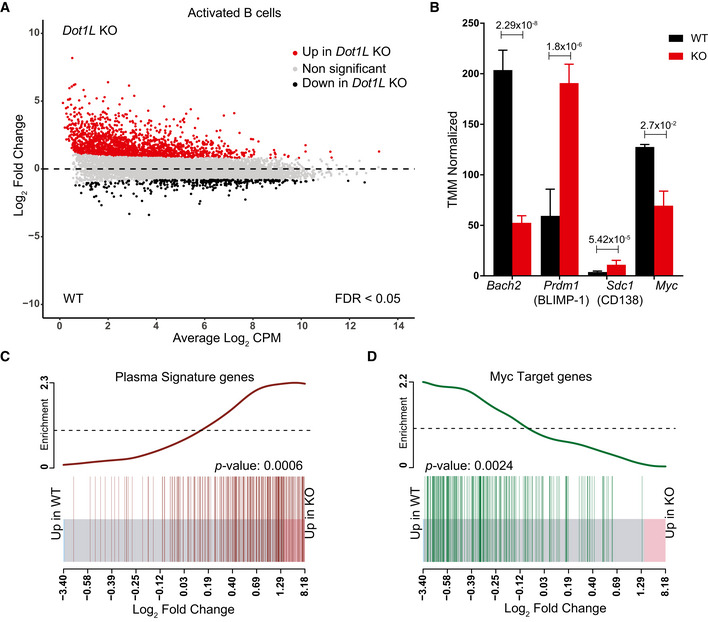
MA‐Plot of normalized RNA‐Seq data generated from three independent biological replicates for each genotype showing differential (false discovery rate (FDR) < 0.05) expression of genes between Dot1L‐KO and WT B cells after 2 days of in vitro activation with LPS + IL‐4.
- B
Differential (FDR < 0.05) expression of Bach2, Prdm1 (encoding BLIMP‐1), Cd138 (a plasma cell marker), and Myc transcripts as indicated by counts per million after TMM normalization from WT and KO. Data were generated from three independent biological replicates for each genotype. Bars and error bars indicate mean ± SD. Statistical significance is indicated by FDR after the Benjamini–Hochberg multiple testing correction performed by edgeR package using R language.
- C, D
Enrichment of plasma cell signature genes in KO as compared to WT‐activated B cells (C) and Enrichment of MYC‐target genes in WT as compared to KO‐activated B cells (D). Enrichment of gene sets is depicted by a BARCODE plot; P‐value calculated via FRY test show the statistical significance of enrichment of each gene set. A P‐value less than 0.05 was considered as significant.
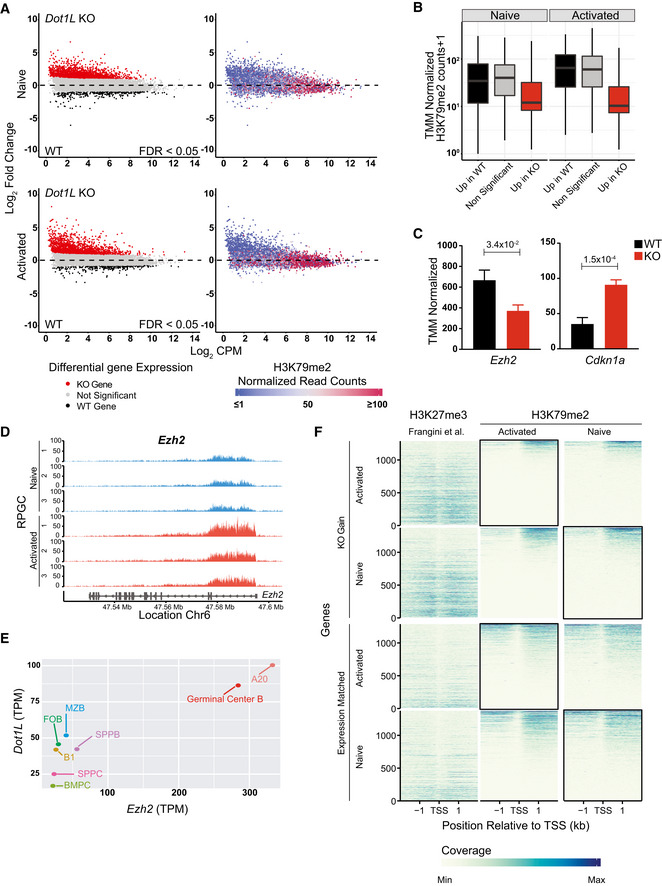
Integrative analyses of differentially (FDR < 0.05) expressed transcripts from naïve and activated Dot1L‐deficient B cells (left panel) with H3K79me2 ChIP values from WT naïve and activated B cells (right panel).
The distribution of mean H3K79me2 among different gene sets (6A, left panel) from activated and naïve B cells depicted by box plots. Boxes in Box plot indicate Inter quartile range (IQR) and whiskers show 1.5 IQR of highest and lowest quartile. Central horizontal line within the bars represent median of the TMM normalized H3K79me2 counts + 1 values of the respective genes for each condition. Results represent the data generated from three biological replicates for each group.
Differential (FDR < 0.05) expression of Ezh2 and Cdkn1a as indicated by counts per million after TMM normalization from WT and Dot1L‐KO‐activated B cells. Data were generated from three independent biological replicates for each genotype. Bars and error bars indicate mean ± SD. Statistical significance is indicated by FDR after the Benjamini–Hochberg multiple testing correction performed by edgeR package using R language.
H3K79me2 methylation at the Ezh2 locus from WT activated and naïve B cells, as determined by reads per genomic content (RPGC). Data represent three independent biological replicates.
Correlation between expression of Ezh2 and Dot1L as depicted by TPM in different mature B‐cell subsets; B1: B1 cells, MZB: marginal Zone B, FOB: follicular B, GCB: germinal Center B, SPLPB: spleen plasma blast, SPLPC: spleen plasma cells) and Bone Marrow (BMPC: Bone marrow plasma cells) A20: Germinal Center like cell lymphoma cell line. Correlation shown by scatter plot.
Coverage plot of H3K27me3 from naïve B cells (Frangini et al, 2013) and H3K79me2 (from WT‐activated and naïve B cells) flanking 4 kb around transcriptional start sites (TSS) for genes upregulated in KO (KO Gain) or non‐differential Expression‐matched genes. Coverage was calculated as reads per genomic content cutoff at the 0.995th quantile and rescaled to a maximum of 1. Black boxes indicate the relavant B‐cell population for comparing the distribution of H3K27me3 and H3K79me2 for the indicated gene sets obtained from the differential gene expression analysis of Dot1L‐proficient and deficient B cells.
References
-
- Bao Y, Cao X (2016) Epigenetic control of B cell development and B‐cell‐related immune disorders. Clin Rev Allergy Immunol 50: 301–311 - PubMed
-
- Beguelin W, Teater M, Gearhart MD, Calvo Fernandez MT, Goldstein RL, Cardenas MG, Hatzi K, Rosen M, Shen H, Corcoran CM et al (2016) EZH2 and BCL6 cooperate to assemble CBX8‐BCOR complex to repress bivalent promoters, mediate germinal center formation and lymphomagenesis. Cancer Cell 30: 197–213 - PMC - PubMed
Publication types
MeSH terms
Substances
Associated data
- Actions
- Actions
LinkOut - more resources
Full Text Sources
Other Literature Sources
Molecular Biology Databases
Miscellaneous
