

Evaluation of a Home-Printable Vision Screening Test for Telemedicine
- PMID: 33410910
- PMCID: PMC7791401
- DOI: 10.1001/jamaophthalmol.2020.5972
Evaluation of a Home-Printable Vision Screening Test for Telemedicine
Abstract
Importance: Many ophthalmology appointments have been converted to telemedicine assessments. The use of a printed vision chart for ophthalmology telemedicine appointments that can be used by people who are excluded from digital testing has yet to be validated.
Objectives: To evaluate the repeatability of visual acuity measured using the Home Acuity Test (HAT) and the agreement between the HAT and the last in-clinic visual acuity.
Design, setting, and participants: This diagnostic study was conducted from May 11 to 22, 2020, among 50 control participants and 100 adult ophthalmology outpatients who reported subjectively stable vision and were attending routine telemedicine clinics. Bland-Altman analysis of corrected visual acuity measured with the HAT was compared with the last measured in-clinic visual acuity on a conventional Early Treatment Diabetic Retinopathy Study logMAR chart.
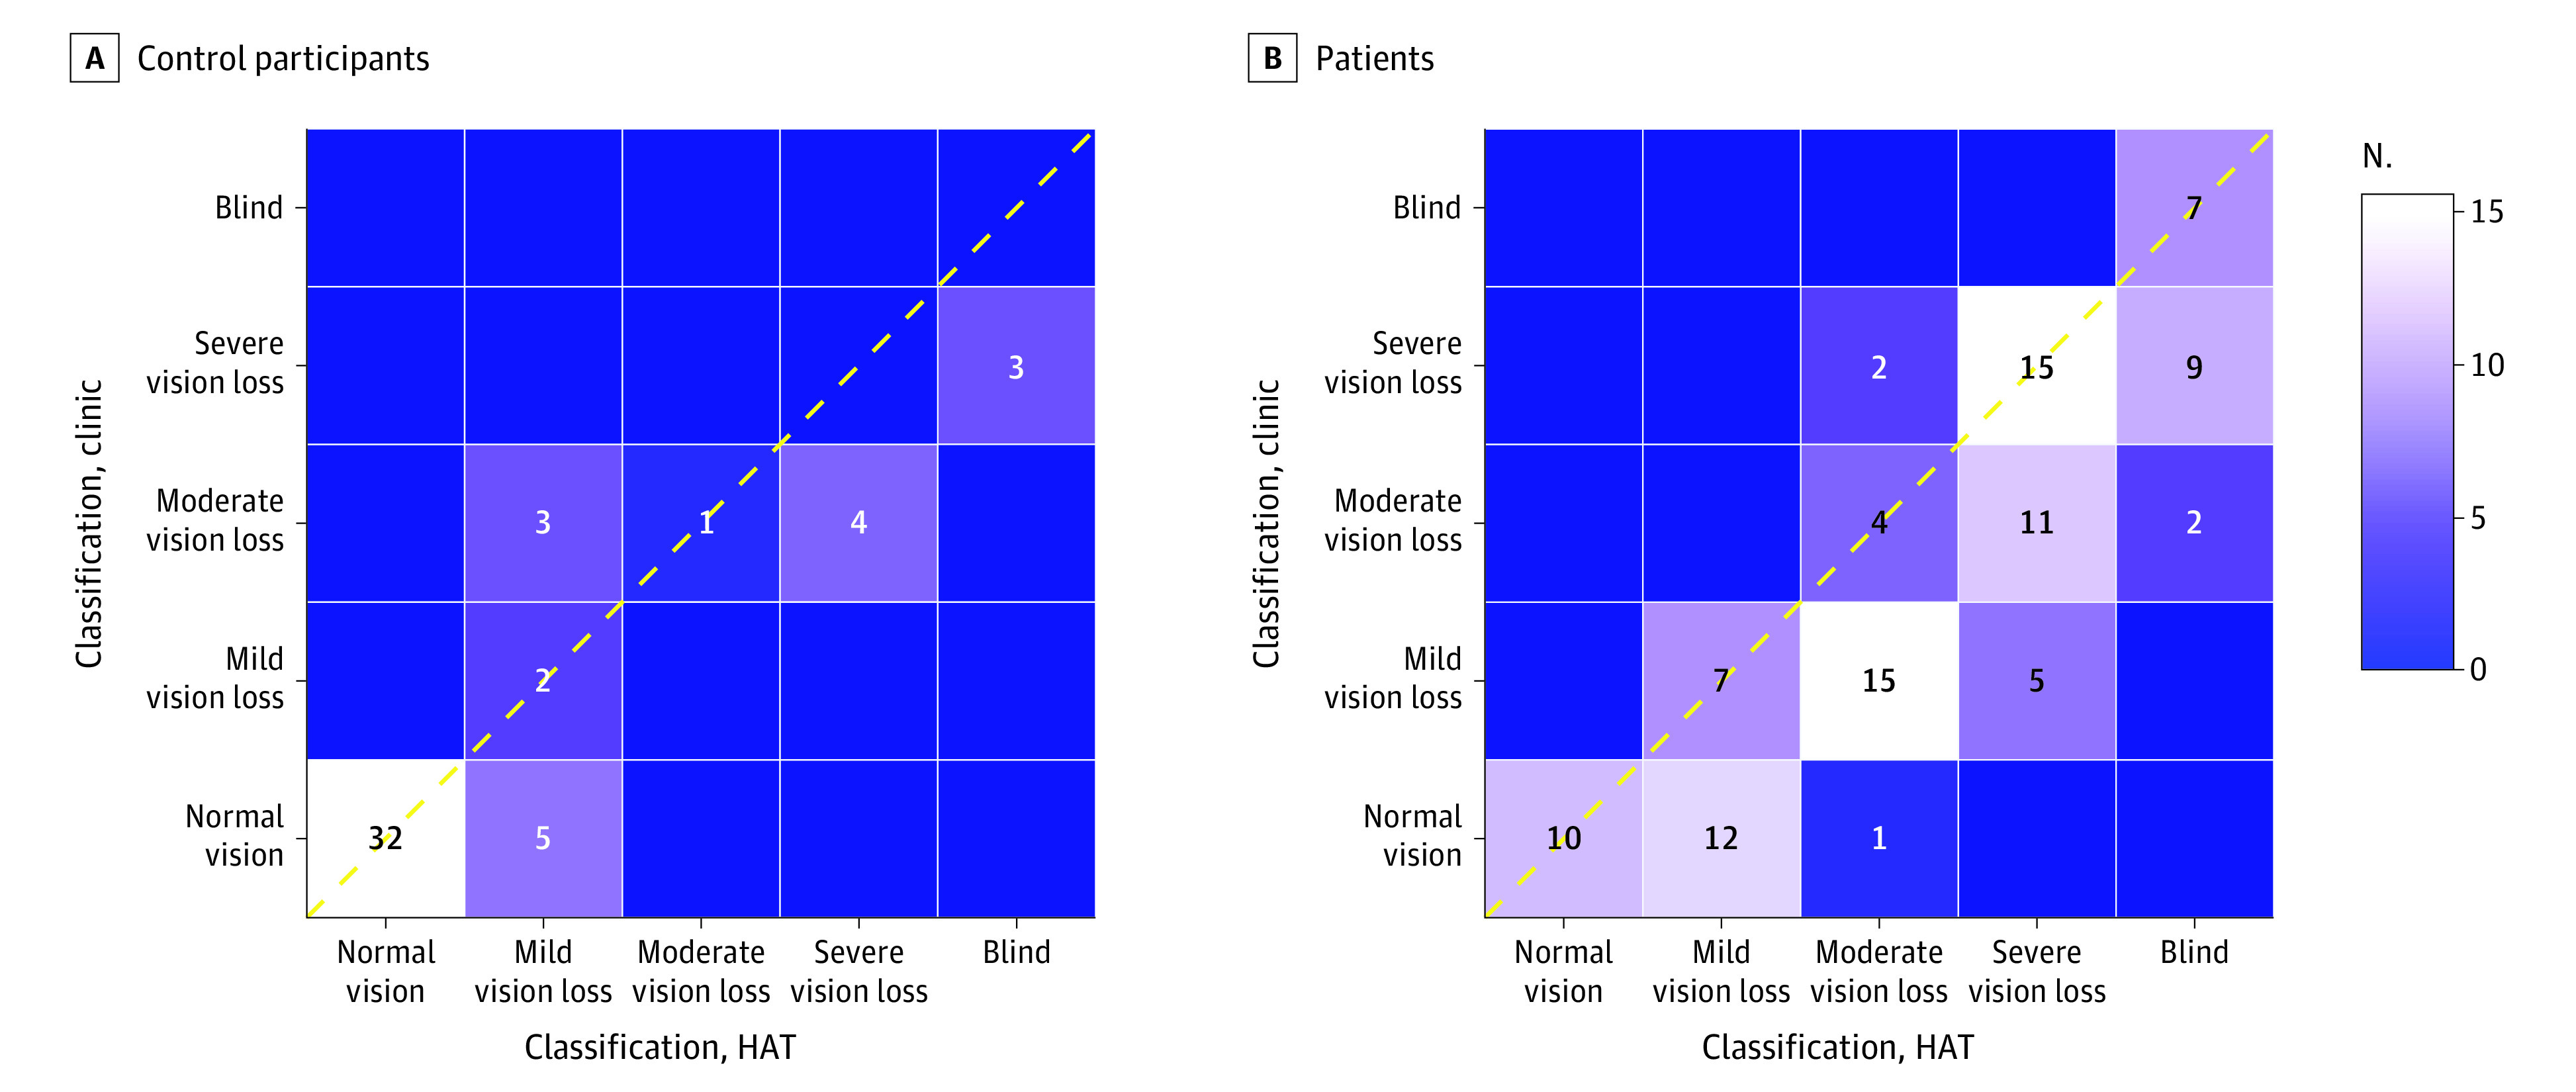
Main outcomes and measures: For control participants, repeatability of the HAT and agreement with standard logMAR visual acuity measurement. For ophthalmology outpatients, agreement with the last recorded in-clinic visual acuity and with the International Classification of Diseases and Related Health Problems, 11th Revision visual impairment category.
Results: A total of 50 control participants (33 [66%] women; mean [SD] age, 36.0 [10.8] years) and 100 ophthalmology patients with a wide range of diseases (65 [65%] women; mean [SD] age, 55.3 [22.2] years) were recruited. For control participants, mean (SD) test-retest difference in the HAT line score was -0.012 (0.06) logMAR, with limits of agreement (LOA) between -0.13 and 0.10 logMAR. The mean (SD) difference in visual acuity compared with conventional vision charts was -0.14 (0.14) logMAR (range, -0.4 to 0.18 log MAR) (-7 letters) in controls, with LOA of -0.41 to 0.12 logMAR (-20 to 6 letters). For ophthalmology outpatients, the mean (SD) difference in visual acuity was -0.10 (0.17) logMAR (range, -0.5 to 0.3 logMAR) (1 line on a conventional logMAR sight chart), with the HAT indicating poorer visual acuity than the previous in-clinic test, and LOA of -0.44 to 0.23 logMAR (-22 to 12 letters). There was good agreement in the visual impairment category for ophthalmology outpatients (Cohen κ = 0.77 [95% CI, 0.74-0.81]) and control participants (Cohen κ = 0.88 [95% CI, 0.88-0.88]).
Conclusions and relevance: This study suggests that the HAT can be used to measure visual acuity by telephone for a wide range of ophthalmology outpatients with diverse conditions. Test-retest repeatability is relatively high, and agreement in the visual impairment category is good for this sample, supporting the use of printed charts in this context.
Conflict of interest statement
Figures


Similar articles
-
Validation of Home Visual Acuity Tests for Telehealth in the COVID-19 Era.JAMA Ophthalmol. 2022 May 1;140(5):465-471. doi: 10.1001/jamaophthalmol.2022.0396. JAMA Ophthalmol. 2022. PMID: 35357405 Free PMC article. Clinical Trial.
-
Development and Validation of a Smartphone-Based Visual Acuity Test (Peek Acuity) for Clinical Practice and Community-Based Fieldwork.JAMA Ophthalmol. 2015 Aug;133(8):930-7. doi: 10.1001/jamaophthalmol.2015.1468. JAMA Ophthalmol. 2015. PMID: 26022921 Free PMC article.
-
Comparing distance visual acuity measurement with a novel eye chart and the Landolt C chart in a population of children aged 6-18 years.Int Ophthalmol. 2017 Dec;37(6):1345-1348. doi: 10.1007/s10792-016-0384-3. Epub 2016 Nov 8. Int Ophthalmol. 2017. PMID: 27826937
-
Is your vision blurry? A systematic review of home-based visual acuity for telemedicine.J Telemed Telecare. 2023 Feb;29(2):81-90. doi: 10.1177/1357633X20970398. Epub 2020 Nov 22. J Telemed Telecare. 2023. PMID: 33222600
-
A history of visual acuity testing and optotypes.Eye (Lond). 2024 Jan;38(1):13-24. doi: 10.1038/s41433-022-02180-6. Epub 2022 Aug 3. Eye (Lond). 2024. PMID: 35922542 Free PMC article. Review.
Cited by
-
Comparing Home- and Clinic-Based Visual Acuity Testing.JAMA Ophthalmol. 2022 Oct 1;140(10):1021-1022. doi: 10.1001/jamaophthalmol.2022.3182. JAMA Ophthalmol. 2022. PMID: 35980620 Free PMC article.
-
Web-based visual acuity testing for children.J AAPOS. 2022 Apr;26(2):61.e1-61.e5. doi: 10.1016/j.jaapos.2021.11.007. Epub 2021 Dec 15. J AAPOS. 2022. PMID: 34920136 Free PMC article.
-
Current perspectives in tackling glaucoma blindness.Indian J Ophthalmol. 2025 Mar 1;73(Suppl 2):S189-S196. doi: 10.4103/IJO.IJO_3280_23. Epub 2025 Feb 21. Indian J Ophthalmol. 2025. PMID: 39982079 Free PMC article. Review.
-
The Impact of the First Peak of the COVID-19 Pandemic on a Paediatric Ophthalmology Service in the United Kingdom: Experience from Alder Hey Children's Hospital.Br Ir Orthopt J. 2021 Mar 25;17(1):56-61. doi: 10.22599/bioj.164. eCollection 2021. Br Ir Orthopt J. 2021. PMID: 34278219 Free PMC article.
-
Comparing a Home Vision Self-Assessment Test to Office-Based Snellen Visual Acuity.Clin Ophthalmol. 2021 Jul 28;15:3205-3211. doi: 10.2147/OPTH.S309727. eCollection 2021. Clin Ophthalmol. 2021. PMID: 34349497 Free PMC article.
References
-
- NHS Digital . Hospital outpatient activity 2018-19. Accessed June 5, 2020. https://digital.nhs.uk/data-and-information/publications/statistical/hos...
-
- Royal College of Ophthalmologists . Management of ophthalmology services during the Covid pandemic. Accessed May 29, 2020. https://www.rcophth.ac.uk/wp-content/uploads/2020/03/RCOphth-Management-...
MeSH terms
LinkOut - more resources
Full Text Sources
Other Literature Sources
Medical
