Published Erratum
. 2020 Sep;34(9):13066-13068.
doi: 10.1096/fsb2.20812.

Correction

No authors listed
Published Erratum

Correction

No authors listed. FASEB J. 2020 Sep.
No abstract available


Figures

Figure 2
Figure 2
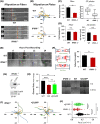
Loss of IPMK reduces cell migration. A, Time lapse images showing MEF WT migrating faster than IPMK2/2 cells on aligned nanofibers. Red dashed line indicates starting position and yellow dashed line indicates the current location of the centroid of the cell at the indicated time. B, Cells were plated on fibronectin‐coated MatTek glass‐bottom plates as indicated in Materials and Methods and imaged at 2‐min intervals. Individual cells were tracked using CellTracker v.1.1, and positions were normalized to the origin and are presented as rose plots. Results are representative of at least three experiments tracking 40‐50 cells for each cell type. C, Quantification of velocity data from A and B. Fiber scaffold experiments are averaged data from 20 cells (error bars = SE); 2D experiments are averaged data from 40 to 50 cells. D, Quantification of cell area data from A and B. Fiber scaffold experiments are averaged data from 20 cells (error bars = SE); 2D experiments are averaged data from 100 cells. NS, not statistically significant. E, MEF cells were grown in 12‐well plates and manually scratched with a pipette tip. Cell images were taken at indicated times, and the cell front is marked by a white line, whereas the migration progress is indicated by a colored line (orange = 6 hours, blue = 12 hours, green = 24 hours). The distance traveled between two time points was measured using ImageJ and is indicated in each panel. No measurement indicates gap closure. F, Schematic representation of the pull to failure experiments to measure the adhesion strength. MEF IPMK−/− cells have significantly lower adhesion strength compared with MEF WT cells; n = 14 for WT and n = 16 for IPMK−/−. G, Integrin β1 was overexpressed in MEF IPMK−/− cells and its expression was confirmed by immunoblotting. H, Scratch assays were performed as described in E, and cells were imaged every 5 minutes for 4‐8 hours as indicated in Materials and Methods. Gap closure rates were determined normalized to WT controls. Combined data from four experiments; n = 14 for each cell type. I, Rose plots of cell tracking data from IPMK−/− and IPMK−/− cells stably expressing β1 integrin‐GFP as described in B. Representative of two experiments, n = 50 cells for each cell type. J, Violin plot showing the distribution density of migration velocities for WT (black), IPMK−/− (red), and IPMK−/− + β1GFP (green) shows that IPMK loss decreases migration velocity, which is partially rescued by addback of integrin β1; n = 42‐58 cells for each cell type. Combined data from three experiments. NS, not significant. *P < .05, **P < .01, ***P < .001
Figure 3
Figure 3
IPMK regulates the adhesion signaling network. A, MEF cells were harvested and cell lysates were subjected to immunoblotting. B, Expression of various adhesion molecule mRNA was detected by real‐time qPCR. Data were pooled from at least six independent determinations, each in triplicate. C, A luciferase construct containing integrin (Int)β1 promoter region was expressed in either WT or IPMK−/− MEF cells, and a luciferase reporter assay was performed. Data were pooled from at least three independent determinations, each in triplicate. D, E, Immunoblotting was performed on cell lysates. F, The proportion of finger‐like protrusions increases while the number of broad lamellae decrease in IPMK−/− cells; n = 67 cells for each cell type. G, Mature protrusion length in WT and IPMK−/− cells extending onto 500‐nm round nanofibers; n = 30 for each cell type (error bars = SE). Cartoon representation illustrates cells extending protrusions on fibers. The center of the ellipse denotes the base of the protrusion. H, Schematic representation of contractile forces measured using NFM. The forces reported here are the sum of the magnitudes of all the resultant force vectors. The force vectors are directed along the major stress fiber angles as shown by immunofluorescent images; red denotes f‐actin and green denotes paxillin. Scale bars, 10 µm. MEF IPMK−/− cells had statistically significant lower forces than MEF WT cells; n = 22 for WT and n = 14 for IPMK−/− cells (error bars = SE). The most representative images from at least five independent assays are presented. *P < .05

Erratum for

Publication types

LinkOut - more resources