

ALK ligand ALKAL2 potentiates MYCN-driven neuroblastoma in the absence of ALK mutation
- PMID: 33411331
- PMCID: PMC7849294
- DOI: 10.15252/embj.2020105784
ALK ligand ALKAL2 potentiates MYCN-driven neuroblastoma in the absence of ALK mutation
Abstract
High-risk neuroblastoma (NB) is responsible for a disproportionate number of childhood deaths due to cancer. One indicator of high-risk NB is amplification of the neural MYC (MYCN) oncogene, which is currently therapeutically intractable. Identification of anaplastic lymphoma kinase (ALK) as an NB oncogene raised the possibility of using ALK tyrosine kinase inhibitors (TKIs) in treatment of patients with activating ALK mutations. 8-10% of primary NB patients are ALK-positive, a figure that increases in the relapsed population. ALK is activated by the ALKAL2 ligand located on chromosome 2p, along with ALK and MYCN, in the "2p-gain" region associated with NB. Dysregulation of ALK ligand in NB has not been addressed, although one of the first oncogenes described was v-sis that shares > 90% homology with PDGF. Therefore, we tested whether ALKAL2 ligand could potentiate NB progression in the absence of ALK mutation. We show that ALKAL2 overexpression in mice drives ALK TKI-sensitive NB in the absence of ALK mutation, suggesting that additional NB patients, such as those exhibiting 2p-gain, may benefit from ALK TKI-based therapeutic intervention.
Keywords: 2p-gain; ALK; ALKAL; MYCN; neuroblastoma.
© 2021 The Authors. Published under the terms of the CC BY 4.0 license.
Conflict of interest statement
The authors declare that they have no conflict of interest.
Figures
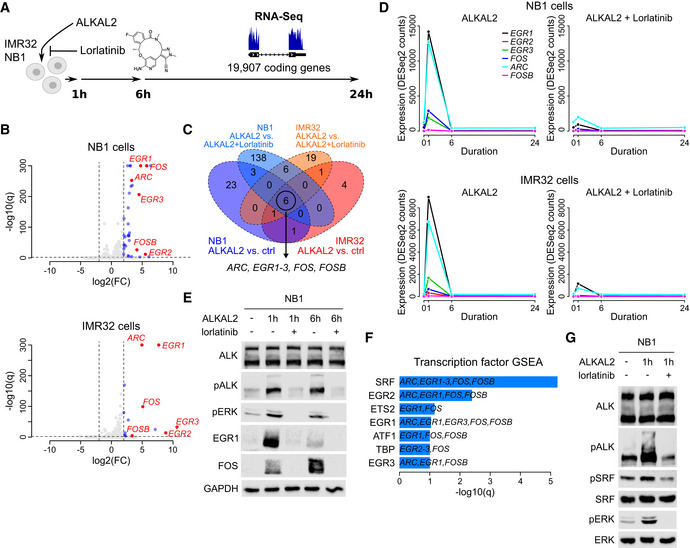
RNA‐Seq‐based differential gene expression (DE) was measured in NB1 and IMR32 NB cell lines in response to ALKAL2 stimulation. See Table EV1 for detailed results.
Volcano plot showing DE 1 h after NB1 (top) and IMR32 (bottom) cell treatment with ALKAL2. Dashed lines show DE thresholds. Up‐/downregulated genes indicated in blue. Six genes that are DE in both cell lines and sensitive to the ALK inhibitor lorlatinib are indicated and labelled in red.
Venn diagram indicating the number of DE genes between different conditions as indicated. Outer circles (labels below diagram) indicate the number of DE genes after ALKAL2 addition for NB1 cells (34 genes) and IMR32 cells (13 genes). Inner circles (labels on top) correspond to the number of DE genes after addition of lorlatinib. Six genes that are DE in both cell lines and sensitive to lorlatinib are indicated.
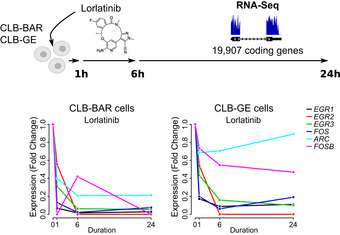
Temporal dynamics of ALKAL2‐induced transcription of ARC, EGR1‐3, FOS and FOSB in NB1 and IMR32 cells in the presence and absence of lorlatinib, as indicated.
Immunoblot validation of ALKAL2 induction of EGR1 and FOS at the protein level in NB1 cells. Cells were treated for 0, 1 and 6 h in the presence and absence of lorlatinib as indicated.
Transcription factor prediction based on a gene set enrichment analysis (GSEA) of the identified six‐gene set. Bar plot shows the log10(q) values of all enriched transcription factors at 10% FDR.
Immunoblot analysis of ALKAL2 induction of pSRF in NB1 cells. Cells were treated for 0 and 1 h in the presence and absence of lorlatinib as indicated.
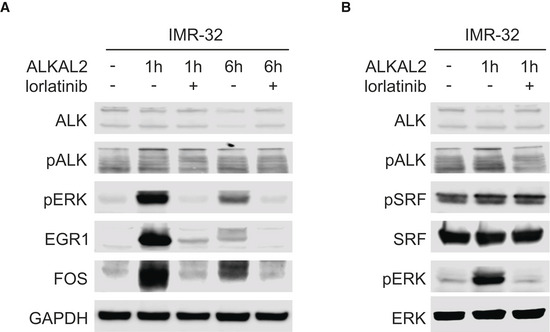
IMR32 cells were treated for 0, 1 and 6 h in the presence and absence of lorlatinib as indicated. Lysates were immunoblotted for EGR1 and FOS, as well as pERK as readout of ALKAL2‐induced ALK signalling.
IMR32 cells were treated for 0 or 1 h in the presence and absence of lorlatinib as indicated. Lysates were immunoblotted for pSRF and SRF, as well as pERK as readout of ALKAL2‐induced ALK signalling.
- A
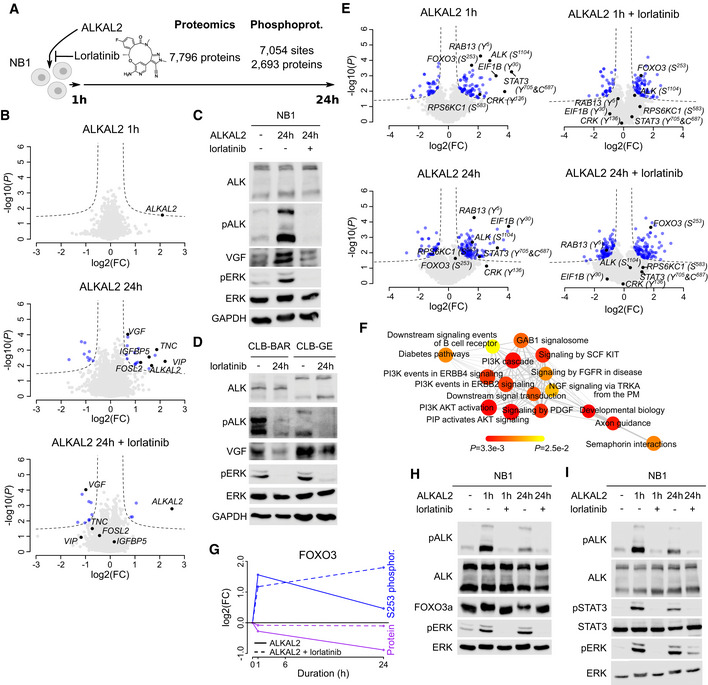
Differential protein expression and phosphorylation was determined in NB1 cells in response to ALKAL2 stimulation. See Table EV2 for detailed results.
- B
Volcano plots showing differential protein expression 1 and 24 h after ALKAL2 in the presence or absence of lorlatinib stimulation as indicated. Dashed lines indicate differential expression thresholds. Differentially expressed proteins indicated in blue. Most pronounced responding proteins indicated in black and labelled.
- C, D
Immunoblot analysis of VGF protein in NB cells. (C) NB1 cells after 24 h stimulation with ALKAL2 in the presence or absence of lorlatinib. (D) CLB‐BAR and CLB‐GE cells after 24 h inhibition with lorlatinib.
- E
Volcano plots showing differential phosphorylation. Labelling colours as in (B).
- F
GSEA network graph with nodes representing the enriched reactome pathways (at 25% FDR). Node sizes correlate to the normalized enrichment scores, node colours indicate P values (as in colour legend), and edge widths correspond to the number of overlapping genes between the connected nodes.
- G
Graphical representation of FOXO3 dynamics, indicating S253 phosphorylation and total FOXO3 protein levels in response to ALKAL2 stimulation, in the presence or absence of lorlatinib.
- H, I
Immunoblot validation of FOXO3a and STAT3 in response to ALKAL2 stimulation in the presence or absence of lorlatinib as indicated. The slower migrating FOXO3a band in SDS–PAGE in (H) likely reflects FOXO3a phosphorylation that is not seen in the presence of lorlatinib.
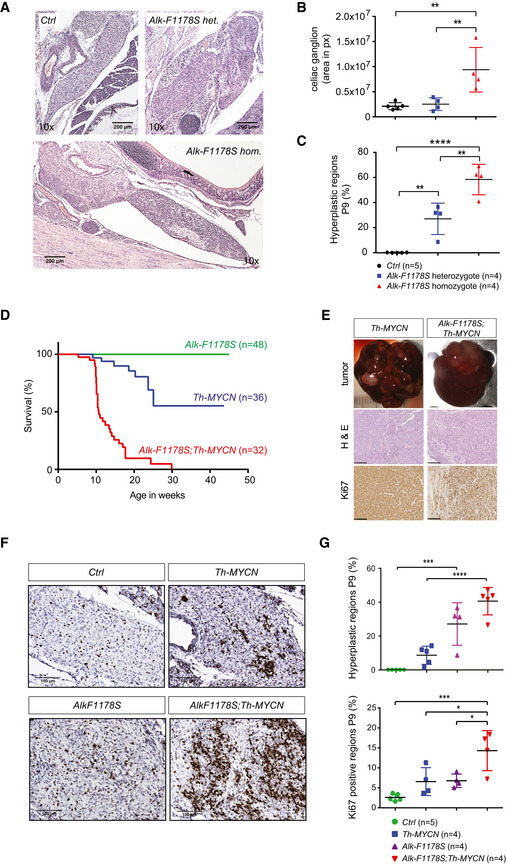
Haematoxylin and eosin staining of longitudinal sections of P9 pups at the central part of the left caeliac ganglion.
Quantification of the area of caeliac ganglia cross sections. Largest sections from the central part of left caeliac ganglions of different individuals were chosen for the analysis. **P < 0.01, one‐way ANOVA followed by Tukey multiple comparison test. Data shown represent mean ± SD.
Hyperplasia quantification in central sections of P9 left caeliac ganglions shown as a per cent of hyperplastic regions areas per ganglion cross section. **P < 0.01, ****P < 0.0001, one‐way ANOVA followed by Tukey multiple comparison test. Data shown represent mean ± SD.
Kaplan–Meier survival curve of mice resulting from intercrosses of Th‐MYCN hemizygotes and Alk‐F1178S heterozygote mice (P < 0.0001; log‐rank test). Wild‐type littermates were excluded.
Gross appearance, haematoxylin and eosin as well as Ki67‐stained sections of representative Th‐MYCN and Alk‐F1178S;Th‐MYCN tumours. Scale bars indicate 250 μm.
Ki67 immunohistochemical staining of P9 caeliac ganglia in mice of the indicated genotype (quantified in G).
Quantification of hyperplastic areas (shown as per cent of hyperplastic regions per ganglion cross section) and Ki67 expression (shown as positive for Ki67 staining areas per total area of the section through the ganglion central part at P9). (*P < 0.05, ***P < 0.001, ****P < 0.0001, one‐way ANOVA followed by Tukey multiple comparison test. Data shown represent mean ± SD).
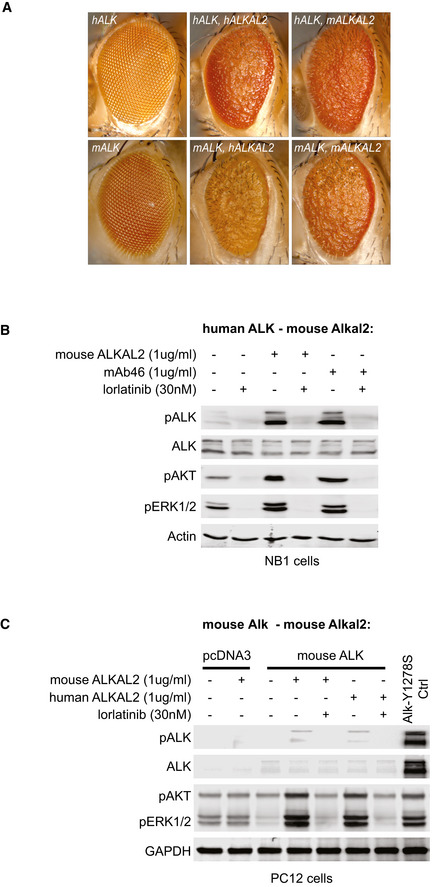
Ectopic expression of human ALK and ALKAL2 in the Drosophila eye leads to astrong rough eye phenotype, similar to overexpression of mouse ALK and ALKAL2. Ectopic expression of different mouse/human ALK and ALKAL2 combinations also lead to rough eye phenotypes, indicating ALK activity.
Endogenous ALK present in NB1 cells is activated upon ALKAL2 stimulation, and responds to lorlatinib treatment. Non‐stimulated cells were used as negative controls, cells stimulated with mAb46 were used as positive controls.
PC12 cells ectopically expressing mouse ALK were stimulated by addition of recombinant human ALKAL2 or mouse ALKAL2. Cells expressing human ALK‐Y1278S were used as positive control, cells transfected with the empty pcDNA3 vector were used as negative controls.
- A
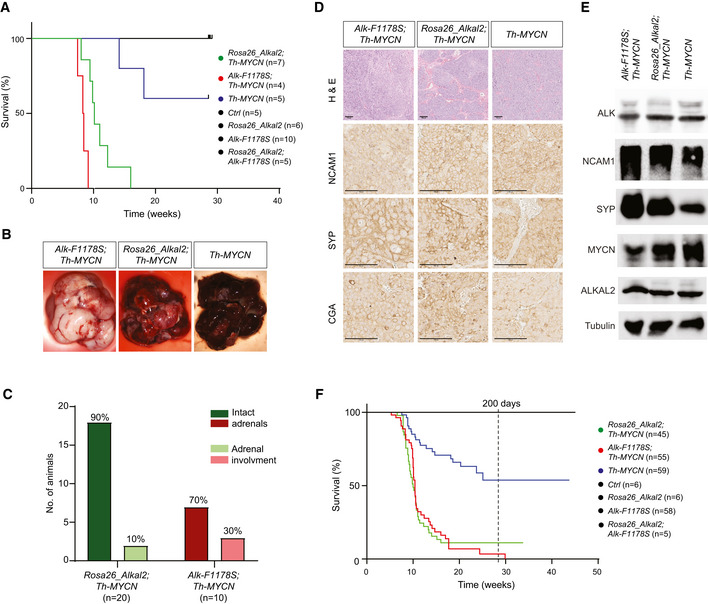
The oncogenic activity of MYCN is potentiated by overexpression of ALKAL2. Kaplan–Meier survival curves for Rosa26_Alkal2;Th‐MYCN, Alk‐F1178S;Th‐MYCN and Th‐MYCN mice. Also shown are Rosa26_Alkal2N, Alk‐F1178S and control (Ctrl) mice. Comparison of survival of Th‐MYCN alone and Rosa26_Alkal2;Th‐MYCN curves showed a significant difference (P = 0.003; log‐rank test).
- B–E
Tumours harvested from Rosa26_Alkal2;Th‐MYCN, Alk‐F1178S;Th‐MYCN and Th‐MYCN mice express NB markers. Tumours from all three genotypes were large, in most cases filling the abdominal cavity (B). Dissection post‐mortem revealed that the majority of Rosa26_Alkal2;Th‐MYCN (18/20) and Alk‐F1178S;Th‐MYCN (7/10) tumours did not involve the adrenal glands (C). Histological examination of Rosa26_Alkal2;Th‐MYCN, Alk‐F1178S;Th‐MYCN and Th‐MYCN tumours revealed positive staining for NCAM1, synaptophysin (SYP) and Chromogranin A (CGA) (D) that was confirmed for NCAM1 and SYP along with MYCN, ALK and ALKAL2 by immunoblotting (E). Scale bars indicate 100 μm. Immunoblots are representative of three independent technical analyses.
- F
Accumulated Kaplan–Meier survival curves are shown for all monitored Rosa26_Alkal2;Th‐MYCN, Alk‐F1178S;Th‐MYCN and Th‐MYCN mice over time, estimating tumour penetrance (P < 0.001; log‐rank test).
- A
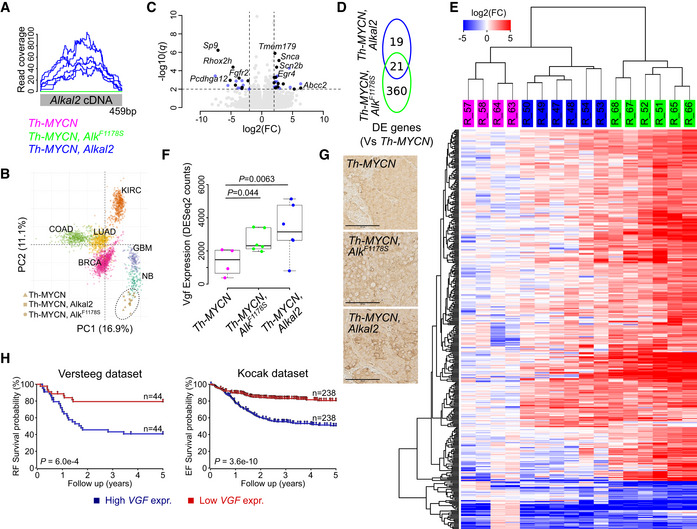
Read coverage of the codon‐optimized Alkal2 transgene, confirming Alkal2 expression in Alkal2 tumours.
- B
Principal component (PC) analysis of the expression signature of human neuroblastoma (NB) and five other human cancers (BRCA: breast adenocarcinoma; COAD: colon adenocarcinoma; LUAD: lung adenocarcinoma; KIRC: kidney renal clear cell carcinoma; GBM: glioblastoma multiforme) with mice tumour samples mapped independently using PC coordinates. MYCN amplified NB samples are indicated by circles, and non‐amplified samples are indicated by squares.
- C, D
Volcano plot showing differential expression (DE) between Alkal2 and MYCN tumours. Differentially expressed genes are shown in blue (DE in Alkal2 tumours only) or black (DE in both Alkal2 and AlkF1174S tumours, as shown in [D]). Top ranked genes labelled. Dashed lines represent DE cut‐offs.
- E
DE heatmap based on unsupervised hierarchical clustering of 400 DE genes (rows) and 16 samples (columns, as indicated on top). Sample colour legend as in (A). Colour key shown on top left.
- F
Boxplot showing Vgf expression in the three tumour types as indicated. Box plots indicate median values and lower/upper quartiles with whiskers extending to 1.5 times the interquartile range. P values calculated using Wald test as reported by DESeq2.
- G
Histological examination of Th‐MYCN, Rosa26_Alkal2;Th‐MYCN and Alk‐F1178S;Th‐MYCN tumours revealing positive staining for VGF. Scale bars indicate 100 μm.
- H
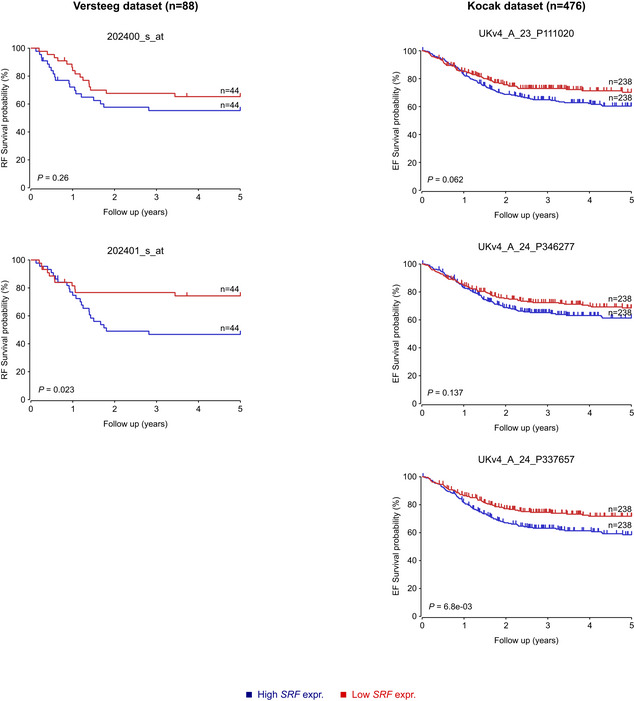
Kaplan–Meier relapse‐free (RF) and event‐free (EF) survival probability curves from two different NB cohorts, the Versteeg 88 cohort (left panel) and the Kocak 649 cohort (right panel), as derived from the R2 platform. Patients with higher VGF expression are highlighted in blue, whereas patients with lower expression are highlighted in red. The log‐rank test P values are indicated.
- A
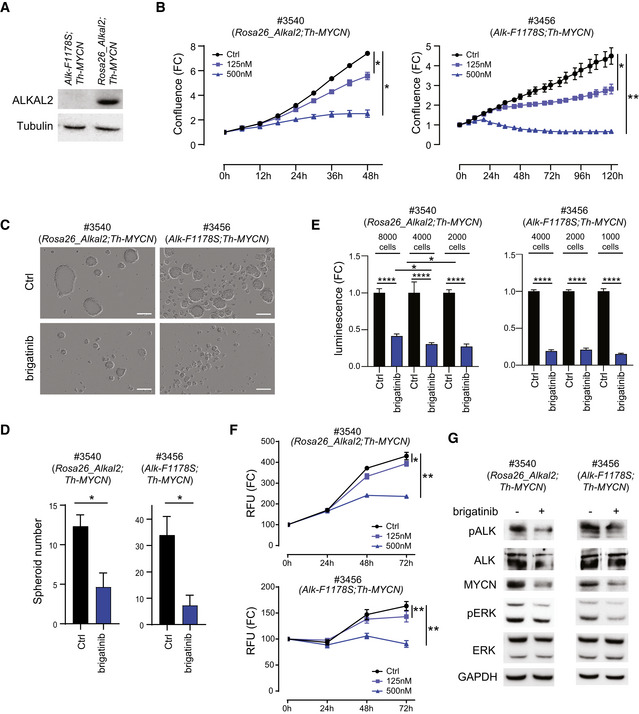
Alkal2 expression in cells derived from Rosa26_Alkal2;Th‐MYCN (#3540) and Alk‐F1178S;Th‐MYCN (#3456) NB. Immunoblotting analysis for ALKAL2 and tubulin in the indicated mouse NB cell lines. Whole cell lysates (30 μg) were analysed in each lane.
- B
The effect of increasing concentrations of brigatinib on cell confluence was analysed by IncuCyte Live Cell Analysis of both Rosa26_Alkal2;Th‐MYCN (#3540) and Alk‐F1178S;Th‐MYCN (#3456) cell lines. Data are presented as mean ± SEM from three independent experiments. *P < 0.05, **P < 0.005; two‐tailed paired Student's t‐test.
- C, D
Brigatinib suppressed tumour spheroid formation and spheroid viability. Cells (#3456 or #3540) were treated with brigatinib (0, 150 nM) for 4 days in ultra‐low attachment plates. The spheroid number was analysed by IncuCyte Live Cell Analysis. Data are presented as means ± SEM from three independent experiments. *P < 0.05, two‐tailed unpaired Student's t‐test. Scale bar (C) is 200 μm.
- E
Tumour spheroids formed from either Rosa26_Alkal2;Th‐MYCN (#3540) or Alk‐F1178S;Th‐MYCN (#3456) were formed at indicated cell number in ultra‐low attachment plates for 3 days and followed by brigatinib (0 or 150 nM) for 10 days. Inhibitor was re‐fed every other day. Cell viability was determined by CellTiter‐Glo 3D cell viability kit and data are presented as mean ± SEM from five independent experiments. *P < 0.05, ****P < 0.0001, two‐tailed unpaired Student's t‐test.
- F
Cell viability. Mouse tumour‐derived cell lines #3540 (Rosa26_Alkal2;Th‐MYCN) and #3456 (Alk‐F1178S;Th‐MYCN) were treated with brigatinib (125 or 500 nM), and viability was evaluated by using a resazurin‐based assay. Data are presented as mean ± SEM from three independent experiments. *P < 0.05, **P < 0.005; two‐tailed paired student t‐test.
- G
Brigatinib treatment (0 or 150 nM) for 6 h resulted in inhibition of ALK phosphorylation, and of activation of downstream signalling (ERK1/2), as well as MYCN expression. Cell lysates (Rosa26_Alkal2;Th‐MYCN (#3540) and Alk‐F1178S;Th‐MYCN (#3456)) were immunoblotted with the indicated antibodies.
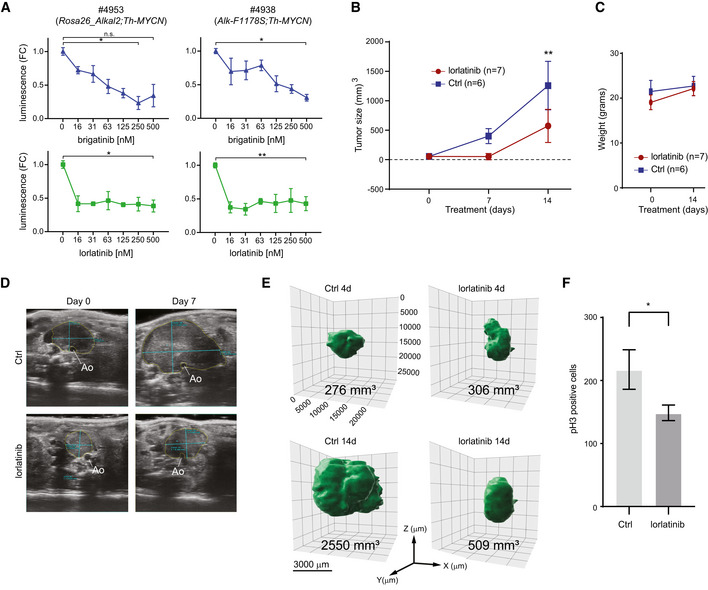
Cells derived from tumours arising in Rosa26_Alkal2;Th‐MYCN (#4953) and Alk‐F1178S;Th‐MYCN (#4938) mice are sensitive to both lorlatinib and brigatinib. The effect of increasing concentrations of each ALK TKI (as indicated) on cell confluence was analysed by IncuCyte Live Cell Analysis. Data are presented as mean ± SEM from three independent experiments. *P < 0.05, **P < 0.005; two‐tailed paired Student's t‐test.
Tumour volume changes over time for Rosa26_Alkal2;Th‐MYCN mice treated with lorlatinib (10 mg/kg; twice daily) or vehicle control. Tumour volume was measured by ultrasound on Days 0 and 7, and by direct measurement at Day 14. Day 0 (lorlatinib n = 7, Ctrl n = 6), Day 7 (lorlatinib n = 2, Ctrl n = 5) and Day 14 (lorlatinib n = 7, Ctrl n = 6). Data shown represent mean ± SD. **P < 0.005; two‐tailed unpaired Student's t‐test.
Rosa26_Alkal2;Th‐MYCN animals treated with lorlatinib did not display any significant loss of body weight compared with vehicle controls. Data shown represent mean ± SD.
Representative ultrasound images of tumours observed in Rosa26_Alkal2;Th‐MYCN mice with annotated measurements at Day 0 and Day 7. Tumours arise in the retroperitoneal space ventral to the aorta, Ao.
Representative MRI imaging of Rosa26_Alkal2;Th‐MYCN tumours in response to lorlatinib at 4 and 14 days.
Rosa26_Alkal2;Th‐MYCN tumours from lorlatinib or vehicle controls were analysed for phospho‐histone H3 (pH3). A representative field of view for each tumour at 40× (175.740 μm2) was manually counted. Data shown represent mean ± 95% CI. P = 0.0286; Mann–Whitney test.
References
-
- Benjamini Y, Hochberg Y (1995) Controlling the false discovery rate: a practical and powerful approach to multiple testing. J R Stat Soc Series B 57: 289–300
-
- Brand AH, Perrimon N (1993) Targeted gene expression as a means of altering cell fates and generating dominant phenotypes. Development 118: 401–415 - PubMed
Publication types
MeSH terms
Substances
LinkOut - more resources
Full Text Sources
Other Literature Sources
Medical
Molecular Biology Databases
