

Opening of Large Institutions of Higher Education and County-Level COVID-19 Incidence - United States, July 6-September 17, 2020
- PMID: 33411699
- PMCID: PMC7790156
- DOI: 10.15585/mmwr.mm7001a4
Opening of Large Institutions of Higher Education and County-Level COVID-19 Incidence - United States, July 6-September 17, 2020
Abstract
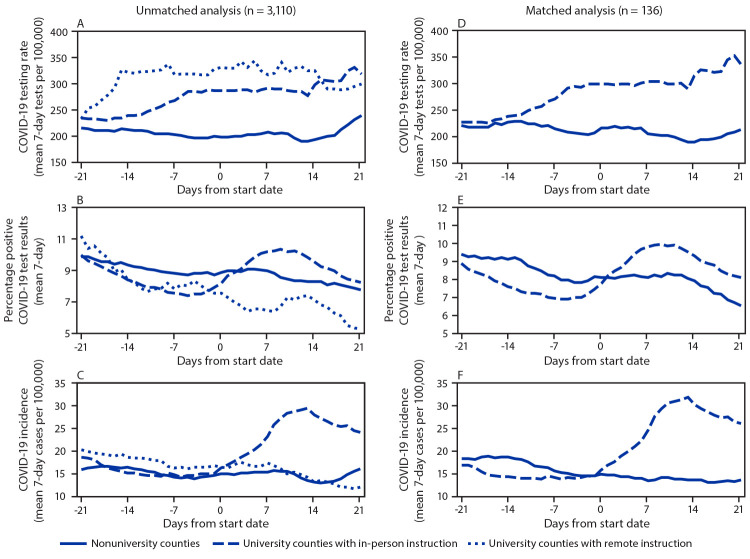
During early August 2020, county-level incidence of coronavirus disease 2019 (COVID-19) generally decreased across the United States, compared with incidence earlier in the summer (1); however, among young adults aged 18-22 years, incidence increased (2). Increases in incidence among adults aged ≥60 years, who might be more susceptible to severe COVID-19-related illness, have followed increases in younger adults (aged 20-39 years) by an average of 8.7 days (3). Institutions of higher education (colleges and universities) have been identified as settings where incidence among young adults increased during August (4,5). Understanding the extent to which these settings have affected county-level COVID-19 incidence can inform ongoing college and university operations and future planning. To evaluate the effect of large colleges or universities and school instructional format* (remote or in-person) on COVID-19 incidence, start dates and instructional formats for the fall 2020 semester were identified for all not-for-profit large U.S. colleges and universities (≥20,000 total enrolled students). Among counties with large colleges and universities (university counties) included in the analysis, remote-instruction university counties (22) experienced a 17.9% decline in mean COVID-19 incidence during the 21 days before through 21 days after the start of classes (from 17.9 to 14.7 cases per 100,000), and in-person instruction university counties (79) experienced a 56.2% increase in COVID-19 incidence, from 15.3 to 23.9 cases per 100,000. Counties without large colleges and universities (nonuniversity counties) (3,009) experienced a 5.9% decline in COVID-19 incidence, from 15.3 to 14.4 cases per 100,000. Similar findings were observed for percentage of positive test results and hotspot status (i.e., increasing among in-person-instruction university counties). In-person instruction at colleges and universities was associated with increased county-level COVID-19 incidence and percentage test positivity. Implementation of increased mitigation efforts at colleges and universities could minimize on-campus COVID-19 transmission.
Conflict of interest statement
All authors have completed and submitted the International Committee of Medical Journal Editors form for disclosure of potential conflicts of interest. No potential conflicts of interest were disclosed.
Figures
References
-
- CDC. Coronavirus disease 2019 (COVID-19): CDC COVID data tracker. Atlanta, GA: US Department of Health and Human Services, CDC; 2020. https://covid.cdc.gov/covid-data-tracker
-
- Watson S, Hubler S, Ivory D, Gebeloff R. A new front in America’s pandemic: college towns. New York Times, September 10, 2020. https://www.nytimes.com/2020/09/06/us/colleges-coronavirus-students.html
MeSH terms
LinkOut - more resources
Full Text Sources
Other Literature Sources
Medical
