. 2021 Jan 7;15(1):e0009022.
doi: 10.1371/journal.pntd.0009022. eCollection 2021 Jan.

Predicting the spatio-temporal spread of West Nile virus in Europe

Affiliations

Predicting the spatio-temporal spread of West Nile virus in Europe

José-María García-Carrasco et al. PLoS Negl Trop Dis. .

Abstract

West Nile virus is a widely spread arthropod-born virus, which has mosquitoes as vectors and birds as reservoirs. Humans, as dead-end hosts of the virus, may suffer West Nile Fever (WNF), which sometimes leads to death. In Europe, the first large-scale epidemic of WNF occurred in 1996 in Romania. Since then, human cases have increased in the continent, where the highest number of cases occurred in 2018. Using the location of WNF cases in 2017 and favorability models, we developed two risk models, one environmental and the other spatio-environmental, and tested their capacity to predict in 2018: 1) the location of WNF; 2) the intensity of the outbreaks (i.e. the number of confirmed human cases); and 3) the imminence of the cases (i.e. the Julian week in which the first case occurred). We found that climatic variables (the maximum temperature of the warmest month and the annual temperature range), human-related variables (rain-fed agriculture, the density of poultry and horses), and topo-hydrographic variables (the presence of rivers and altitude) were the best environmental predictors of WNF outbreaks in Europe. The spatio-environmental model was the most useful in predicting the location of WNF outbreaks, which suggests that a spatial structure, probably related to bird migration routes, has a role in the geographical pattern of WNF in Europe. Both the intensity of cases and their imminence were best predicted using the environmental model, suggesting that these features of the disease are linked to the environmental characteristics of the areas. We highlight the relevance of river basins in the propagation dynamics of the disease, as outbreaks started in the lower parts of the river basins, from where WNF spread towards the upper parts. Therefore, river basins should be considered as operational geographic units for the public health management of the disease.


Conflict of interest statement

The authors have declared that no competing interests exist.

Figures

Fig 1
Fig 1. Study area.
Countries involved in the study area (black contour line) and their corresponding OGUs (grey contour line). OGUs with confirmed cases of WNF in 2017 are shown in red.
Fig 2
Fig 2. Cartographic model of the environmental favorability for WNV infection in humans in the study area.
It results from the projection of the mathematical model shown in S2 Table, which is based on cases reported in 2017.
Fig 3
Fig 3. Cartographic model of the spatial favorability for WNV infection in humans in the study area.
It results from the projection of the mathematical model shown in S3 Table, which is based on cases of 2017.
Fig 4
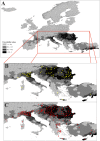
Fig 4. Spatio-environmental model of favorability for the occurrence of WNF cases in humans.
(A) Darker OGUs show higher spatio-environmental favorability. (B) Yellow icons indicate those OGUs that presented cases in 2017. (C) Red icons indicate the OGUs that presented cases in 2018.
Fig 5
Fig 5
Predictive Miller calibration lines for the environmental (A) and spatio-environmental (B) models. The red calibration line is the graphic representation of the calibration logit, which is the logit of a logistic regression of the WNF occurrences of the year 2018 on the model's logit values (Y-axis), along the model's logit values (X-axis). The equation of the red line is shown. The yellow line represents the perfect calibration line, with slope 1 and intercept value 0, for comparison.
Fig 6
Fig 6. Mean of 2018 WNF cases per OGU for each environmental favorability interval.
Fig 7
Fig 7
3D representation of the average values of environmental favorability (X-axis), Julian week of appearance of the first case of disease (Z-axis), and altitude in 50-meter altitude ranges (Y-axis) of the OGUs. The color gradient (from white to black) in the X-Z plane reflects the degree of environmental favorability of the OGUs (from low to high). The color gradient (from orange to light blue) in the Y-Z plane reflects the earliness of the disease onset (earlier to later).

References

    1. Chancey C, Grinev A, Volkova E, Rios M. The global ecology and epidemiology of West Nile virus. Biomed Res Int. 2015;2015 10.1155/2015/376230 - DOI - PMC - PubMed
    1. Balenghien T, Vazeille M, Grandadam M, Schaffner F, Zeller H, Reiter P, et al. Vector Competence of Some French Culex and Aedes Mosquitoes for West Nile Virus. Vector-Borne Zoonotic Dis. 2008;8: 589–596. 10.1089/vbz.2007.0266 - DOI - PubMed
    1. Petersen LR, Brault AC, Nasci RS. West Nile virus: Review of the literature. JAMA—J Am Med Assoc. 2013;310: 308–315. 10.1001/jama.2013.8042 - DOI - PMC - PubMed
    1. Durand B, Tran A, Balança G, Chevalier V. Geographic variations of the bird-borne structural risk of West Nile virus circulation in Europe. PLoS One. 2017;12: 1–15. 10.1371/journal.pone.0185962 - DOI - PMC - PubMed
    1. Young JJ, Coulombier D, Domanović D, Zeller H, Gossner CM. One Health approach for West Nile virus surveillance in the European Union: relevance of equine data for blood safety. Eurosurveillance. 2019;24 10.2807/1560-7917.ES.2019.24.16.1800349 - DOI - PMC - PubMed

Publication types