. 2021 Jan 7;17(1):e1009033.
doi: 10.1371/journal.ppat.1009033. eCollection 2021 Jan.

Novel modulators of p53-signaling encoded by unknown genes of emerging viruses

Affiliations

Novel modulators of p53-signaling encoded by unknown genes of emerging viruses

Dina Alzhanova et al. PLoS Pathog. .

Abstract

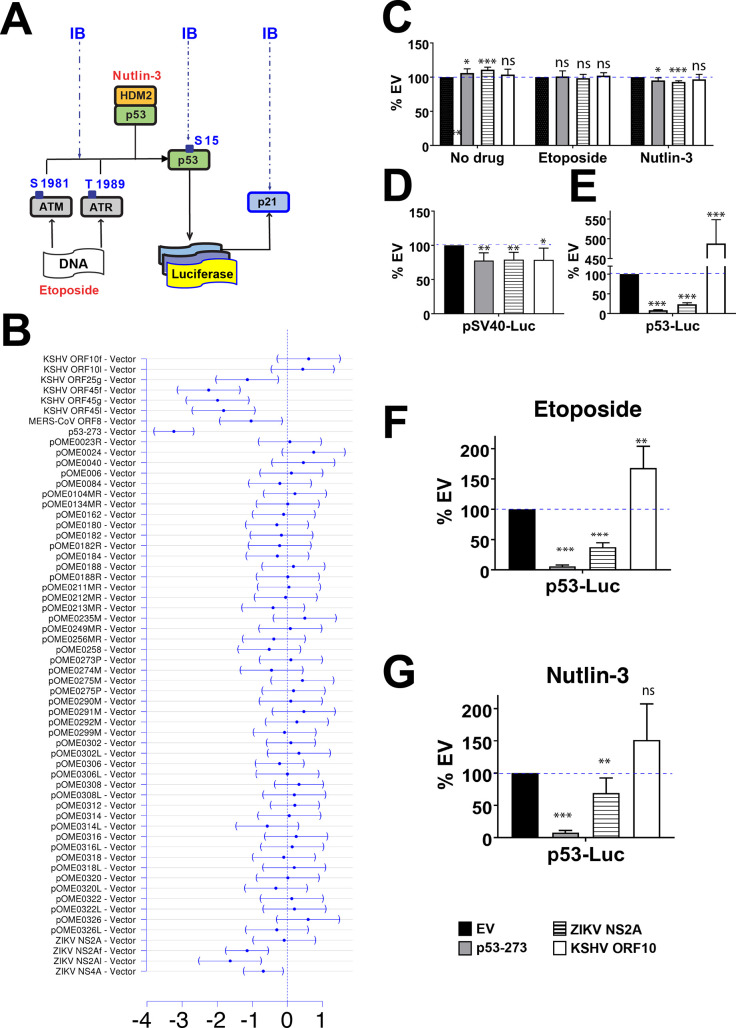
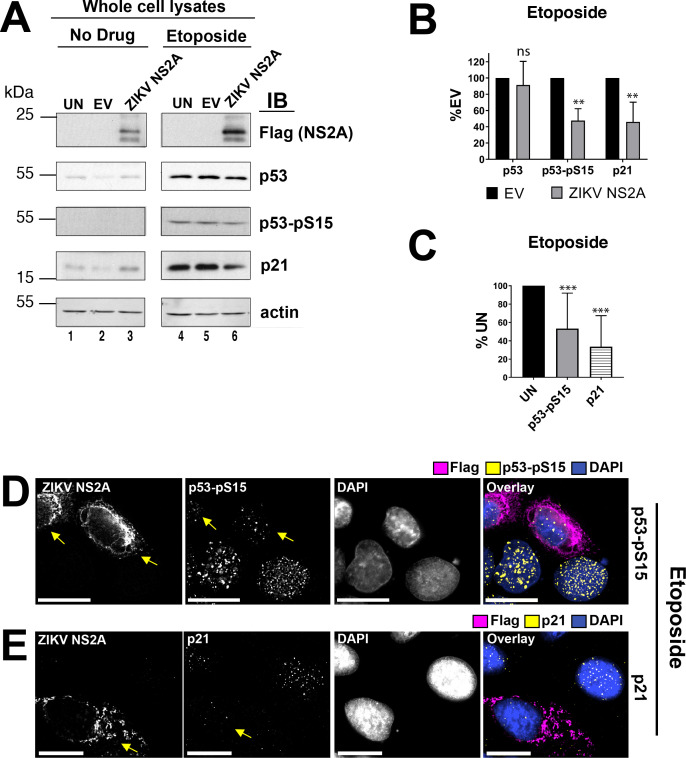
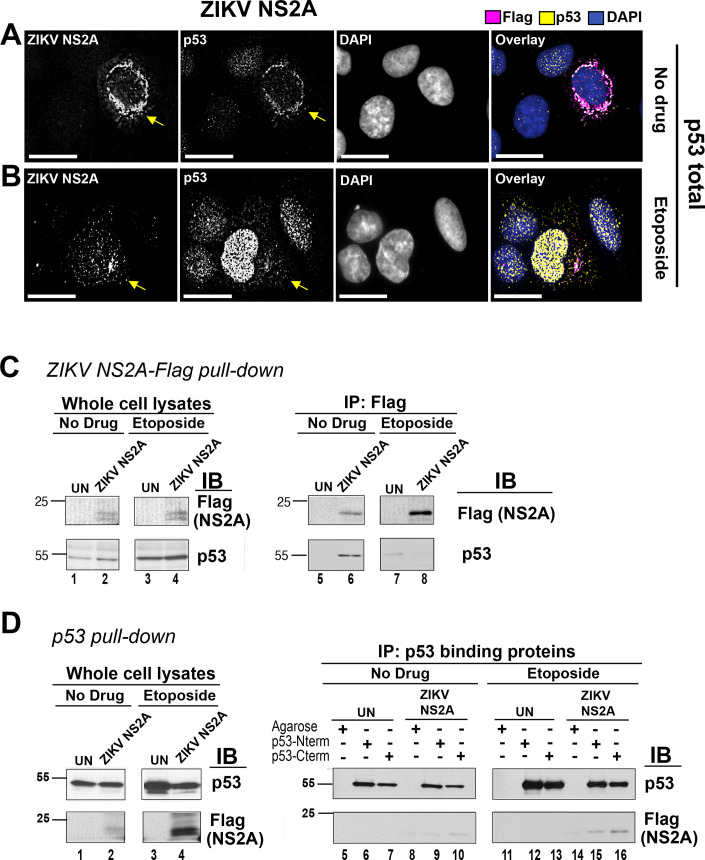
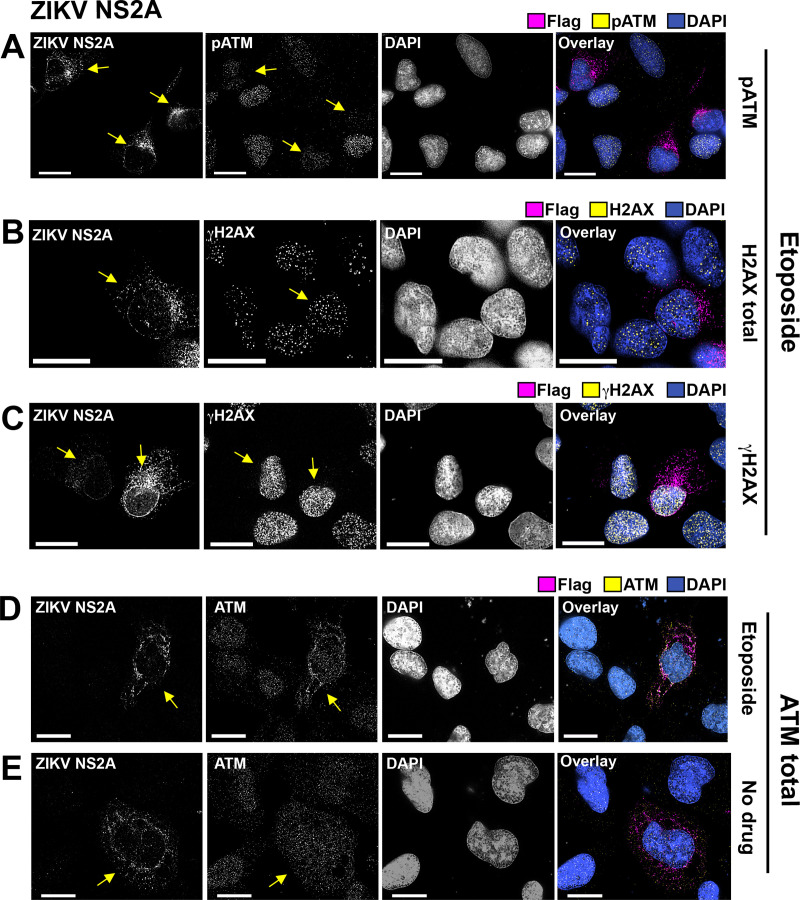
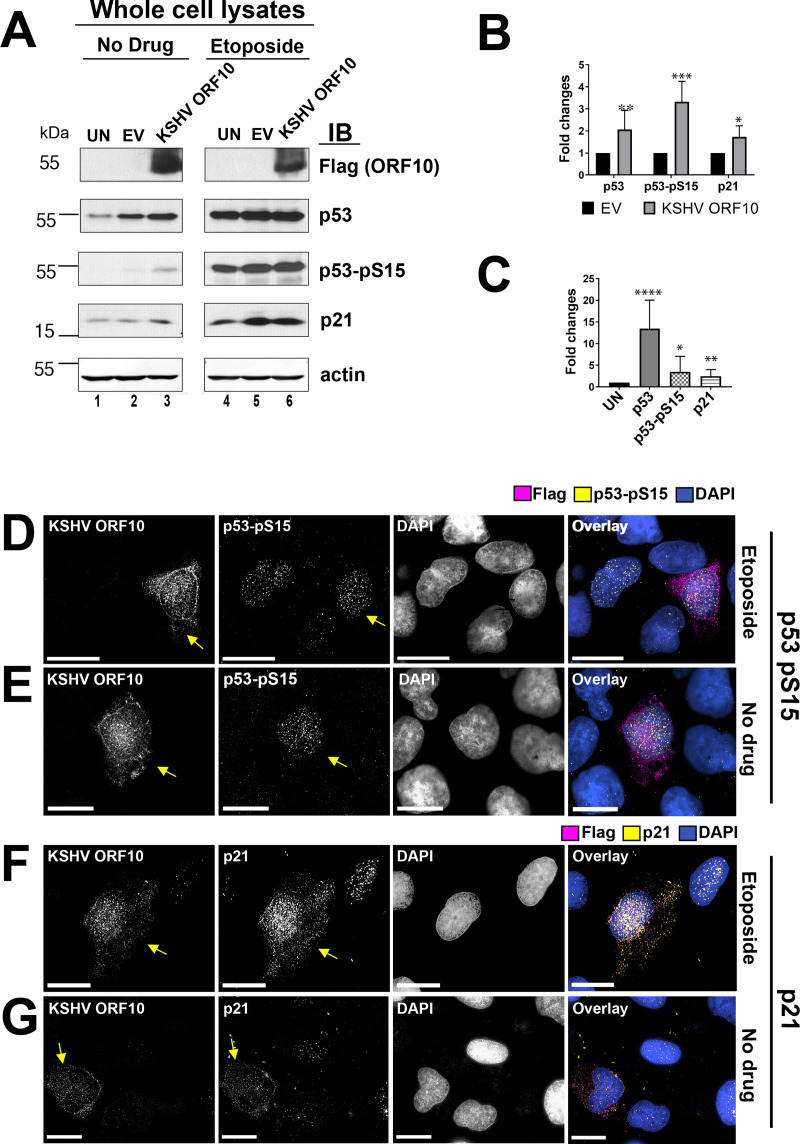
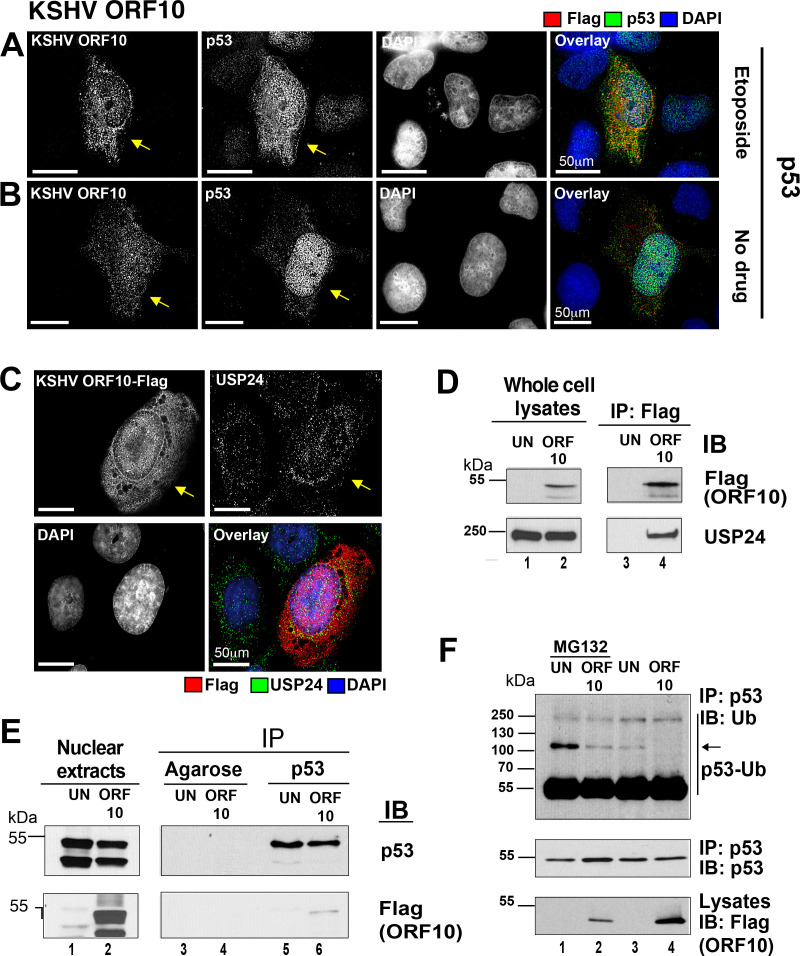
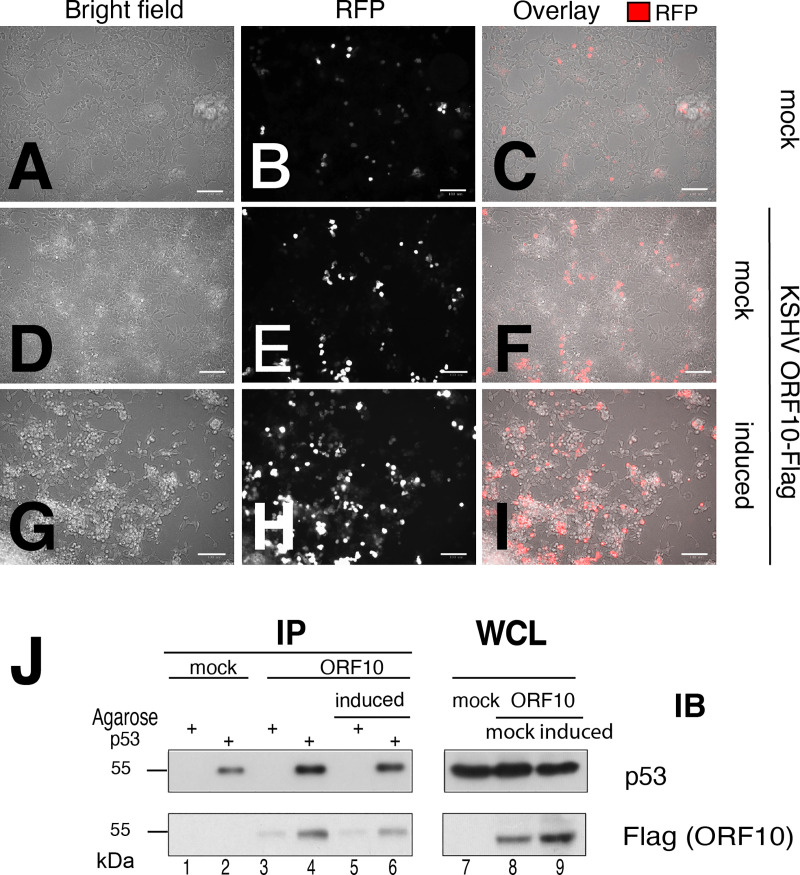
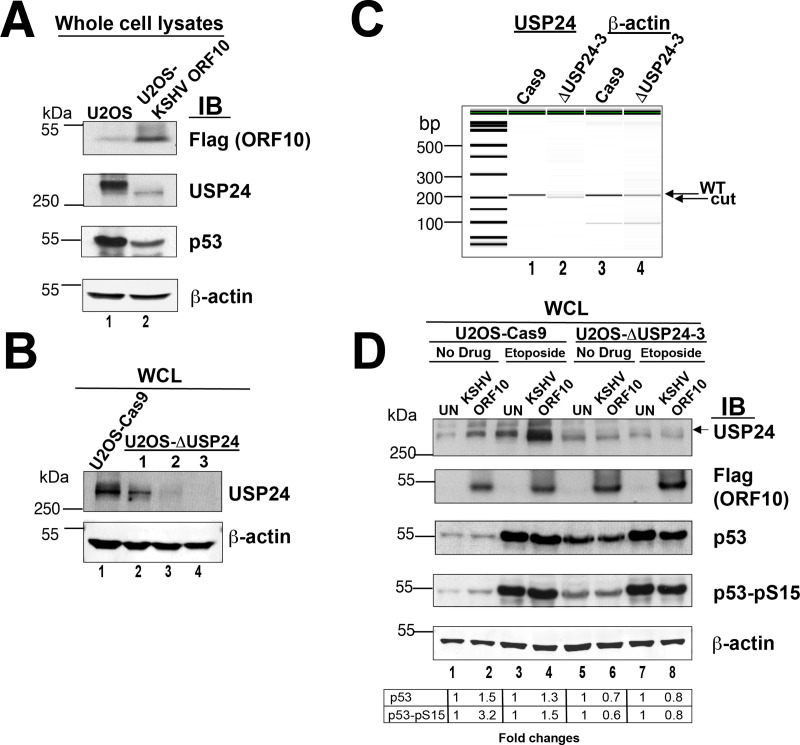
The p53 transcription factor plays a key role both in cancer and in the cell-intrinsic response to infections. The ORFEOME project hypothesized that novel p53-virus interactions reside in hitherto uncharacterized, unknown, or hypothetical open reading frames (orfs) of human viruses. Hence, 172 orfs of unknown function from the emerging viruses SARS-Coronavirus, MERS-Coronavirus, influenza, Ebola, Zika (ZIKV), Chikungunya and Kaposi Sarcoma-associated herpesvirus (KSHV) were de novo synthesized, validated and tested in a functional screen of p53 signaling. This screen revealed novel mechanisms of p53 virus interactions and two viral proteins KSHV orf10 and ZIKV NS2A binding to p53. Originally identified as the target of small DNA tumor viruses, these experiments reinforce the notion that all viruses, including RNA viruses, interfere with p53 functions. These results validate this resource for analogous systems biology approaches to identify functional properties of uncharacterized viral proteins, long non-coding RNAs and micro RNAs.


Conflict of interest statement

The authors have declared that no competing interests exist. Author Kathleen Corcoran was unable to confirm their authorship contributions. On their behalf, the corresponding author has reported their contributions to the best of their knowledge.

Figures

Fig 1
Fig 1. p53-Luc screening of virus encoded orfs.
(A) p53 signaling is activated either by (i) etoposide or (ii) nulin-3. Etoposide binds and inhibits topoisomerase II, which results in formation of DSB and activates DDR. ATM senses DSB and autophosphorylates. Because SSB are being introduced during DSB repair, etoposide also activates ATR kinase. Both kinases phosphorylate p53 and HDM2, an E3 ubiquitin ligase, which breaks their interactions and leads to p53 accumulation and stabilization and results in expression of p53 target genes. Nultin-3 inhibits HDM2:p53 interactions and thereby induces p53 accumulation. The response is measured using Luc-reporter assay and immunoblotting with Abs specific for ATM pSer1981, ATR pThr1989, p53 pSer15, p53 and p21. (B) Relative expression levels of p53-dependent luciferase reporter. Shown is the mean effect size plus 95%CI after adjustment for multiple comparisons to control using Dunnett’s methods. The mean effect was calculated by linear model of three independent biological replicate transfections/treatments. For each transfection, three technical replicates were measured. Orfs with confidence intervals not overlapping “0” were considered significant hits (p≤0.05). The names of each tested orf are shown on the left. For detailed description see Experimental Procedures and S1 Table. KSHV orf10f (3xflag-tagged, pOME0004), KSHV orf10l (lentivirus, pOME0004L), KSHV orf45f (3xflag-tagged, pOME0016), KSHV orf45l (lentivirus, pOME0016L), MERS-CoV orf8b (pOME0215), ZIKV NS2A (pOME0303R), ZIKV NS2Af (3xflag-tagged, OME0304), ZIKV NS2Al (lentivirus, pOME0304L). For KSHV orf25g and KSHV orf45g see Experimental Procedures. (C) Cell viability for EV (pCMV-Neo-Bam), p53-273 (pCMV-Neo-Bam- p53R273H), ZIKV NS2A (pOME0304), or KSHV orf10 (pOME0004) was measured with CellTiter-Glo luminescence cell viability assay kit following transfection with each vector (18h), treatment with indicated drugs (6h), and additional 24h-incubation. P-values calculated using Student t-test (n = 4) are shown as ‘ns’ (P>0.05), * (P≤0.05), **(P≤0.01), or *** (P≤0.001). (D-G) p53-Luc assays for ZIKV NS2A and KSHV orf10 expressing cells, untreated or stimulated with etoposide or nutlin-3. U2OS cells were transfected with either pGL3 control reporter (D) or p53-responsive reporter pGL13 (E-G) and EV, p53R273, ZIKV NS2A-Flag, or KSHV orf10-Flag. At 18 hrs post transfection (p.t.), the cells were stimulated with 5 μM etoposide (F) or 10 μM nutlin-3 (G) for 6h or left untreated (D and E) and then incubated for 24h. Firefly luciferase levels were measured with One-Glo luciferase assay system (Promega Inc.).
Fig 2
Fig 2. Expression of the p53-signaling components in the presence of ZIKV NS2A.
(A) Cells were transfected with empty vector (EV) and pOME0303R (ZIKV NS2A) or left untransfected (UN). At 18h after transfection, the cells were stimulated with 10 μM etoposide for 6h. The cell lysates were analyzed by SDS-PAGE and immunoblotting with indicated antibodies. (B) Shows protein levels by immunoblotting (IB) normalized to beta-actin relative to empty vector (% EV) for three different experiments that were calculated based on pixel density of each protein band measured using ImageJ software. Bars indicate the standard error of mean (s.e.m., n = 3). P-values calculated using Student t-test are shown as ‘ns’ (P>0.05), * (P≤0.05), **(P≤0.01), or *** (P≤0.001). (C) Shows protein levels in ZIKV NS2A expressing cells by immunofluorescence (IF) relative to untransfected cells (%UN) that were calculated based on pixel density measured using ImageJ software. Bars indicate s.e.m. (n≥10). P-values calculated using Student t-test are shown as ‘ns’ (P>0.05), * (P≤0.05), **(P≤0.01), or *** (P≤0.001). (D and E) U2OS cells were transfected with ZIKV NS2A-Flag. At 18h after transfection the cells were stimulated with 10 μM etoposide for 1.5 hrs, fixed, and stained with anti-Flag, anti-phospho-p53Ser15, or anti-p21 antibodies. DAPI was used to delineate the nucleus. The images were subjected to a digital deconvolution. Each image represents an individual optical section. The scale bar is 50 μm. Arrows point at the cell expressing ZIKV NS2A.
Fig 3
Fig 3. ZIKV NS2A binds to p53.
(A, B) U2OS cells were transfected with ZIKV NS2A-Flag. At 18h p.t., the cells were left untreated (A) or stimulated with 10 μM etoposide for 1.5 hrs (B), fixed with methanol and stained with indicated Abs. The images were taken as Z-stack sections and subjected to a digital deconvolution. The scale bar is 50 μm. Arrows point at the cell expressing ZIKV NS2A. (C) Endogenous p53 pull-down. U2OS cells were transfected with pDEST47-ZIKV NS2A-Flag expressing ZIKV NS2A tagged with the C-terminal 3xFlag epitope or left untransfected (UN). At 18 hrs p.t., the cells were stimulated with 10 μM etoposide for 6 hrs. NS2A-Flag was immunoprecipitated with mouse α-Flag Ab. Lysates and imunoprecipitates was tested with mouse mab α-p53 DO7 and mouse α-Flag Abs. (D) ZIKV NS2A pull-down using p53-binding proteins. U2OS cells were transfected with pDEST47-ZIKV NS2A-Flag or left untransfected (UN). At 18 hrs p.t., the cells were stimulated with 10 μM etoposide for 6h. P53 was immunopreciptated with proteins binding to p53 N- or C-terminus. Presence of ZIKV NS2A-Flag and p53 in the lysates and imunoprecipitates was tested with mouse anti-Flag and mouse α-p53 DO7 Abs.
Fig 4
Fig 4. Localization of ATM and pATM, H2AX, and μH2AX in the presence of ZIKV NS2A.
U2OS cells were transfected with ZIKV NS2A-Flag (pOME0304). At 18 hrs p.t., the cells were stimulated with 10 μM etoposide for 1.5 hrs (A, C-E) or left untreated (B), fixed with methanol, and stained with indicated Abs. The scale bar is 50 μM. Arrows point at the cell expressing ZIKV NS2A.
Fig 5
Fig 5. Induction of p53, p53 pSer15, and p21 by KSHV orf10.
(A) Cells were transfected with empty vector (EV) and pOME0004 (KSHV orf10) or left untransfected (UN). At 18h p.t., the cells were stimulated with 10μM etoposide for 6h or mock treated (No Drug). The cell lysates were analyzed by SDS-PAGE and immunoblotting with indicated Abs. (B) Shows relative protein expression levels (fold changes compared to EV) by IB cumulative of two different experiments that were calculated based on pixel density of each protein band measured using ImageJ software. Bars indicate the s.e.m. (n ≥ 3). P-values calculated using Student t-test (n = 3) are shown as ‘ns’ (P>0.05), * (P≤0.05), **(P≤0.01), or *** (P≤0.001). (C) Shows protein levels in orf10 expressing cells by IF relative to mock transfected cells (fold changes compared to UN) that were calculated based on pixel density measured using ImageJ software. Bars indicate s.e.m. (n≥10). P-values calculated using Student t-test (n = 3) are shown as * (P≤0.05), **(P≤0.01), or *** (P≤0.001), **** (P≤0.0001). (D-G) U2OS cells were transfected with KSHV orf10-Flag. At 18 hrs p.t., the cells were stimulated with 10 μM etoposide for 1.5 hrs (D, F) or left untreated (E, G), fixed with methanol, and stained with indicated Abs. The scale bar is 50 μM. Arrows point at the cells expressing KSHV orf10.
Fig 6
Fig 6. KSHV orf10 interacts with USP24 and p53.
(A, B) U2OS cells were transfected with pDEST47-KSHV orf10-Flag. At 18h p.t., the cells were stimulated with 10μM etoposide for 1.5h (A) or left untreated (B), fixed with methanol, and stained with indicated Abs. Each image represents an individual optical section. The scale bar is 50μM. Arrows point at the cells expressing KSHV orf10. (C) KSHV orf10 colocalizes with USP24. U2OS cells, transfected with pDEST47-KSHV orf10-Flag for 18h were fixed with methanol and stained with indicated α-Flag and α-USP24 Abs. Each image represents an individual optical section. The scale bar is 50μM. Arrow points at the cell expressing KSHV orf10. (D) USP24 coimmunoprecipitates with KSHV orf10. U2OS cells were transfected with pDEST47-KSHV orf10-Flag expressing orf10 tagged with C-terminal 3xFlag epitope or left untransfected (UN) for 18h. orf10-Flag was immunoprecipitated from the whole cell lysates with mouse α-Flag Ab. Presence of USP24 and orf10-Flag in the lysates and coimunoprecipitated fractions was tested with rabbit α-USP24 and mouse α-Flag Abs. (E) KSHV orf10 coimmunoprecipitates with p53. U2OS cells were transfected with pDEST47-KSHV orf10-Flag or left untransfected (UN) for 18h. P53 was immunopreciptated from nuclear fraction of cell lysates with proteins binding to p53 N- or C-terminus. Presence of orf10-Flag and p53 in the lysates and coimunoprecipitated fractions was tested with mouse α-Flag and mouse α-p53 DO7 Abs. (F) p53 ubiquitination is reduced in the presence of KSHV orf10. U2OS cells were transfected with KSHV orf10 or left untransfected. At 18h p.t., the cells were incubated in the presence or absence of 30μM MG132 for 6h. p53 was coimmunoprecipitated with p53-specific mouse pAb421 Ab and blotted with rabbit α-ubiquitin and mouse α-p53 DO7 Abs.
Fig 7
Fig 7. KSHV orf10 interacts with p53 in KSHV infected cells.
(A) A293T.219 cells were transfected with pDEST47-KSHV orf10-Flag. At 16h p.t., the cells were induced with 1mM NaB and 25 ng/ml 12-O-tetradecanoylphorbol-13-acetate (TPA) for 48h. Stimulation of A293T.219 cells was monitored by RFP expression. Transfected stimulated and unstimulated cells were imaged with bright field and fluorescence microscopy to visualize upregulation of expression of RFP and cytopathic effect (CPE) induced by KSHV replication. Panel A—C show mock-transfected, uninduced cells, panels D—I depict KSHV ORF10-FLAG transfected cells that were either left untreated or induced. Panels (J) KSHV orf10 coimmunoprecipitates with p53. p53 was immunopreciptated from whole cell lysates with antibody binding to p53 C-terminus. Presence of orf10-Flag and p53 in the lysates and co-imunoprecipitated fractions was tested with mouse anti-Flag and mouse anti-p53 DO7 Ab.
Fig 8
Fig 8. KSHV orf10 does not upregulate accumulation and phosphorylation of p53 in in the absence of USP24.
(A) U2OS cells stably expressing KSHV ORF10 show decreased expression of USP24 and p53. Lysates of U2OS cells and U2OS-KSHV ORF10 cells stably expressing KSHV ORF10-Flag were analyzed by SDS-PAGE and immunoblotting with indicated antibodies. (B) Testing USP24 expression in U2OS USP24 KO cell lines. Lysates U2OS-Cas9 parental cell line or indicated U2OS-ΔUSP24 cell lines were analyzed by SDS-PAGE and immunoblotting with indicated Abs. (C) Analysis of CRISPR/Cas-9 deletion of USP24. Shown is an image of capillary electrophoresis of PCR products of DNA using primers flanking the CRISPR target site and actin as control. (D) KSHV ORF10 expression in USP24 KO cells does not induce accumulation and phosphorylation of p53. U2OS-Cas9 or U2OS-dUSP24-3 cells were transfected with pDEST47-KSHV orf10-Flag or left untransfected (UN). At 18h p.t., the cells were stimulated with 10 μM etoposide for 6h or mock treated (No Drug). The cell lysates were analyzed by SDS-PAGE and immunoblotting with indicated Abs.

References

    1. Kastenhuber ER, Lowe SW. Putting p53 in Context. Cell. 2017;170(6):1062–78. Epub 2017/09/09. 10.1016/j.cell.2017.08.028 - DOI - PMC - PubMed
    1. Rivas C, Aaronson SA, Munoz-Fontela C. Dual Role of p53 in Innate Antiviral Immunity. Viruses. 2010;2(1):298–313. Epub 2010/01/22. 10.3390/v2010298 - DOI - PMC - PubMed
    1. Muñoz-Fontela C, Mandinova A, Aaronson SA, Lee SW. Emerging roles of p53 and other tumour-suppressor genes in immune regulation. Nat Rev Immunol. 2016;16(12):741–50. Epub 2016/09/26. 10.1038/nri.2016.99 - DOI - PMC - PubMed
    1. Ryan EL, Hollingworth R, Grand RJ. Activation of the DNA Damage Response by RNA Viruses. Biomolecules. 2016;6(1):2 Epub 2016/01/06. 10.3390/biom6010002 - DOI - PMC - PubMed
    1. Luftig MA. Viruses and the DNA Damage Response: Activation and Antagonism. Annu Rev Virol. 2014;1(1):605–25. Epub 2014/07/16. 10.1146/annurev-virology-031413-085548 . - DOI - PubMed

Publication types

MeSH terms

Substances