. 2021 Jul 5;15(7):1161-1173.
doi: 10.1093/ecco-jcc/jjab005.

Degree of Creeping Fat Assessed by Computed Tomography Enterography is Associated with Intestinal Fibrotic Stricture in Patients with Crohn's Disease: A Potentially Novel Mesenteric Creeping Fat Index

Affiliations

Degree of Creeping Fat Assessed by Computed Tomography Enterography is Associated with Intestinal Fibrotic Stricture in Patients with Crohn's Disease: A Potentially Novel Mesenteric Creeping Fat Index

Xue-Hua Li et al. J Crohns Colitis. .

Abstract

Background and aims: Emerging evidence points to a link between creeping fat and the pathogenesis of Crohn's disease [CD]. Non-invasive assessment of the severity of creeping fat on cross-sectional imaging modality has seldom been investigated. This study aimed to develop and characterize a novel mesenteric creeping fat index [MCFI] based on computed tomography [CT] in CD patients.

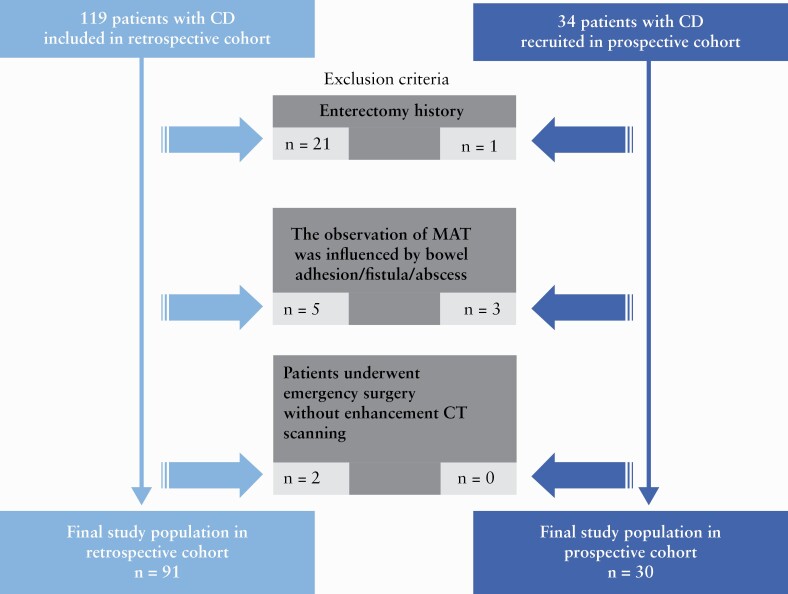
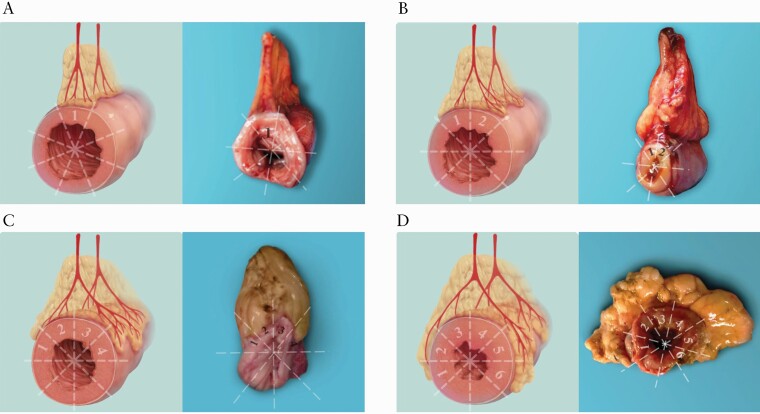
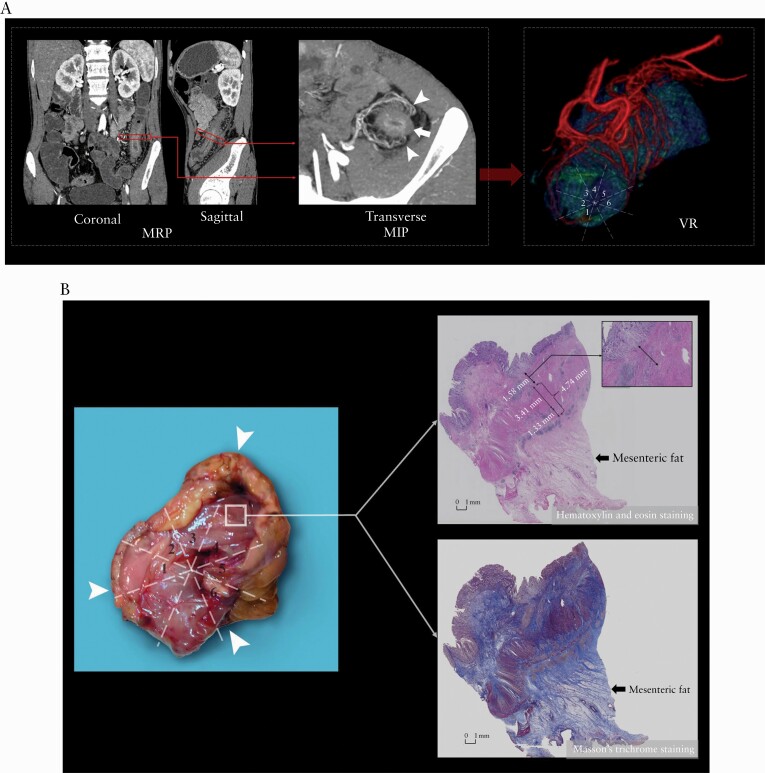
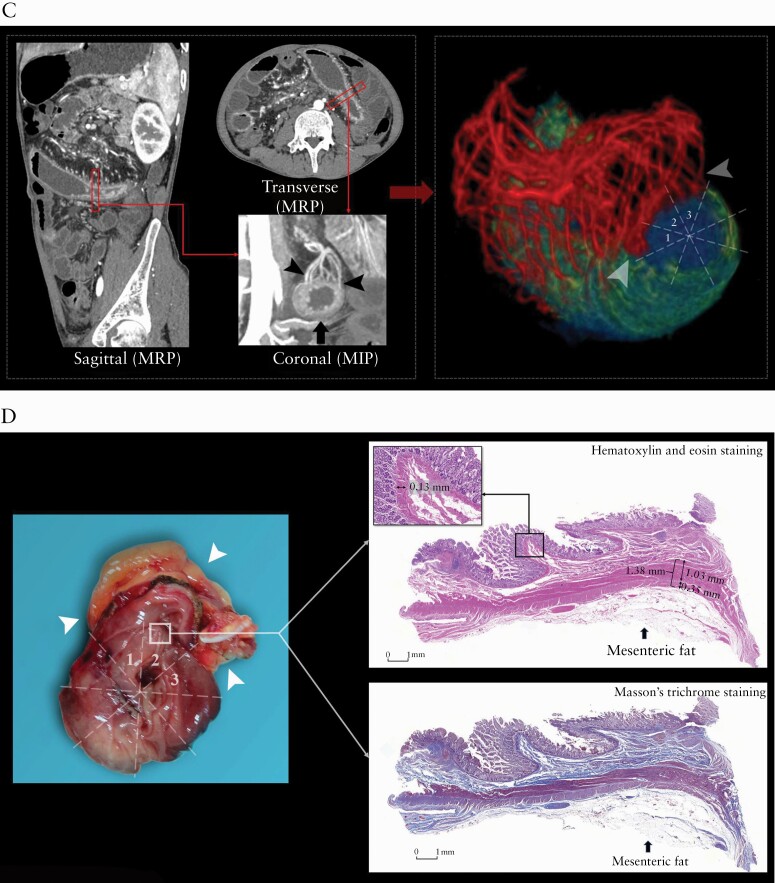
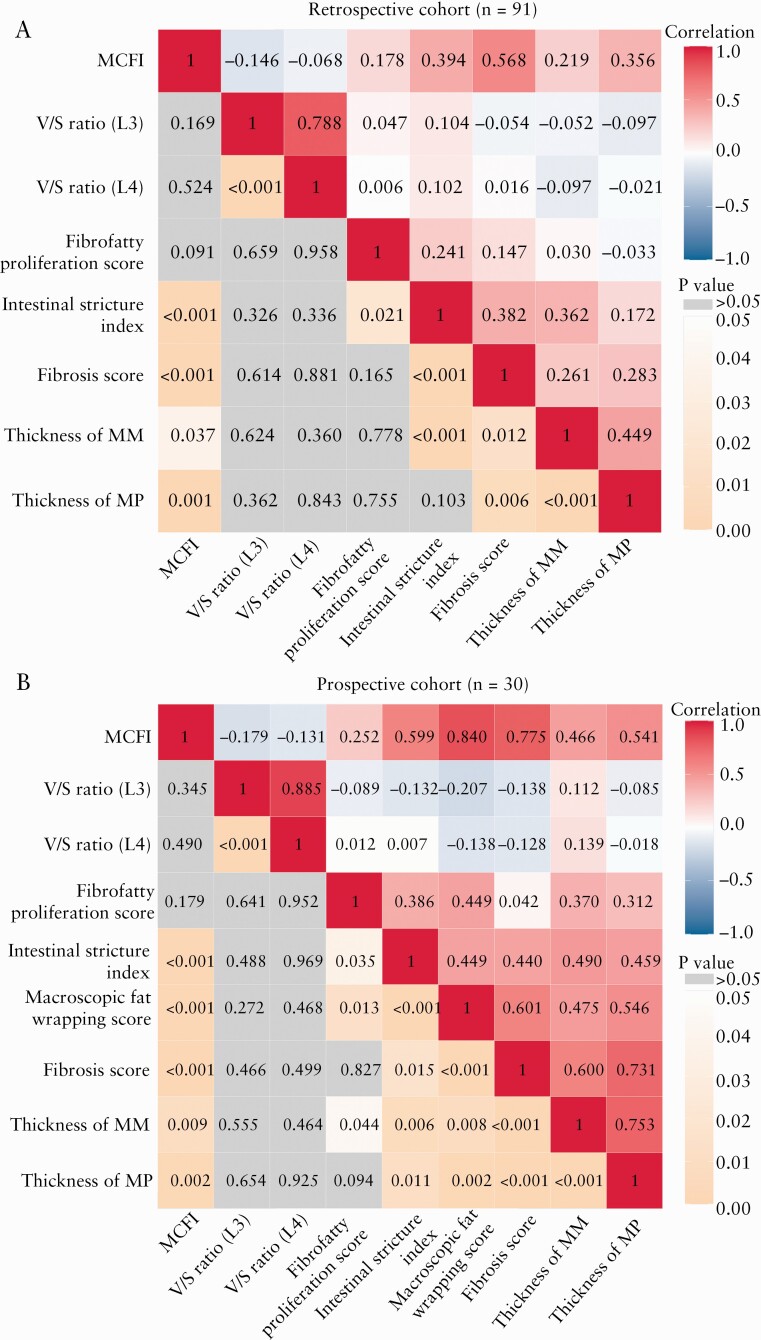
Methods: MCFI was developed based on vascular findings on CT in a retrospective cohort [n = 91] and validated in a prospective cohort [n = 30]. The severity of creeping fat was graded based on the extent to which mesenteric fat extended around the intestinal circumference using the vessels in the fat as a marker. The accuracy of MCFI was assessed by comparing it with the degree of creeping fat observed in surgical specimens. The relationship between MCFI and fibrostenosis was characterized by determining if these correlated. The accuracy of MCFI was compared with other radiographic indices [i.e. visceral to subcutaneous fat area ratio and fibrofatty proliferation score].

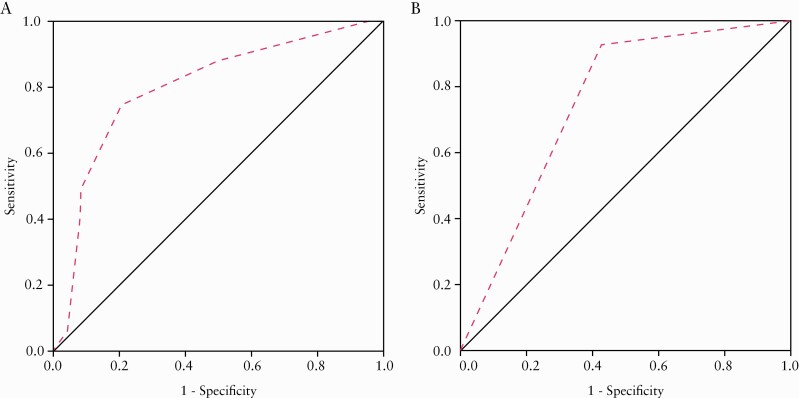
Results: In the retrospective cohort, MCFI had moderate accuracy in differentiating moderate-severe from mild fibrostenosis (area under the receiver operating characteristic [ROC] curve [AUC] = 0.799; p = 0.000). ROC analysis in the retrospective cohort identified a threshold MCFI of > 3 which accurately differentiated fibrostenosis severity in the prospective cohort [AUC = 0.756; p = 0.018]. An excellent correlation was shown between MCFI and the extent of fat wrapping in specimens in the prospective cohort [r = 0.840, p = 0.000]. Neither visceral to subcutaneous fat area ratio nor fibrofatty proliferation score correlated well with the degree of intestinal fibrosis.

Conclusions: MCFI can accurately characterize the extent of mesenteric fat wrapping in surgical specimens. It may become another non-invasive measure of CD fibrostenosis.

Keywords: Creeping fat; Crohn’s disease; intestinal fibrosis.


Figures

Figure 1.
Figure 1.
Flow diagram of the study population. CD, Crohn’s disease; MAT, mesenteric adipose tissue
Figure 2.
Figure 2.
Schematic diagrams and the corresponding resected specimens demonstrating fat wrapping around the gut graded by MCFI which was modified from a prior study. The bowel circumference on its axial plane is divided into eight equal areas with one score for each area. The MCFI, which reflects the degree of mesenteric fat wrapping around the gut, is scored from 1 to 8 according to the areas of bowel surface covered by the corresponding mesenteric vessels. In the case with a MCFI of 1 [A], the MAT is normal or shows minimal fat wrapping. With an MCFI of 2 [B], the fat wrapping commences at the bowel margin of the mesentery but is limited. With an MCFI of 4 [C], the fat wrapping increases and covers nearly 50% of the intestinal circumference. With an MCFI of 6 [D], the MAT thickening is more pronounced, and the fat wrapping extends to 6/8 of the bowel circumference. MCFI, mesenteric creeping fat index; MAT, mesenteric adipose tissue
Figure 3.
Figure 3.
[A] On ROC analysis, MCFI had a moderate accuracy [AUC = 0.799; 95% CI, 0.690–0.907; p = 0.000] for distinguishing moderate–severely fibrotic from mildly fibrotic strictures in the retrospective cohort. [B] Using an MCFI > 3 derived from the retrospective cohort as the cutoff level for distinguishing moderate–severely fibrotic strictures from mildly fibrotic strictures in the prospective cohort, the AUC of MCFI was 0.756 [95% CI, 0.579–0.932; p = 0.018]. ROC, receiver operating characteristics; MCFI, mesenteric creeping fat index; AUC, area under the ROC curve; CI, confidence interval
Figure 4.
Figure 4.
Images from a 20-year-old male patient with CD [A, B]. [A] Coronal, sagittal and transverse post-contrast enhanced CT images showing marked bowel wall thickening and luminal narrowing in the descending colon [arrow]; the MCFI of the designated segment [arrow] reconstructed from the adjacent mesenteric vessels [arrowheads] using MPR and MIP is scored as 6. On VR reconstruction, the three-dimensional anatomical relationship between the designated gut [green area] and the mesenteric vessels [red areas] is shown and the MCFI with a score of 6 is verified. [B] Macroscopic specimen showing the creeping fat [arrowhead] wrapping around the resected bowel segment with a macroscopic fat wrapping score of 6. H&E and Masson’s trichrome staining depict severe inflammation [score = 4] and severe transmural fibrosis [blue area; score = 4] in the area corresponding to creeping fat [arrow]; the maximum thickness of muscularis mucosae and muscularis propria are 1.58 and 4.74 mm, respectively. ×20 magnification. Images from a 30-year-old male patient with CD [C, D]. [C] Coronal, sagittal and transverse post-contrast enhanced CT images showing bowel wall thickening and luminal narrowing in the jejunum [arrow]; the MCFI of the designated segment [arrow] reconstructed from the adjacent mesenteric vessels [arrowheads] using MPR and MIP is scored as 3. On VR reconstruction, the three-dimensional anatomical relationship between the designated gut [green area] and the mesenteric vessels [red areas; arrowheads] is shown and the MCFI with a score of 3 is verified. [D] Macroscopic specimen showing the creeping fat [arrowhead] wrapping around the resected bowel segment with a macroscopic fat wrapping score of 3. H&E and Masson’s trichrome staining depict mild inflammation [score = 1] and mild fibrosis [blue area; score = 2]; the maximum thickness of muscularis mucosae and muscularis propria are 0.13 and 1.38 mm, respectively. ×20 magnification. CD, Crohn’s disease; MCFI, mesenteric fat creeping index; MPR, multiplanar reconstruction; MIP, maximum intensity projection; VR, volume rendering; H&E, hematoxylin and eosin
Figure 4.
Figure 4.
Images from a 20-year-old male patient with CD [A, B]. [A] Coronal, sagittal and transverse post-contrast enhanced CT images showing marked bowel wall thickening and luminal narrowing in the descending colon [arrow]; the MCFI of the designated segment [arrow] reconstructed from the adjacent mesenteric vessels [arrowheads] using MPR and MIP is scored as 6. On VR reconstruction, the three-dimensional anatomical relationship between the designated gut [green area] and the mesenteric vessels [red areas] is shown and the MCFI with a score of 6 is verified. [B] Macroscopic specimen showing the creeping fat [arrowhead] wrapping around the resected bowel segment with a macroscopic fat wrapping score of 6. H&E and Masson’s trichrome staining depict severe inflammation [score = 4] and severe transmural fibrosis [blue area; score = 4] in the area corresponding to creeping fat [arrow]; the maximum thickness of muscularis mucosae and muscularis propria are 1.58 and 4.74 mm, respectively. ×20 magnification. Images from a 30-year-old male patient with CD [C, D]. [C] Coronal, sagittal and transverse post-contrast enhanced CT images showing bowel wall thickening and luminal narrowing in the jejunum [arrow]; the MCFI of the designated segment [arrow] reconstructed from the adjacent mesenteric vessels [arrowheads] using MPR and MIP is scored as 3. On VR reconstruction, the three-dimensional anatomical relationship between the designated gut [green area] and the mesenteric vessels [red areas; arrowheads] is shown and the MCFI with a score of 3 is verified. [D] Macroscopic specimen showing the creeping fat [arrowhead] wrapping around the resected bowel segment with a macroscopic fat wrapping score of 3. H&E and Masson’s trichrome staining depict mild inflammation [score = 1] and mild fibrosis [blue area; score = 2]; the maximum thickness of muscularis mucosae and muscularis propria are 0.13 and 1.38 mm, respectively. ×20 magnification. CD, Crohn’s disease; MCFI, mesenteric fat creeping index; MPR, multiplanar reconstruction; MIP, maximum intensity projection; VR, volume rendering; H&E, hematoxylin and eosin
Figure 5.
Figure 5.
Correlation coefficient matrix of creeping fat-related parameters, histological findings and intestinal stricture index in the retrospective cohort [A] and the prospective cohort [B]. The maximum positive correlation is given at a correlation coefficient of 1 [red] and the maximum negative correlation at −1 [blue] in the top right portion of the matrix graph; the dark areas indicate a strong correlation, and the lighter coloured regions indicate a relatively weak correlation. The p values of the corresponding correlation analyses [orange and gray] are shown in the bottom left portion of the matrix graph; the dark orange areas indicate a p value close to 0, the lighter orange regions indicate a p value close to 0.05, and the gray areas a p value > 0.05. MCFI, mesenteric creeping fat index; V/S ratio [L3], visceral to subcutaneous fat area ratio [L3 level]; V/S ratio [L4], visceral to subcutaneous fat area ratio [L4 level]; MM, muscularis mucosae; MP, muscularis propria
Figure 6.
Figure 6.
Surgical specimen [A] identified a topographical coupling of small mesenteric vessels [arrowheads] along the surface of the intestine and extending creeping fat. This anatomical manifestation is the basis for creating the mesenteric creeping fat index. On the corresponding coronal CTE using MIP reconstruction with a thickness of 4.90 mm [B], the resected small bowel [arrow] with prestenotic dilatation [asterisk] has prominent perienteric vasculature [i.e. comb sign] in the creeping fat [yellow dotted line], which is consistent with the surgical specimen. H&E staining section [C] shows enlarged mesenteric vessels in the MAT. CTE, CT enterography; MIP, maximum intensity projection; H&E, haematoxylin and eosin; MAT, mesenteric adipose tissue

References

    1. Borley NR, Mortensen NJ, Jewell DP, Warren BF. The relationship between inflammatory and serosal connective tissue changes in ileal Crohn’s disease: evidence for a possible causative link. J Pathol 2000;190:196–202. - PubMed
    1. Coffey CJ, Kiernan MG, Sahebally SM, et al. Inclusion of the mesentery in ileocolic resection for Crohn’s disease is associated with reduced surgical recurrence. J Crohns Colitis 2018;12:1139–50. - PMC - PubMed
    1. Coffey JC, O’Leary DP, Kiernan MG, Faul P. The mesentery in Crohn’s disease: friend or foe? Curr Opin Gastroenterol 2016;32:267–73. - PubMed
    1. Zuo L, Li Y, Zhu W, et al. Mesenteric adipocyte dysfunction in Crohn’s disease is associated with hypoxia. Inflamm Bowel Dis 2016;22:114–26. - PubMed
    1. Chen W, Lu C, Hirota C, Iacucci M, Ghosh S, Gui X. Smooth muscle hyperplasia/hypertrophy is the most prominent histological change in Crohn’s fibrostenosing bowel strictures: a semiquantitative analysis by using a novel histological grading scheme. J Crohns Colitis 2017;11:92–104. - PubMed