. 2021 Jan 21;184(2):476-488.e11.
doi: 10.1016/j.cell.2020.12.015. Epub 2020 Dec 15.

COVID-19-neutralizing antibodies predict disease severity and survival

Affiliations

COVID-19-neutralizing antibodies predict disease severity and survival

Wilfredo F Garcia-Beltran et al. Cell. .

Abstract

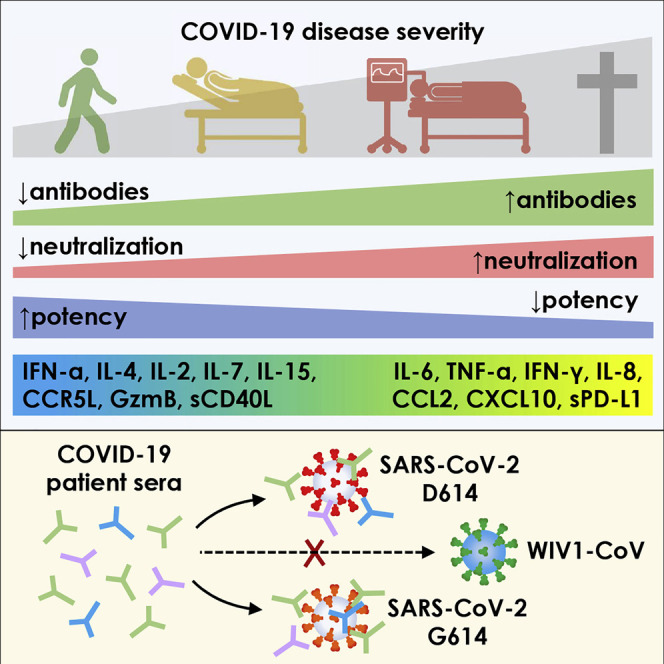
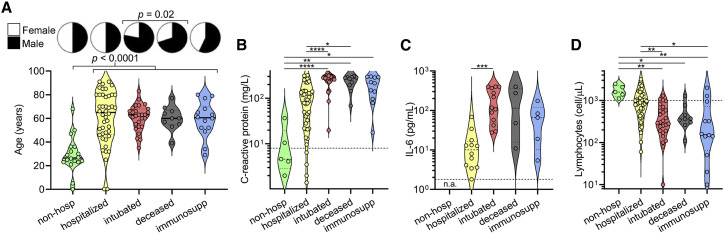
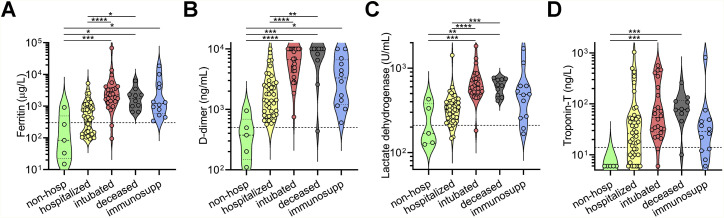
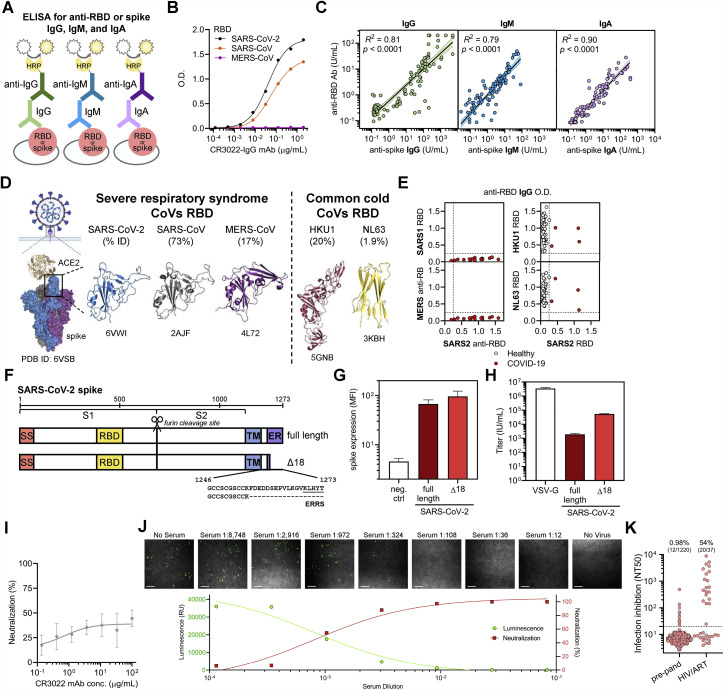
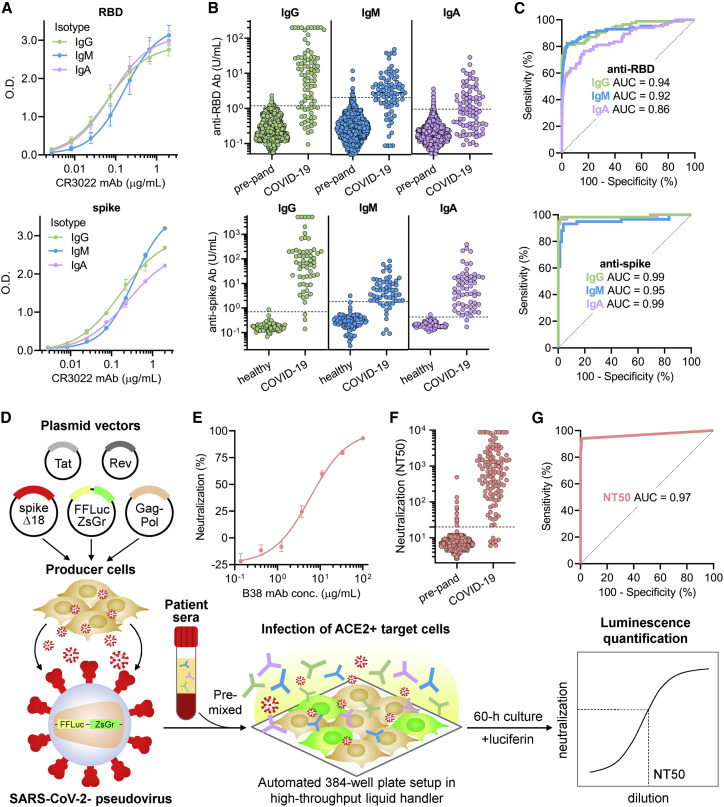
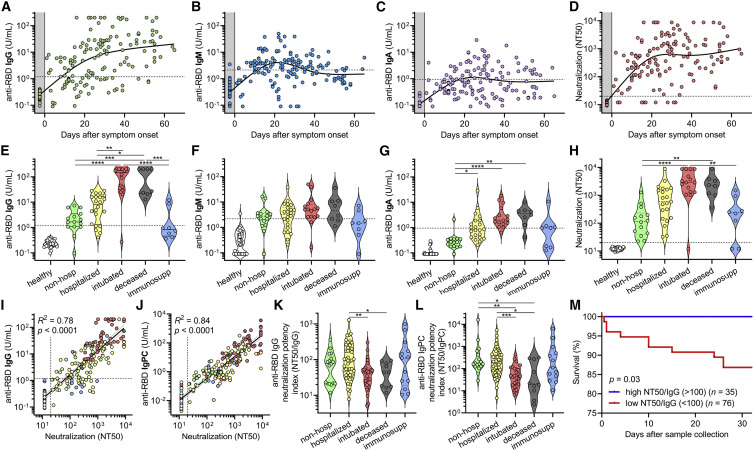
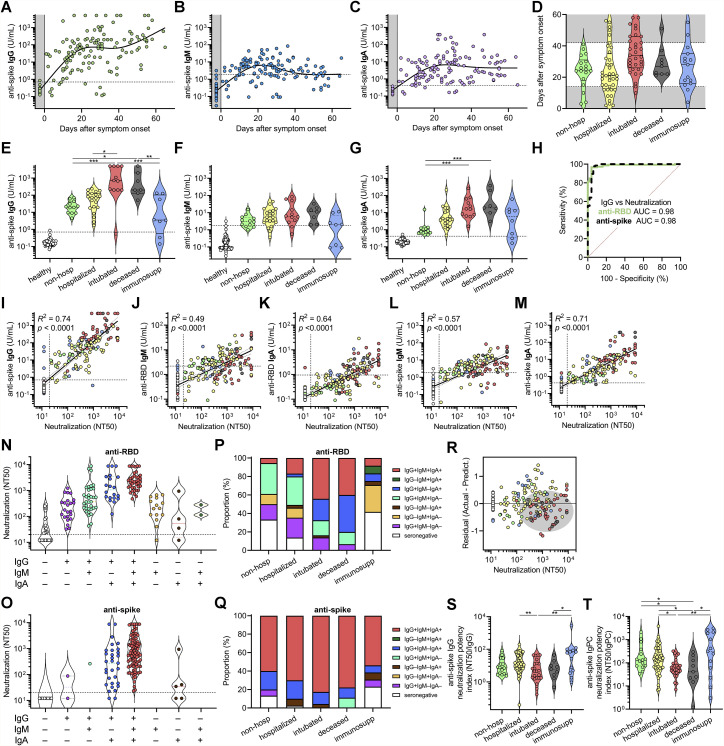
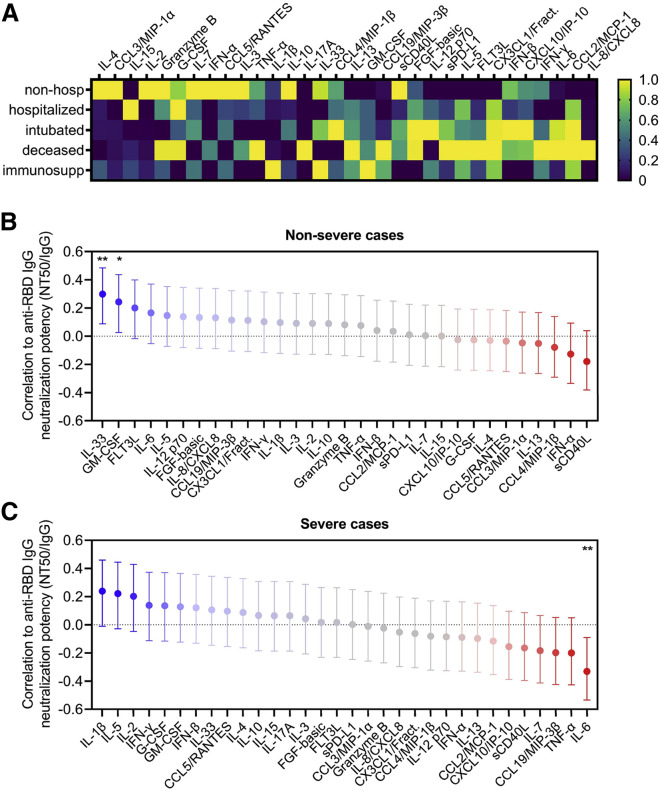
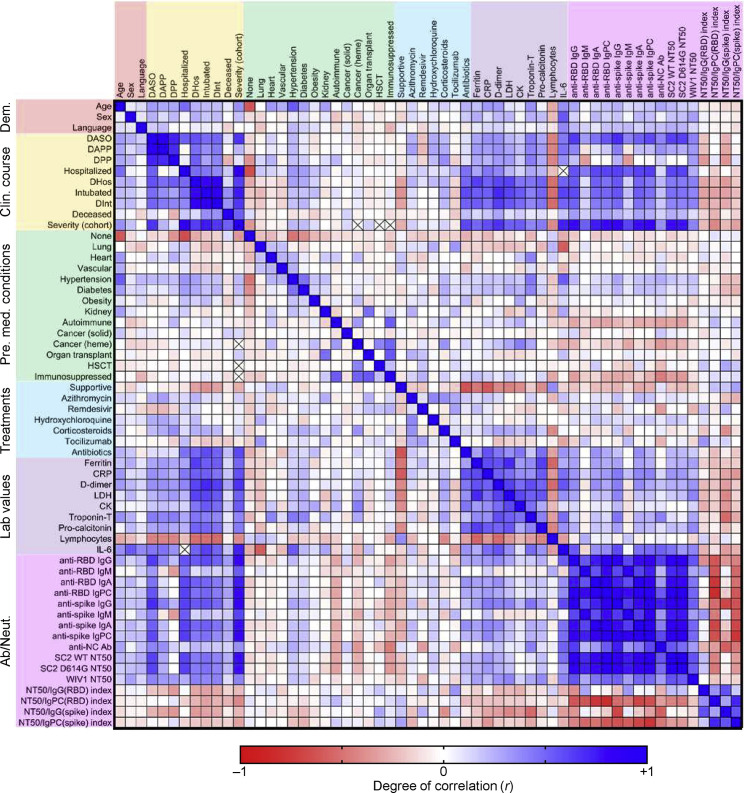
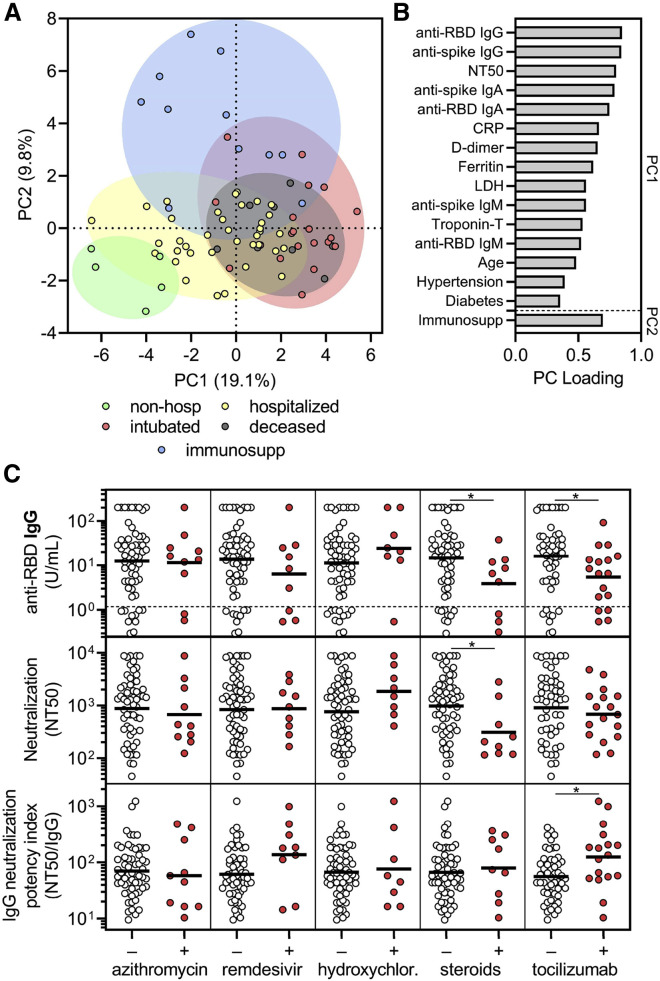
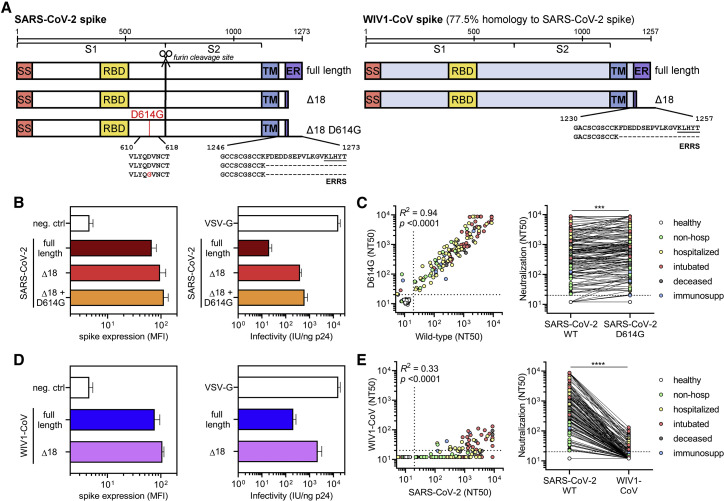
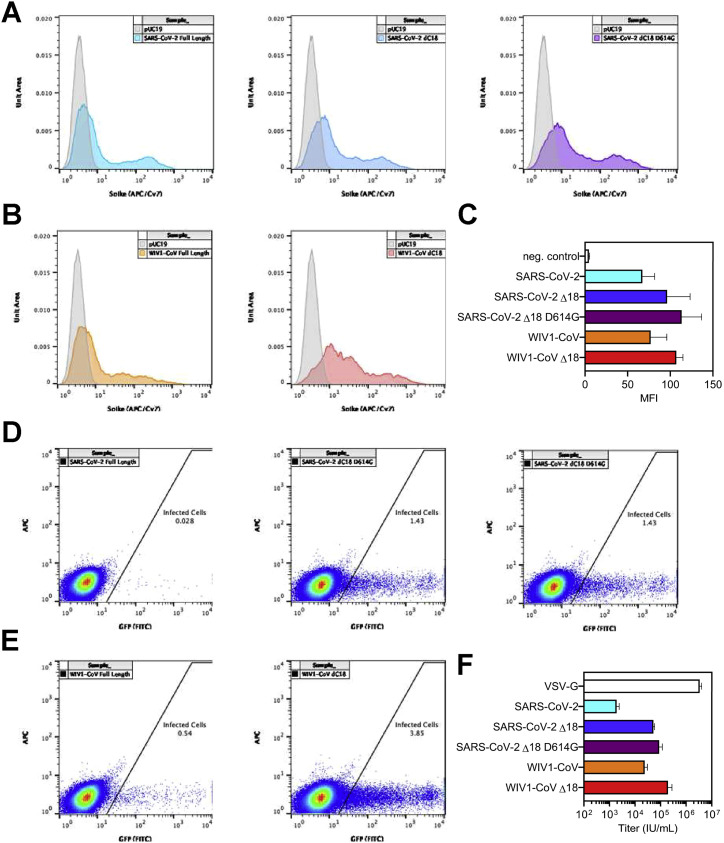
Coronavirus disease 2019 (COVID-19) exhibits variable symptom severity ranging from asymptomatic to life-threatening, yet the relationship between severity and the humoral immune response is poorly understood. We examined antibody responses in 113 COVID-19 patients and found that severe cases resulting in intubation or death exhibited increased inflammatory markers, lymphopenia, pro-inflammatory cytokines, and high anti-receptor binding domain (RBD) antibody levels. Although anti-RBD immunoglobulin G (IgG) levels generally correlated with neutralization titer, quantitation of neutralization potency revealed that high potency was a predictor of survival. In addition to neutralization of wild-type SARS-CoV-2, patient sera were also able to neutralize the recently emerged SARS-CoV-2 mutant D614G, suggesting cross-protection from reinfection by either strain. However, SARS-CoV-2 sera generally lacked cross-neutralization to a highly homologous pre-emergent bat coronavirus, WIV1-CoV, which has not yet crossed the species barrier. These results highlight the importance of neutralizing humoral immunity on disease progression and the need to develop broadly protective interventions to prevent future coronavirus pandemics.

Keywords: COVID-19; D614G; ELISA; RBD; SARS-CoV-2; WIV1-CoV; disease severity; neutralizing antibodies; pro-inflammatory cytokines; spike.


Conflict of interest statement

Declaration of interests J.A.B. has served as a paid consultant to T2 Biosystems, DiaSorin, and Roche Diagnostics.

Figures

None
Graphical abstract
Figure 1
Figure 1
Clinical severity of SARS-CoV-2 infection is influenced by patient characteristics and coupled to clinical laboratory data (A) A cross-sectional cohort of COVID-19 patients (n = 113) was divided into groups of varying clinical severity, i.e., non-hospitalized (n = 18), hospitalized (n = 45), intubated (n = 27), deceased (n = 10), and immunosuppressed (n = 13), and analyzed for age and sex. Median age was 28 years in patients who were never hospitalized (n = 20; includes 2 immunosuppressed) and 63 years in patients admitted to the hospital (n = 93), with a t test yielding p < 0.0001. Fisher’s exact test on males who were intubated or deceased (n = 31 males of 42 total; includes 5 immunosuppressed) versus not (n = 36 males of 71 total) demonstrated a significant enrichment (p = 0.02). (B–D) Peak levels of C-reactive protein (B) and IL-6 (C) as well as lymphocyte count nadir (D) are presented in violin plots. In (C), none of the non-hospitalized patients had serum IL-6 levels measured (n.a., not assessed). For (B) and (C), clinical laboratory-defined cut-offs of the upper limit of normal are indicated with a dotted line; for (D), the dotted line represents the lower limit of normal. For each parameter, a non-parametric ANOVA was performed; statistical significance is indicated as follows: ∗∗∗∗p < 0.0001, ∗∗∗p < 0.001, ∗∗p < 0.01, and p < 0.05. See also Figure S1 and Table S1.
Figure S1
Figure S1
Clinical laboratory data from COVID-19 patients, related to Figure 1 (A−D) Peak serum levels of ferritin (A), D-dimer (B), lactate dehydrogenase (C), and troponin-T (D) documented for each COVID-19 patient in the indicated cohorts are shown as violin plots. Clinical laboratory-defined cut-offs of the upper limit of normal are indicated with a dotted line. For each parameter, a non-parametric ANOVA was performed; statistical significance is indicated as follows: ∗∗∗∗p < 0.0001, ∗∗∗p < 0.001, ∗∗p < 0.01, and p < 0.05.
Figure S2
Figure S2
Cross-reactivity of anti-CoV antibody responses and high-throughput SARS-CoV-2 pseudovirus neutralization assay, related to Figure 2 (A) A schematic of the quantitative indirect ELISA that measures IgG, IgM, and IgA antibodies to the receptor binding domain (RBD) or spike for SARS-CoV-2 is shown. (B) Reactivity of the anti-SARS-CoV and -CoV-2-specific monoclonal antibody (CR3022 mAb) toward SARS-CoV-2, SARS-CoV, and MERS-CoV RBD was measured. (C) Log-log regression analyses were performed to compare anti-RBD versus anti-spike antibody levels for IgG (left panel), IgM (middle panel), and IgA (right panel). Pearson correlations were calculated and R2 and p values are indicated. (D) Published crystal structures of the ACE2:prefusion-stabilized SARS-CoV-2 spike (PDB ID: 6VSB) as well as the RBD of SARS-CoV-2 (PDB ID 6VWI), SARS-CoV (PDB ID 2AJF), MERS-CoV (PDB ID: 4L72), HKU1 (PDB ID 5GNB), and NL63 (PDB ID 3KBH) are presented, with the sequence homology to SARS-CoV-2 RBD indicated. (E) Cross-reactivity of anti-RBD IgG from SARS-CoV-2-infected patient sera (n = 15) toward the RBD of SARS-CoV (top left) and MERS-CoV (bottom left), as well as the reactivity anti-RBD IgG from the sera of healthy blood donors (n = 43) and COVID-19 patients (n = 4) toward the RBD of two common cold coronaviruses, HKU1 (top right) and NL63 (bottom right), was measured using a modified anti-RBD IgG ELISA and optical density as a readout. (F) A schematic of the full-length and truncated (Δ18) construct of SARS-CoV-2 spike used to pseudotype lentivirus is shown; ERRS denotes ER retention signal. (G) Expression of the indicated spike constructs was measured on the surface of 293T cells via flow cytometry; mean and standard deviation are shown. (H) Pseudovirus titers of the indicated spike constructs were quantified in 293T-ACE2 cells; mean and standard deviation are shown. (I) Lack of neutralizing ability of CR3022 mAb was confirmed in pseudovirus neutralization assay; mean and standard deviation of neutralization (%) at each dilution is shown. (J) Confocal microscopy of each well of a serum dilution series using a representative COVID-19 patient sample taken 60 - 72 h after assay setup demonstrated the correlation between luciferase activity and transduced (ZsGreen+) target cells. Neutralization percentage at each dilution was calculated by measuring luciferase activity (luminescence) and normalizing to control well with no serum. Scale bar equals 200 μm. (K) False positive NT50 values were observed in individuals taking antiretroviral medications (n = 20 out of 37 individuals), while a large cohort of pre-pandemic individuals for which antiretroviral use was largely screened out showed a very low rate of infection inhibition (n = 12 out of 1,220).
Figure 2
Figure 2
Quantitative SARS-CoV-2 receptor binding domain and spike ELISA and high-throughput SARS-CoV-2 pseudovirus neutralization assay reveal highly variable IgG, IgM, and IgA responses and neutralization potency after SARS-CoV-2 infection (A) For quantitation of anti-RBD (upper panel) and anti-spike (lower panel) IgG, IgM, and IgA antibodies, a standard curve consisting of a SARS-CoV-2 RBD-binding monoclonal antibody, CR3022, in IgG, IgM, and IgA isotypes was used. Error bars indicate standard deviation. (B) Anti-RBD (upper panel) and anti-spike (lower panel) IgG, IgM, and IgA antibodies were measured in both negative controls (n = 1,257 pre-pandemic samples for anti-RBD; n = 78 healthy blood donors for anti-spike antibodies) and COVID-19 patient samples (n = 85 for anti-RBD; n = 59 for anti-spike antibodies). Dotted lines indicate the threshold of seropositivity that achieved a specificity of >99% for anti-RBD antibodies and >98% for anti-spike antibodies on ROC analyses. (C) ROC analyses for anti-RBD (upper panel) and anti-spike (lower panel) IgG, IgM, and IgA antibodies were done to assess how seropositivity predicted COVID-19 status. Area under the curve (AUC) is indicated for each antibody target and isotype. (D) A schematic of the high-throughput SARS-CoV-2 pseudovirus neutralization assay is shown. (E) Validation of the neutralization assay using a recently discovered anti-RBD neutralizing monoclonal antibody, B38, was performed (IC50 = 6 μg/mL). Error bars indicate standard deviation. (F) Neutralization titers that achieved 50% neutralization (NT50) were calculated for pre-pandemic samples (n = 1,220, individuals on antiretroviral therapy excluded) and samples from COVID-19 patients >14 days after symptom onset (n = 118). (G) An ROC analysis demonstrated an AUC of 0.97, with an NT50 cut-off of 20 achieving a sensitivity of 94% and specificity of >99%. See also Figure S2.
Figure 3
Figure 3
SARS-CoV-2 antibody levels and neutralization potency predict clinical severity and survival (A–C) Levels of anti-RBD IgG (A), IgM (B), and IgA (C) were plotted over days after symptom onset for COVID-19 cases where this date was known (n = 98 patients, n = 147 samples total). Healthy blood donors (n = 37) are included as a negative control within the gray region. The dotted lines indicate the cut-offs for anti-RBD IgG, IgM, and IgA seropositivity. (D) Titers that achieve 50% neutralization (NT50) were plotted over days after symptom onset for patient samples described in (A)–(C). (E–H) COVID-19 patient samples were selected for collection between 14 and 42 days after symptom onset (earliest time point for each patient, n = 85), and for each cohort of non-hospitalized, hospitalized, intubated, deceased, and immunosuppressed individuals, anti-RBD IgG (E), IgM (F), IgA (G), and neutralization (NT50) (H) were plotted. Healthy blood donors (n = 37) are also included as negative controls for comparison. Non-parametric multivariate ANOVA was performed for each (excluding healthy blood donors); statistical significance is indicated as follows: ∗∗∗∗p < 0.0001, ∗∗∗p < 0.001, ∗∗p < 0.01, and p < 0.05. (I and J) Log-log regression analyses were performed on neutralization versus anti-RBD IgG (I) and anti-RBD IgPC (J), which is a principal component generated from multivariate analysis of anti-RBD IgG, IgM, and IgA levels. For (I) and (J), the severity cohort is indicated as follows: healthy (white), non-hospitalized (green), hospitalized (yellow), intubated (red), deceased (gray), and immunosuppressed (blue). Pearson correlations were performed and R2 and p values are indicated. (K and L) Anti-RBD IgG neutralization potency index (NT50/IgG) (K) and anti-RBD IgPC neutralization potency index (NT50/IgPC) (L) was calculated for all 111 COVID-19 patients (at earliest time point) and plotted by cohort. A non-parametric multivariate ANOVA was performed; unadjusted p values are indicated as follows: ∗∗p < 0.01, p < 0.05. (M) Survival analysis of COVID-19 patients classified as having a high (≥100) (n = 35) or low (< 100) (n = 76) neutralization potency index (NT50/IgG) was performed using Kaplan-Meier method and revealed an increased risk of death in individuals with low neutralization potency (p = 0.03). See also Figure S3.
Figure S3
Figure S3
Correlates between clinical outcomes and humoral immune responses against SARS-CoV-2, related to Figure 3 (A−C) Anti-spike IgG (A), IgM (B), and IgA (C) levels were plotted over days after symptom onset for confirmed COVID-19 cases for which date of symptom onset was known (n = 87 patients, n = 133 samples total). Healthy blood donors (n = 37) are included as a negative control within the gray region. The dotted lines indicate the cut-offs for anti-spike IgG, IgM, and IgA seropositivity. (D) Standardization of cohorts by days after symptom onset to samples collected between 14 and 42 days was done to mitigate sampling biases and balance out representation from each cohort indicated. (E−G) COVID-19 patient samples were selected for collection between 14 and 42 days after symptom onset (earliest time point for each patient), and for each cohort of non-hospitalized, hospitalized, intubated, deceased, and immunosuppressed individuals, anti-spike IgG (E), IgM (F), and IgA (G) was plotted (n = 54 total). An additional cohort of healthy blood donors (n = 78) is also included as negative controls for comparison. Non-parametric multivariate ANOVA was performed for each (excluding healthy blood donors); statistical significance is indicated as follows: ∗∗∗∗p < 0.0001, ∗∗∗p < 0.001, ∗∗p < 0.01, and p < 0.05. (H) ROC curve analysis of anti-RBD and anti-spike IgG for the prediction of neutralization was performed; AUC is indicated. (I−M) Log-log regression analyses were performed on neutralization versus anti-spike IgG (I), anti-RBD IgM (J), anti-RBD IgA (K), anti-spike IgM (L), and anti-spike IgA (M). Severity cohort is indicated as follows: healthy (white), non-hospitalized (green), hospitalized (yellow), intubated (red), deceased (gray), and immunosuppressed (blue). Pearson correlations were performed and R2 and p values are indicated. (N and O) Neutralization (NT50) of COVID-19 patient samples were grouped by serostatus as determined by anti-RBD antibodies (N); n = 165) and anti-spike antibodies (O); n = 148). (P and Q) Proportion of COVID-19 patients of each indicated anti-RBD (P); n = 165) and anti-spike (Q); n = 148) serostatus group is presented for each severity cohort. (R) A residual plot for neutralization titer versus anti-RBD IgG was generated from the log-log correlation. The gray ellipse indicates a cluster of samples from deceased (gray) patients. (S and T) Anti-spike IgG neutralization potency index (NT50/IgG) (S) and anti-spike IgPC neutralization potency index (NT50/IgPC) (T) was calculated for all 100 patients (at earliest time point) and plotted by cohort. A non-parametric multivariate ANOVA was performed; unadjusted p values are indicated as follows: ∗∗p < 0.01, p < 0.05.
Figure 4
Figure 4
Neutralization potency correlates with distinct serum cytokine signatures in severe versus non-severe cases of COVID-19 (A) Serum cytokines were measured in COVID-19 patients that were non-hospitalized (n = 15), hospitalized (n = 38), intubated (n = 23), deceased (n = 9), and immunosuppressed (n = 13), and the average cytokine level for each cohort was calculated and presented as a heatmap. Color scales are normalized to each cytokine (column). (B and C) A multivariate analysis was performed to calculate pairwise correlations between anti-RBD IgG neutralization potency index (NT50/IgG) and serum cytokine levels in non-severe (n = 61; upper panel) and severe cases of COVID-19 (n = 37; lower panel). Severe cases were defined as ones requiring intubation or resulting in death, and non-severe cases were all others (without accounting for immunosuppression status). Error bars indicate 95% confidence intervals and unadjusted p values are indicated as follows: ∗∗p < 0.01, p = 0.05.
Figure S4
Figure S4
Multivariate analysis of demographic data, clinical course, pre-existing medical conditions, treatments, laboratory data, and humoral immune response in COVID-19 patients, related to Figure 5 A multi-variate analysis of all available data including age, sex, language, hospital course and events, pre-existing medical conditions, treatments received, clinical laboratory data, and antibody and neutralization data was performed, with Pearson coefficients (r) ranging from −1 (red) to 0 (white) to +1 (blue). The presence of an ‘x’ indicates that there were insufficient data to correlate the variables in question. The following abbreviations were used: DASO, days after symptom onset; DAPP, days after PCR positivity; DPP, days PCR positive (total number of days between first PCR positive results and last PCR positive result that was followed by one negative result); DHos, days hospitalized; HSCT, hematopoietic stem cell transplant; CRP, C-reactive protein; LDH, lactate dehydrogenase; CK, creatine kinase; anti-RBD, anti-receptor binding domain; IgPC, total antibody principal component (IgG, IgM, and IgA); anti-NC Ab, anti-nucleocapsid antibody (as measured by the commercially available Roche SARS-CoV-2 total antibody chemiluminescent assay); SC2, SARS-CoV-2.
Figure 5
Figure 5
Corticosteroid and tocilizumab therapy decrease humoral immune responses to SARS-CoV-2 (A and B) Principal components analysis was performed using the following variables: age, sex language, pre-existing medical conditions, treatments received, clinical laboratory data (ferritin, CRP, D-dimer, LDH, troponin-T, and lymphocyte nadir), anti-RBD and anti-spike antibody levels, and neutralization titers. The severity cohort of each patient is indicated by color. Patients with missing data were excluded. Loading of principle components (PC) is shown in (B). (C) Sub-analyses of anti-RBD IgG levels (upper panel), neutralization titer (middle panel), and neutralization potency index (NT50/IgG) (lower panel) were performed on COVID-19 patients that were in the hospital for at least 3 days to (n = 69) and were performed on the last collected specimen to show the effect of azithromycin (n = 10 out of 69 received), remdesivir (n = 9 out of 69), hydroxychloroquine (n = 8 out of 69), corticosteroids (n = 9 out of 69), and tocilizumab (n = 17 out of 69; treated as part of a trial with 2:1 randomization to placebo). Several patients received more than one treatment regimen and thus were included in more than one treatment category. A t test was performed for each comparison of patients who received (+) versus did not receive (–) the indicated treatment; indicates unadjusted p < 0.05. See also Figure S4.
Figure 6
Figure 6
SARS-CoV-2-infected patient sera cross-neutralizes both wild-type and D614G mutant SARS-CoV-2 spike but not the highly homologous pre-emergent bat coronavirus WIV1-CoV (A) A schematic of the SARS-CoV-2 and WIV1-CoV spike proteins, including full-length, truncated (Δ18), and mutant (D614G) forms is shown; ERRS denotes putative ER retention signal. (B) Expression of full-length, Δ18, and Δ18 D614G SARS-CoV-2 spike constructs in 293T cells in comparison to empty vector (neg. ctrl) was measured by flow cytometry (left panel). Infectivity of lentivirus, which was defined as the infectious units divided by the quantity of p24 in lentiviral supernatant, was also measured and compared to VSV-G-pseudotyped lentivirus (right panel). Error bars indicate standard deviation. (C) Cross-neutralization of serum samples from COVID-19 patients that were non-hospitalized (green, n = 16), hospitalized (yellow, n = 67), intubated (red, n = 43), deceased (gray, n = 15), or immunosuppressed (blue, n = 21) and healthy blood donors (n = 35) was measured for wild-type versus D614G mutant SARS-CoV-2 Δ18 spike pseudovirus. For the left panel, Pearson correlations were performed and R2 and p values are indicated. For the right panel, a paired non-parametric t test was performed; ∗∗∗p < 0.001. (D) Similar to (B), expression and infectivity of full-length and Δ18 WIV1-CoV spike was measured. Error bars indicate standard deviation. (E) Similar to (C), cross-neutralization of serum samples from COVID-19 patients was measured for wild-type SARS-CoV-2 versus WIV1-CoV pseudovirus. ∗∗∗∗p < 0.0001. See also Figure S5.
Figure S5
Figure S5
Characterization of CoV spike expression vectors, related to Figure 6 (A) Surface level expression of SARS-CoV-2 spike protein following transfection of 293T cells. Several constructs of spike were tested: codon-optimized full-length spike from SARS-CoV-2, a truncated version with 18 amino acids deleted from the cytoplasmic tail (Δ18), and a truncated version that also includes a D614G mutation. Expression was measured via flow cytometry by staining with B38 antibody at a concentration of 10 μg/mL followed by staining with an anti-human IgG antibody conjugated to AF647 at 2 μg/mL. (B) Surface level expression of full-length and truncated (Δ18) WIV1-CoV spike proteins were also measured following transfection of 293T cells via flow cytometry. Expression was measured via flow cytometry by staining with CR3022 antibody at a concentration of 10 μg/mL followed by staining with an anti-human IgG antibody conjugated to AF647 at 2 μg/mL. (C) Summary of spike expression data are shown with mean and standard deviation; MFI, median fluorescence intensity. (D and E) Titers of lentivirus pseudotyped with the (D) SARS-CoV-2 or (E) WIV1-CoV spike proteins were measured by transducing ACE2-expressing 293T cells with 100 μL of lentivirus supernatant. (F) Transduction with 10-fold serial dilutions and subsequent assessment of ZsGreen expression by flow cytometry was performed to calculate pseudovirus titer (U/mL) for each construct indicated. Summary data are presented with mean and standard deviation.

Update of

References

    1. Arvin A.M., Fink K., Schmid M.A., Cathcart A., Spreafico R., Havenar-Daughton C., Lanzavecchia A., Corti D., Virgin H.W. A perspective on potential antibody-dependent enhancement of SARS-CoV-2. Nature. 2020;584:353–363. - PubMed
    1. Beigel J.H., Tomashek K.M., Dodd L.E. Remdesivir for the Treatment of Covid-19 - Preliminary Report. Reply. N. Engl. J. Med. 2020;383:994. - PubMed
    1. Boulware D.R., Pullen M.F., Bangdiwala A.S., Pastick K.A., Lofgren S.M., Okafor E.C., Skipper C.P., Nascene A.A., Nicol M.R., Abassi M. A Randomized Trial of Hydroxychloroquine as Postexposure Prophylaxis for Covid-19. N. Engl. J. Med. 2020;383:517–525. - PMC - PubMed
    1. Case J.B., Rothlauf P.W., Chen R.E., Kafai N.M., Fox J.M., Smith B.K., Shrihari S., McCune B.T., Harvey I.B., Keeler S.P. Replication-Competent Vesicular Stomatitis Virus Vaccine Vector Protects against SARS-CoV-2-Mediated Pathogenesis in Mice. Cell Host Microbe. 2020;28:465–474.e4. - PMC - PubMed
    1. Chan K.H., Cheng V.C.C., Woo P.C.Y., Lau S.K.P., Poon L.L.M., Guan Y., Seto W.H., Yuen K.Y., Peiris J.S.M. Serological responses in patients with severe acute respiratory syndrome coronavirus infection and cross-reactivity with human coronaviruses 229E, OC43, and NL63. Clin. Diagn. Lab. Immunol. 2005;12:1317–1321. - PMC - PubMed

Publication types

MeSH terms