

Sensory neurons expressing calcitonin gene-related peptide α regulate adaptive thermogenesis and diet-induced obesity
- PMID: 33412345
- PMCID: PMC7820934
- DOI: 10.1016/j.molmet.2021.101161
Sensory neurons expressing calcitonin gene-related peptide α regulate adaptive thermogenesis and diet-induced obesity
Abstract
Objectives: Heat-sensory neurons from the dorsal root ganglia (DRG) play a pivotal role in detecting the cutaneous temperature and transmission of external signals to the brain, ensuring the maintenance of thermoregulation. However, whether these thermoreceptor neurons contribute to adaptive thermogenesis remains elusive. It is also unknown whether these neurons play a role in obesity and energy metabolism.
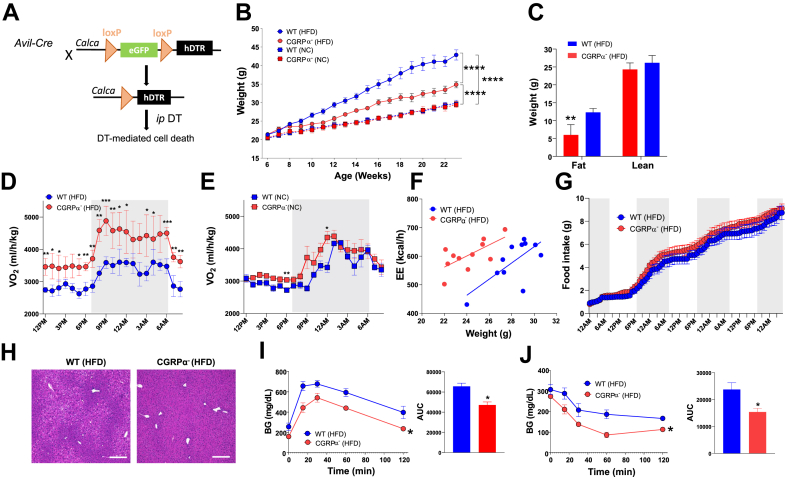
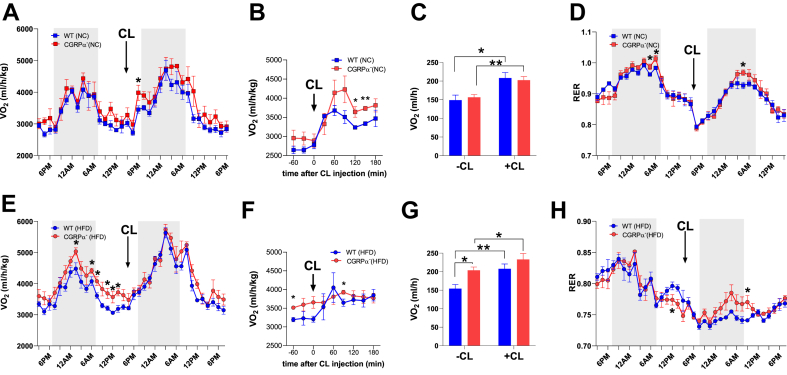
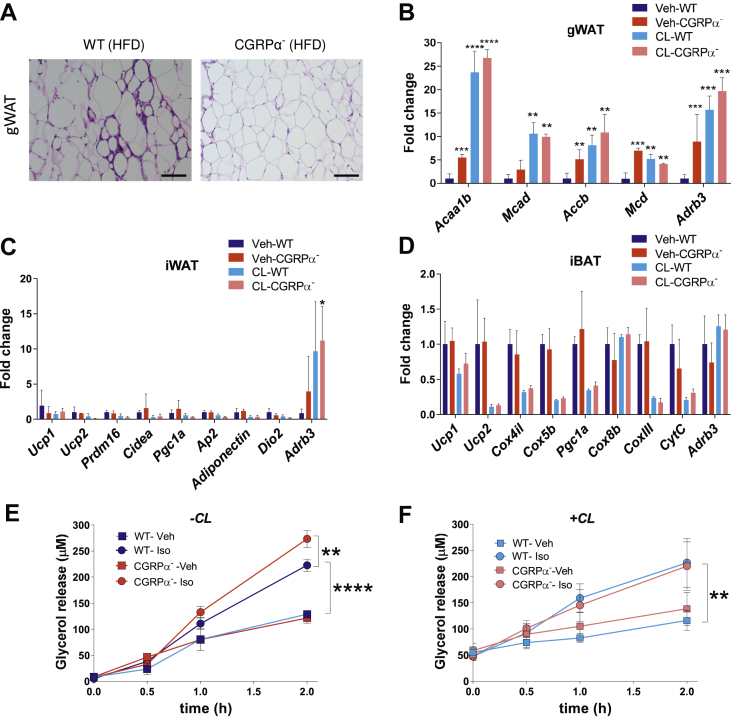
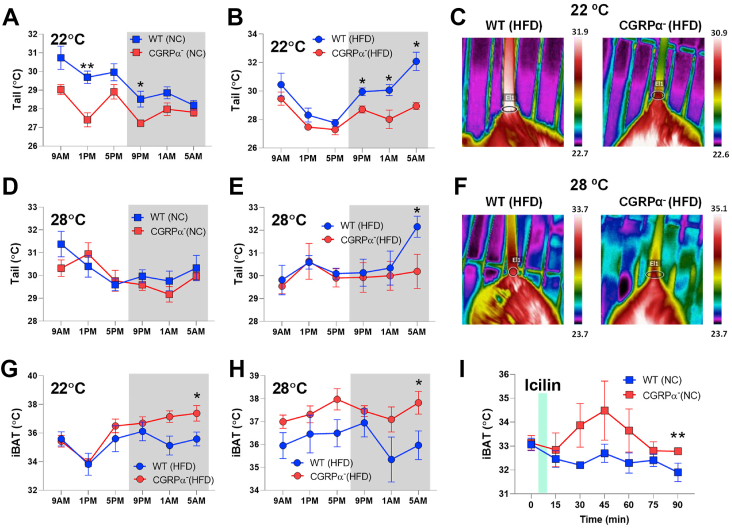
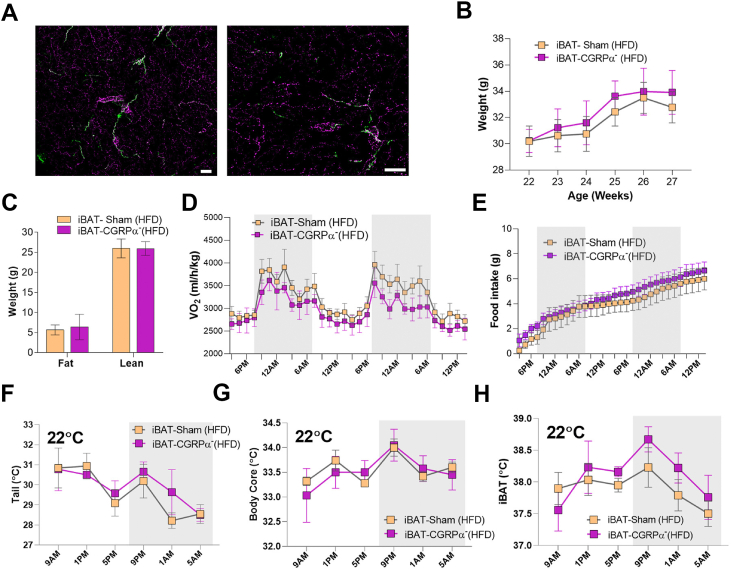
Methods: We used genetic ablation of heat-sensing neurons expressing calcitonin gene-related peptide α (CGRPα) to assess whole-body energy expenditure, weight gain, glucose tolerance, and insulin sensitivity in normal chow and high-fat diet-fed mice. Exvivo lipolysis and transcriptional characterization were combined with adipose tissue-clearing methods to visualize and probe the role of sensory nerves in adipose tissue. Adaptive thermogenesis was explored using infrared imaging of intrascapular brown adipose tissue (iBAT), tail, and core temperature upon various stimuli including diet, external temperature, and the cooling agent icilin.
Results: In this report, we show that genetic ablation of heat-sensing CGRPα neurons promotes resistance to weight gain upon high-fat diet (HFD) feeding and increases energy expenditure in mice. Mechanistically, we found that loss of CGRPα-expressing sensory neurons was associated with reduced lipid deposition in adipose tissue, enhanced expression of fatty acid oxidation genes, higher exvivo lipolysis in primary white adipocytes, and increased mitochondrial respiration from iBAT. Remarkably, mice lacking CGRPα sensory neurons manifested increased tail cutaneous vasoconstriction at room temperature. This exacerbated cold perception was not associated with reduced core temperature, suggesting that heat production and heat conservation mechanisms were engaged. Specific denervation of CGRPα neurons in intrascapular BAT did not contribute to the increased metabolic rate observed upon global sensory denervation.
Conclusions: Taken together, these findings highlight an important role of cutaneous thermoreceptors in regulating energy metabolism by triggering counter-regulatory responses involving energy dissipation processes including lipid fuel utilization and cutaneous vasodilation.
Keywords: CGRP; Energy expenditure; Lipolysis; Obesity; Spinal sensory ganglion; Thermoregulation.
Copyright © 2021 The Author(s). Published by Elsevier GmbH.. All rights reserved.
Figures

Similar articles
-
Enhanced behavioral responses to cold stimuli following CGRPα sensory neuron ablation are dependent on TRPM8.Mol Pain. 2014 Nov 19;10:69. doi: 10.1186/1744-8069-10-69. Mol Pain. 2014. PMID: 25406633 Free PMC article.
-
Adaptive thermogenesis in brown adipose tissue involves activation of pannexin-1 channels.Mol Metab. 2021 Feb;44:101130. doi: 10.1016/j.molmet.2020.101130. Epub 2020 Nov 25. Mol Metab. 2021. PMID: 33248294 Free PMC article.
-
Lipolysis Triggers a Systemic Insulin Response Essential for Efficient Energy Replenishment of Activated Brown Adipose Tissue in Mice.Cell Metab. 2018 Oct 2;28(4):644-655.e4. doi: 10.1016/j.cmet.2018.06.020. Epub 2018 Jul 19. Cell Metab. 2018. PMID: 30033199
-
A cardiac amino-terminal GRK2 peptide inhibits insulin resistance yet enhances maladaptive cardiovascular and brown adipose tissue remodeling in females during diet-induced obesity.J Mol Cell Cardiol. 2023 Oct;183:81-97. doi: 10.1016/j.yjmcc.2023.09.001. Epub 2023 Sep 14. J Mol Cell Cardiol. 2023. PMID: 37714510 Free PMC article. Review.
-
P2X7 Receptor in the Management of Energy Homeostasis: Implications for Obesity, Dyslipidemia, and Insulin Resistance.Front Endocrinol (Lausanne). 2020 May 12;11:199. doi: 10.3389/fendo.2020.00199. eCollection 2020. Front Endocrinol (Lausanne). 2020. PMID: 32528404 Free PMC article. Review.
Cited by
-
Sensory nerve and neuropeptide diversity in adipose tissues.Mol Cells. 2024 Feb;47(2):100030. doi: 10.1016/j.mocell.2024.100030. Epub 2024 Feb 15. Mol Cells. 2024. PMID: 38364960 Free PMC article. Review.
-
Diet-induced loss of adipose hexokinase 2 correlates with hyperglycemia.Elife. 2023 Mar 15;12:e85103. doi: 10.7554/eLife.85103. Elife. 2023. PMID: 36920797 Free PMC article.
-
Wiring the Brain for Wellness: Sensory Integration in Feeding and Thermogenesis: A Report on Research Supported by Pathway to Stop Diabetes.Diabetes. 2024 Mar 1;73(3):338-347. doi: 10.2337/db23-0706. Diabetes. 2024. PMID: 38377445 Free PMC article. Review.
-
Myeloid cell ACE shapes cellular metabolism and function in PCSK-9 induced atherosclerosis.Front Immunol. 2023 Oct 20;14:1278383. doi: 10.3389/fimmu.2023.1278383. eCollection 2023. Front Immunol. 2023. PMID: 37928535 Free PMC article.
-
CGRP physiology, pharmacology, and therapeutic targets: migraine and beyond.Physiol Rev. 2023 Apr 1;103(2):1565-1644. doi: 10.1152/physrev.00059.2021. Epub 2022 Dec 1. Physiol Rev. 2023. PMID: 36454715 Free PMC article. Review.
References
Publication types
MeSH terms
Substances
Grants and funding
LinkOut - more resources
Full Text Sources
Other Literature Sources
Medical
Molecular Biology Databases
Research Materials
