. 2021 Jan 7;16(1):e0245244.
doi: 10.1371/journal.pone.0245244. eCollection 2021.

An influenza HA stalk reactive polymeric IgA antibody exhibits anti-viral function regulated by binary interaction between HA and the antibody

Affiliations

An influenza HA stalk reactive polymeric IgA antibody exhibits anti-viral function regulated by binary interaction between HA and the antibody

Kaori Sano et al. PLoS One. .

Abstract

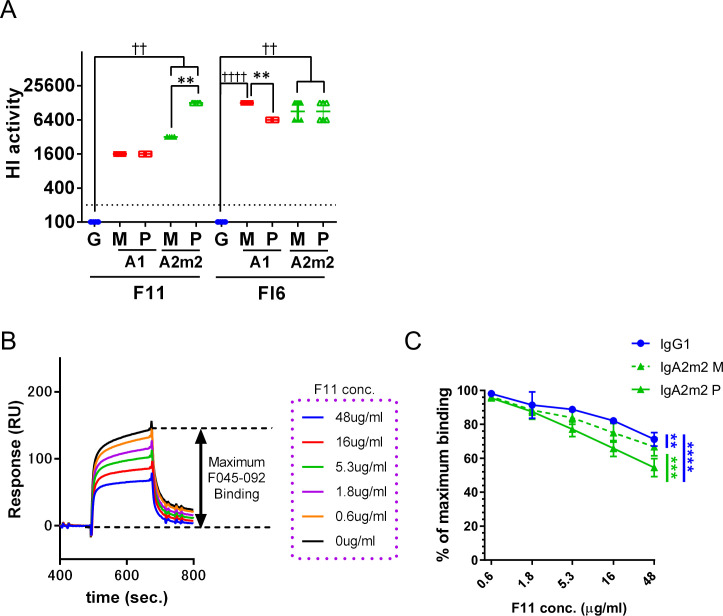
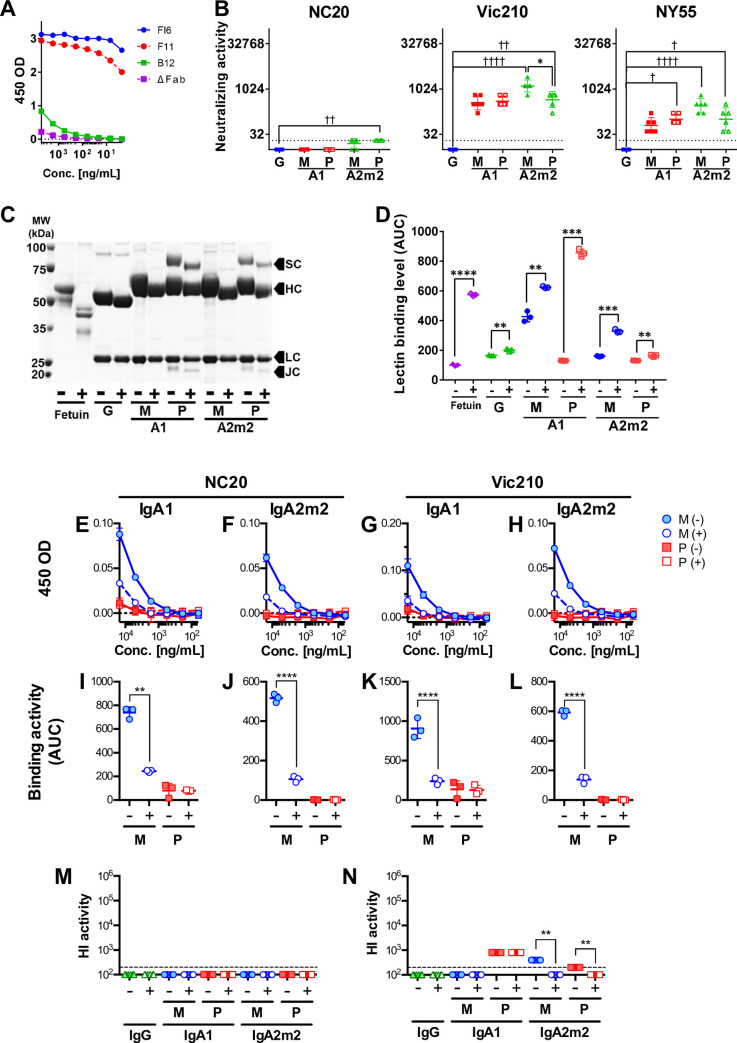
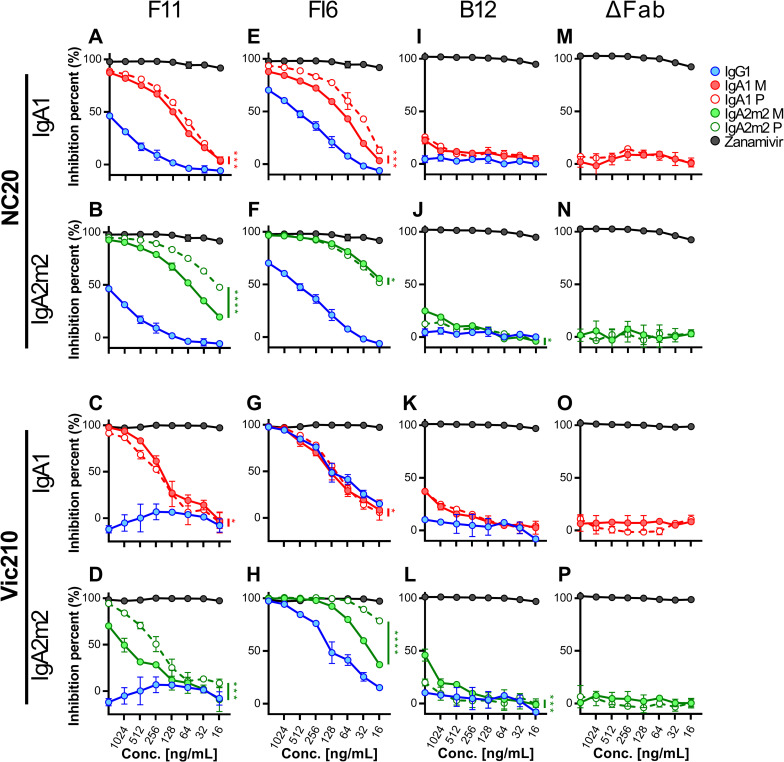
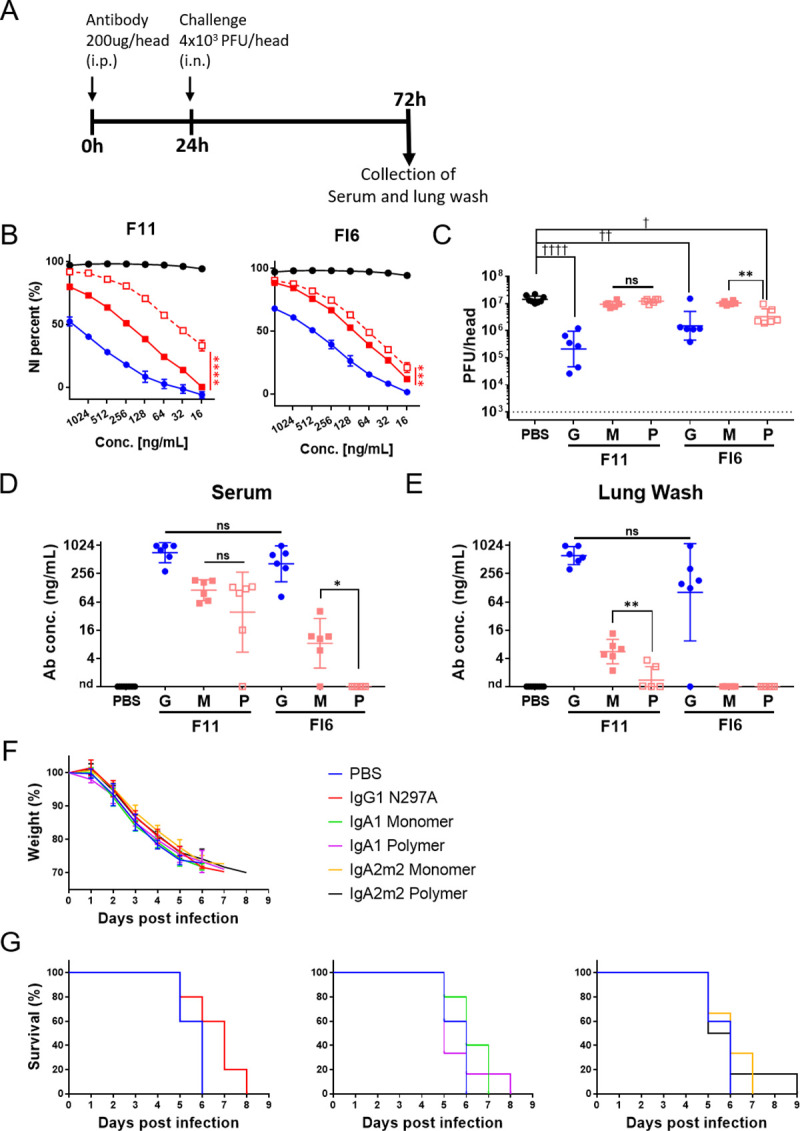
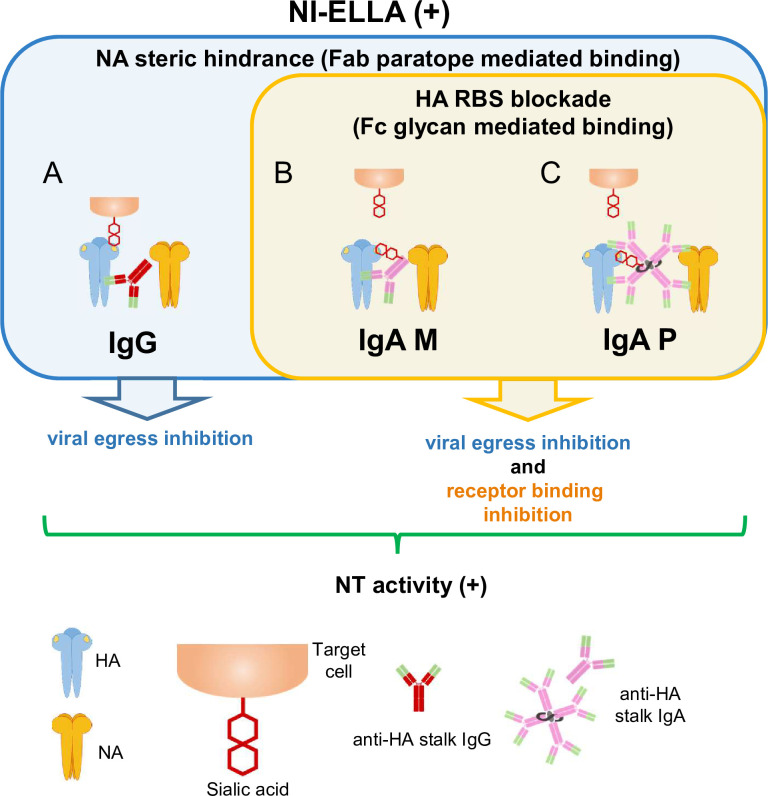
IgA antibodies, which are secreted onto the mucosal surface as secretory IgA antibodies (SIgAs), play an important role in preventing influenza virus infection. A recent study reported that anti-hemagglutinin (HA) head-targeting antibodies increase anti-viral functions such as hemagglutination inhibition (HI) and virus neutralization (NT), in addition to HA binding activity (reactivity) via IgA polymerization. However, the functional properties of anti-viral IgA antibodies with mechanisms of action distinct from those of anti-HA head-targeting antibodies remain elusive. Here, we characterized the functional properties of IgG, monomeric IgA, and polymeric IgA anti-HA stalk-binding clones F11 and FI6, and B12 (a low affinity anti-HA stalk clone), as well as Fab-deficient (ΔFab) IgA antibodies. We found that IgA polymerization impacts the functional properties of anti-HA stalk antibodies. Unlike anti-HA head antibodies, the anti-viral functions of anti-HA stalk antibodies were not simply enhanced by IgA polymerization. The data suggest that two modes of binding (Fab paratope-mediated binding to the HA stalk, and IgA Fc glycan-mediated binding to the HA receptor binding site (RBS)) occur during interaction between anti-stalk HA IgA antibodies and HA. In situations where Fab paratope-mediated binding to the HA stalk exceeded IgA Fc glycan-mediated binding to HA RBS, IgA polymerization increased anti-viral functions. By contrast, when IgA Fc glycan-mediated binding to the HA RBS was dominant, anti-viral activity will fall upon IgA polymerization. In summary, the results suggest that coordination between these two independent binding modules determines whether IgA polymerization has a negative or positive effect on the anti-viral functions of anti-HA stalk IgA antibodies.


Conflict of interest statement

The authors have declared that no competing interests exist.

Figures

Fig 1
Fig 1. IgA polymers mask the hemagglutinin (HA) receptor binding site.
(A) The HI titer for each IgG1, monomeric (M) or polymeric (P) IgA1 (A1), and IgA2m2 (A2m2) antibody derived from clones F11 and FI6, tested against virus strain A/New Caledonia/20/1999 (H1N1, NC20). HI activity is presented in the scatter plots as the geometric mean, with the geometric standard deviation (SD) of six technical replicates. Y-axis values represent the HI titer, calculated as the 100,000/minimum concentration (μg/ml), which represents HI activity. Dotted lines represent the detection limit (y = 200; 500 μg/mL). **p < 0.01, comparing monomers with polymers (Mann–Whitney U test). ☨☨p < 0.01 and ☨☨☨☨p < 0.0001, comparing IgA monomers/polymers with IgG (Kruskal–Wallis test, followed by Dunn’s multiple comparison test). For statistical analysis, a provisional minimum HI activity value (y = 100; 1000 μg/mL) was applied to samples in which the HI activity was below the detection limit. (B) Schematic diagram showing RBS blockade, as assessed by SPR. First, recombinant HA from virus strain A/New Caledonia/20/1999 (H1N1) was bound to IgG1 or to monomeric or polymeric F11 IgA2m2. The amount of F045-092 IgG1 binding to F11-pre-bound HA was then measured to evaluate RBS blocking by F11. The relative response (RU) was acquired immediately after addition of F045-092 IgG1 (binding stability). The maximum stability value was acquired by measuring the RU immediately following binding of F045-092 IgG1 to free HA. (C) Binding of F045-092 IgG1 to F11 IgG1-, IgA2m2-, or IgA2m2-pre-bound HA. Y-axis values represent the ratio of F045-092 IgG1 binding to the maximum stability value. **p < 0.01, ***p < 0.001, and ****p < 0.0001 (two-way ANOVA).
Fig 2
Fig 2. Deglycosylation of IgA antibodies and functional analyses of deglycosylated B12 IgA antibodies.
(A) Reactivity of FI6, F11, B12, and ΔFab monomeric IgA1 with the recombinant A/Brisbane/59/2007 (H1N1) HA stalk. (B) Virus neutralizing (NT) activity of IgG1, monomeric (M), or polymeric (P) IgA1 (A1), and monomeric (M) or polymeric (P) IgA2m2 (A2m2) derived from antibody clone B12 against virus strains A/New Caledonia/20/1999 (H1N1, NC20), A/Victoria/210/2009 (H3N2, Vic210), and A/New York/55/2004 (H3N2, NY55). NT activity is presented in the scatter plots as the geometric mean, with the geometric standard deviation (SD) from six technical replicates. Y-axis values represent neutralizing titers, calculated as 10,000/minimum concentration (μg/ml) of antibody that neutralized the virus. Dotted lines represent the detection limit (y = 20; 500 μg/mL). *p < 0.05, comparing monomers with polymers (Mann–Whitney U test). ☨p < 0.05, ☨☨p < 0.01, ☨☨☨☨p < 0.0001, comparing IgA monomers/polymers with IgG (Kruskal–Wallis test, followed by Dunn’s multiple comparison test). For statistical analysis, a provisional minimum NT activity value (y = 10; 1000 μg/mL) was applied to samples in which HI activity was below the detection limit. (C) SDS-PAGE analysis of monomeric (M) and polymeric (P) B12 IgG1 (G), IgA1 (A1), and IgA2m2 (A2m2) antibodies incubated with (+) or without (-) deglycosylation enzymes. Fetuin, the band for which shifted (i.e., a reduction in molecular weight) after deglycosylation, was used as positive control. All four components of secretory IgA antibodies (heavy chain [HC], light chain [LC], secretory component [SC], and the J chain [JC]) were observed. The heavy chain, secretory component, and J chain bands of IgA shifted down slightly (reduced molecular weight) after deglycosylation (D) Deglycosylation of samples was confirmed in an enzyme-linked lectin assay (ELLA). The area under the reactivity curve (AUC) was calculated from reactivity curves for lectin and each sample was treated in the presence (+) or absence (-) of deglycosylation enzymes. Data are expressed as the mean ± SD of three technical replicates. Treatment with deglycosylation enzymes led to a significant increase in lectin binding in all samples, suggesting successful deglycosylation. **p<0.01, ***p<0.001, and ****p<0.0001 (Welch’s test). (E–H) Reactivity of glycosylated (-) and deglycosylated (+) monomeric (M) and polymeric (P) B12 IgA1 (E and G) and IgA2m2 (F and H) antibodies with recombinant HA protein from the NC20 (E and F) and Vic210 (G and H) viruses. (I–L) AUC for each glycosylated (-) and deglycosylated (+) monomeric (M) and polymeric (P) B12 IgA1 (I and K) and IgA2m2 (J and L) antibody tested against the recombinant HA protein of the NC20 (I and J) and Vic210 (K and L) viruses. The AUC was calculated from the plots in E–H. Data are expressed as the mean ± SD of three technical replicates. Deglycosylation reduced the reactivity of B12 monomeric IgA1 and IgA2m2. **p < 0.01 and ****p<0.0001 (Welch’s test). (M and N) HI titer for each glycosylated (-) and deglycosylated (+) B12 IgG1 (G), monomeric (M), or polymeric (P) IgA1 (A1) and IgA2m2 (A2m2) antibody tested against virus strains NC20 (M) and Vic210 (N). HI activity is presented in the scatter plots as the geometric mean, with the geometric SD of three technical replicates. Y-axis values represent the HI titer, calculated as the 100,000/minimum concentration (μg/ml), which represents HI activity. Dotted lines represent the detection limit (y = 200; 500 μg/mL). **p < 0.01, comparing monomers with polymers (Mann–Whitney U test). For statistical analysis, a provisional minimum HI activity value (y = 100; 1000 μg/mL) was used for samples in which the HI activity was below the detection limit.
Fig 3
Fig 3. Comparison of the neuraminidase inhibition activity of IgG with that of IgA monomers and polymers.
Neuraminidase inhibition (NI) activity of IgG1, monomeric (M) or polymeric (P) IgA1, and monomeric (M) or polymeric (P) IgA2m2 derived from antibody clones F11 (A–D), FI6 (E-H), and B12 (I–L), as well as Fab-deficient (ΔFab) IgA antibodies (M–P), against virus strains A/New Caledonia/20/1999 (H1N1, NC20) (A, B, E, F, I, J, M, and N) and A/Victoria/210/2009 (H3N2, Vic210) (C, D, G, H, K, L, O, and P). NI activity is presented as inhibition curves, with each point and error bar representing the mean ± SD of three technical replicates. Y-axis values represent percentage inhibition of neuraminidase activity. The OD values of wells incubated without antibodies were normalized to y = 100, and the OD values of wells incubated without virus were normalized to y = 0. X-axis values represent the concentration of antibody added to each well. Zanamivir, a neuraminidase inhibitor, was used as a positive control. *p < 0.05, **p < 0.01, ***p < 0.001, and ****p < 0.0001, comparing monomers with polymers (two-way ANOVA).
Fig 4
Fig 4. In vivo passive transfer of recombinant IgG and IgA antibodies to mice.
(A) Experimental schedule. Six-week-old female BALB/c mice (six per experimental condition) were injected intraperitoneally with IgG1 (G) or IgA1 monomers (M), with polymers (P) of F11 or FI6 antibodies (200 μg/200 μl per mouse), or with PBS (200 μl per mouse) 24 hours prior to challenge with virus. Next, mice received 4×10³ plaque-forming units (PFU) of mNRT virus administered intranasally via the left nostril (20 μl per mouse) to infect the lower respiratory tracts. At 3 days post-infection, lung wash samples were collected. (B) NI activity of IgG1 and monomeric or polymeric IgA1 derived from antibody clones F11 and FI6 against virus strain A/California/7/2009 (H1N1). NI activity is presented as inhibition curves, with each point and error bar representing the mean ± SD of three technical replicates. Y-axis values represent percentage inhibition of neuraminidase activity. The OD values for wells incubated without antibodies were normalized to y = 100, and those for wells incubated without virus were normalized to y = 0. X-axis values denote the concentration of antibody added to each well. Black line, Zanamivir; blue line, IgG1; red solid line, IgA1 monomer; red dotted line, IgA1 polymer. ***p < 0.001 and ****p < 0.0001, comparing monomers with polymers (two-way ANOVA). (C) Virus titers in lung wash samples collected at 3 days post-infection. Virus titers are presented in scatter plots as the geometric mean, with the geometric SD. Y-axis values represent plaque-forming units (PFU)/mouse, which is equal to PFU/2mL of lung wash, as calculated from the results of the plaque assay. The dotted line denotes the detection limit (1000 PFU/mouse). **p< 0.01, comparing monomers with polymers (Mann–Whitney test). ☨p< 0.05, ☨☨p< 0.01, and ☨☨☨☨p< 0.0001, comparing IgA monomers/polymers with IgG (Kruskal–Wallis test, followed by Dunn’s multiple comparison test). (D, E) Antibody concentrations in serum (D) and lung wash (E) samples collected at 3 days post-infection. Antibody concentrations are expressed on scatter plots as the geometric mean, with the geometric SD. *p< 0.05 and **p< 0.01, comparing monomers with polymers (Mann–Whitney test). For statistical analysis, a provisional antibody concentration (1 ng/mL) was applied to samples in which antibody concentrations were below the detection limit. ns: not significant, nd: not detected. (F) Body weight changes in 6-week-old female BALB/c mice (five or six per experimental condition) following lethal infection with mNRT virus. Mice were injected intraperitoneally with IgG1 harboring the N297A mutation (IgG1 N297A), gA1/IgA2m2 monomers, polymers of FI6 antibodies (200 μg/200 μl per mouse), or PBS (200 μl per mouse) 2 hours prior to challenge with virus. Next, mice received 4 × 10³ plaque-forming units (PFU) of mNRT virus intranasally via the left nostril (20 μl per mouse) to infect the lower respiratory tract. The body weight of each mouse was normalized to that at Day 0 (the date of virus infection; y = 100). (G) Survival of mice following lethal virus infection. The survival curves for the groups receiving IgG1 N297A (left), IgA1 (middle), and IgA2m2 (right) are shown in different panels, with the survival curve of the PBS administered group used as the negative control.
Fig 5
Fig 5. Summary of the mechanisms underlying anti-viral activity mediated by anti-HA stalk antibodies.
Different modes of interaction among anti-HA stalk antibodies, NA, and HA molecules that confer anti-viral activity (including NI activity) detected in the NI-ELLA. These interactions mediate NI activity via two binding modes between antibodies and HA: Fab paratope-mediated binding to the HA stalk and Fc glycan-mediated binding to the HA head. (A) In the case of anti-HA stalk-binding IgG antibodies, Fab paratope-mediated binding to the HA stalk will cause steric hindrance of neighboring NA molecules and inhibit viral egress, leading to NT activity. (B and C) In the case of HA stalk-targeting IgA antibodies, Fc glycan-mediated binding will cause HI activity due to blockade of the receptor binding site on HA, thereby inhibiting binding of sialic acid to the receptor binding site. In these interaction modes, simultaneous steric hindrance of neighboring NA molecules and blockade of the receptor binding site may also occur, leading to inhibition of both viral egress and receptor binding.

Similar articles

Cited by

References

    1. Asahi-Ozaki Y, Yoshikawa T, Iwakura Y, Suzuki Y, Tamura SI, Kurata T, et al. Secretory IgA antibodies provide cross-protection against infection with different strains of influenza B virus. J Med Virol. 2004;74: 328–335. 10.1002/jmv.20173 - DOI - PubMed
    1. Tamura S ‐I, Funato H, Hirabayashi Y, Suzuki V, Nagamine T, Aizawa C, et al. Cross‐protection against influenza A virus infection by passively transferred respiratory tract IgA antibodies to different hemagglutinin molecules. Eur J Immunol. 1991;21: 1337–1344. 10.1002/eji.1830210602 - DOI - PubMed
    1. Tamura S, Funato H, Hirabayashi Y, Kikuta K, Suzuki Y, Nagamine T, et al. Functional role of respiratory tract haemagglutinin-specific IgA antibodies in protection against influenza. Vaccine. 1990;8: 479–85. Available: http://www.ncbi.nlm.nih.gov/pubmed/2251874 10.1016/0264-410x(90)90250-p - DOI - PubMed
    1. Hasegawa H, Ichinohe T, Tamura SI, Kurata T. Development of a mucosal vaccine for influenza viruses: Preparation for a potential influenza pandemic. Expert Review of Vaccines. 2007. 10.1586/14760584.6.2.193 - DOI - PubMed
    1. Waldman RH, Wood SH, Torres EJ, Small PA. Influenza antibody response following aerosal administration of inactivated virus. Am J Epidemiol. 1970;91: 574–85. Available: http://www.ncbi.nlm.nih.gov/pubmed/5445644 - PubMed

Publication types

MeSH terms