

Gene expression patterns of red sea urchins (Mesocentrotus franciscanus) exposed to different combinations of temperature and pCO2 during early development
- PMID: 33413121
- PMCID: PMC7792118
- DOI: 10.1186/s12864-020-07327-x
Gene expression patterns of red sea urchins (Mesocentrotus franciscanus) exposed to different combinations of temperature and pCO2 during early development
Abstract
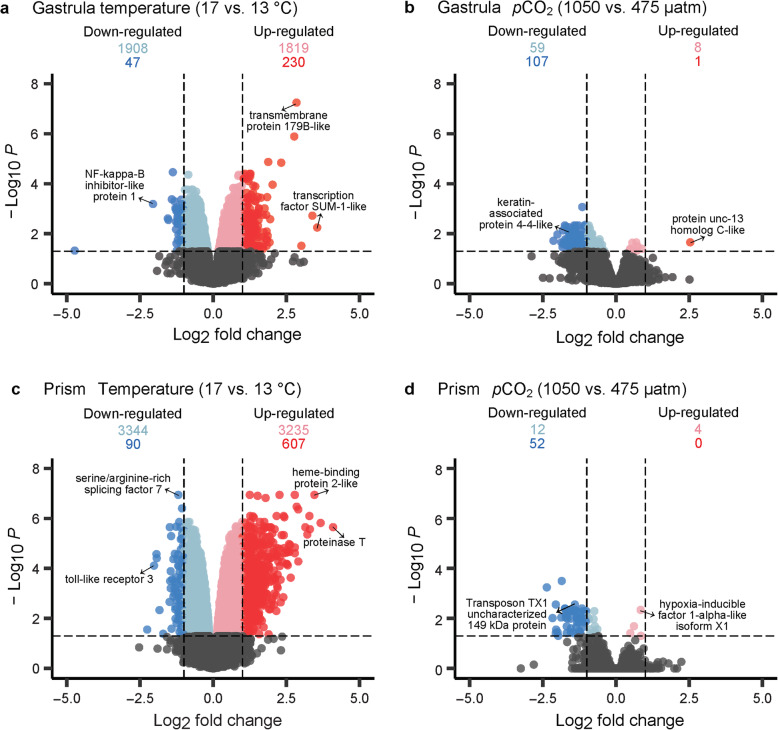
Background: The red sea urchin Mesocentrotus franciscanus is an ecologically important kelp forest herbivore and an economically valuable wild fishery species. To examine how M. franciscanus responds to its environment on a molecular level, differences in gene expression patterns were observed in embryos raised under combinations of two temperatures (13 °C or 17 °C) and two pCO2 levels (475 μatm or 1050 μatm). These combinations mimic various present-day conditions measured during and between upwelling events in the highly dynamic California Current System with the exception of the 17 °C and 1050 μatm combination, which does not currently occur. However, as ocean warming and acidification continues, warmer temperatures and higher pCO2 conditions are expected to increase in frequency and to occur simultaneously. The transcriptomic responses of the embryos were assessed at two developmental stages (gastrula and prism) in light of previously described plasticity in body size and thermotolerance under these temperature and pCO2 treatments.
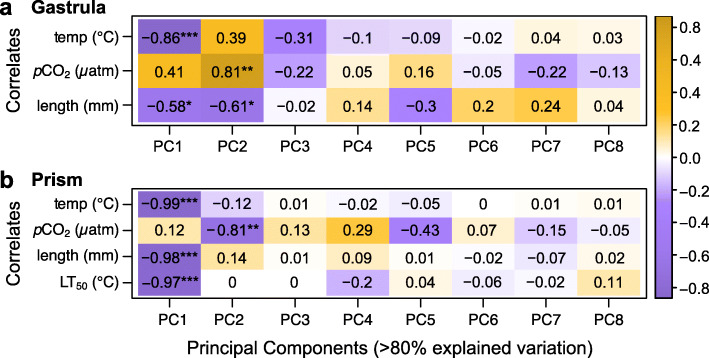
Results: Although transcriptomic patterns primarily varied by developmental stage, there were pronounced differences in gene expression as a result of the treatment conditions. Temperature and pCO2 treatments led to the differential expression of genes related to the cellular stress response, transmembrane transport, metabolic processes, and the regulation of gene expression. At each developmental stage, temperature contributed significantly to the observed variance in gene expression, which was also correlated to the phenotypic attributes of the embryos. On the other hand, the transcriptomic response to pCO2 was relatively muted, particularly at the prism stage.
Conclusions: M. franciscanus exhibited transcriptomic plasticity under different temperatures, indicating their capacity for a molecular-level response that may facilitate red sea urchins facing ocean warming as climate change continues. In contrast, the lack of a robust transcriptomic response, in combination with observations of decreased body size, under elevated pCO2 levels suggest that this species may be negatively affected by ocean acidification. High present-day pCO2 conditions that occur due to coastal upwelling may already be influencing populations of M. franciscanus.
Keywords: Climate change; Early development; Mesocentrotus franciscanus; Ocean acidification; RNA-seq; Red sea urchin; Transcriptomics; Warming.
Conflict of interest statement
The authors declare that they have no competing interests.
Figures


References
-
- Ebert TA, Dixon JD, Schroeter SC, Kalvass PE, Richmond NT, WA, Woodby DA. Growth and mortality of red sea urchins Strongylocentrotus franciscanus across a latitudinal gradient. Mar Ecol Prog Ser. 1999;190:189–209. doi: 10.3354/meps190189. - DOI
-
- Rogers-Bennett L. Developments in Aquaculture and Fisheries Science. 2007. The ecology of Strongylocentrotus franciscanus and Strongylocentrotus purpuratus; pp. 393–425.
-
- Leighton D, Jones L, North W. Ecological relationships between giant kelp and sea urchins in southern California. In: Young E, Maclachlan J, editors. Proceedings of the 5th international seaweed symposium. Oxford, London, Edinburgh, New York, Toronto, Sydney, Paris, and Braunschweig: Pergamon Press; 1966. p. 141–53.
-
- Filbee-Dexter K, Scheibling RE. Sea urchin barrens as alternative stable states of collapsed kelp ecosystems. Mar Ecol Prog Ser. 2014;495:1–25. doi: 10.3354/meps10573. - DOI
-
- Tegner MJ, Levin LA. Spiny lobsters and sea urchins: analysis of a predator-prey interaction. J Exp Mar Biol Ecol. 1983;73(2):125–150. doi: 10.1016/0022-0981(83)90079-5. - DOI
MeSH terms
Substances
Grants and funding
LinkOut - more resources
Full Text Sources
Other Literature Sources
Miscellaneous
