

Development of a predictive model for integrated medical and long-term care resource consumption based on health behaviour: application of healthcare big data of patients with circulatory diseases
- PMID: 33413377
- PMCID: PMC7792071
- DOI: 10.1186/s12916-020-01874-6
Development of a predictive model for integrated medical and long-term care resource consumption based on health behaviour: application of healthcare big data of patients with circulatory diseases
Abstract
Background: Medical costs and the burden associated with cardiovascular disease are on the rise. Therefore, to improve the overall economy and quality assessment of the healthcare system, we developed a predictive model of integrated healthcare resource consumption (Adherence Score for Healthcare Resource Outcome, ASHRO) that incorporates patient health behaviours, and examined its association with clinical outcomes.
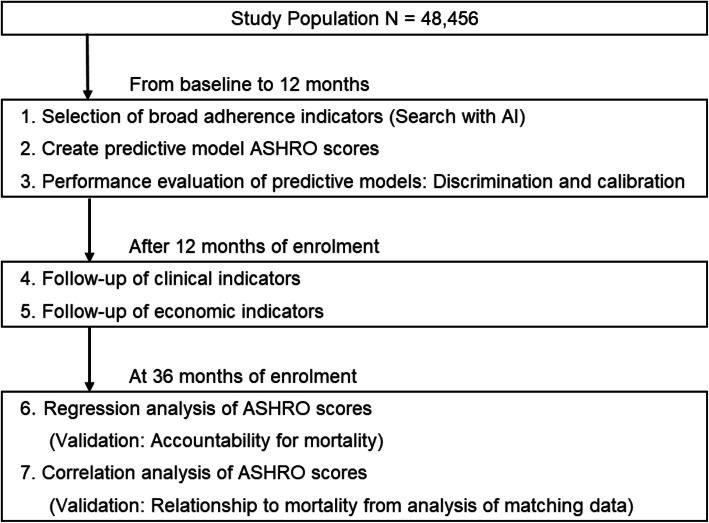
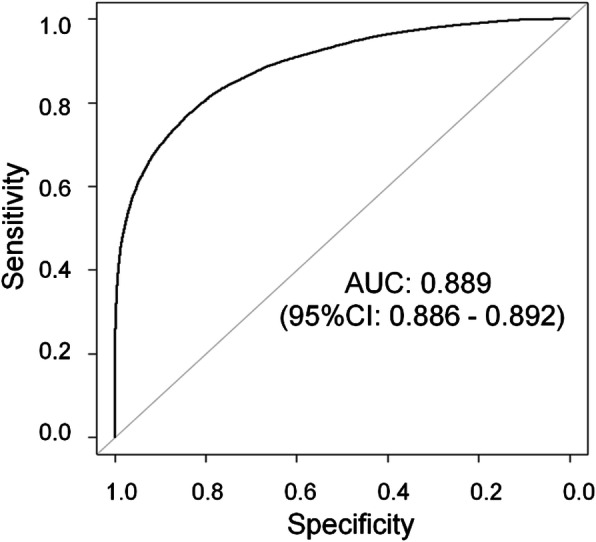
Methods: This study used information from a large-scale database on health insurance claims, long-term care insurance, and health check-ups. Participants comprised patients who received inpatient medical care for diseases of the circulatory system (ICD-10 codes I00-I99). The predictive model used broadly defined composite adherence as the explanatory variable and medical and long-term care costs as the objective variable. Predictive models used random forest learning (AI: artificial intelligence) to adjust for predictors, and multiple regression analysis to construct ASHRO scores. The ability of discrimination and calibration of the prediction model were evaluated using the area under the curve and the Hosmer-Lemeshow test. We compared the overall mortality of the two ASHRO 50% cut-off groups adjusted for clinical risk factors by propensity score matching over a 48-month follow-up period.
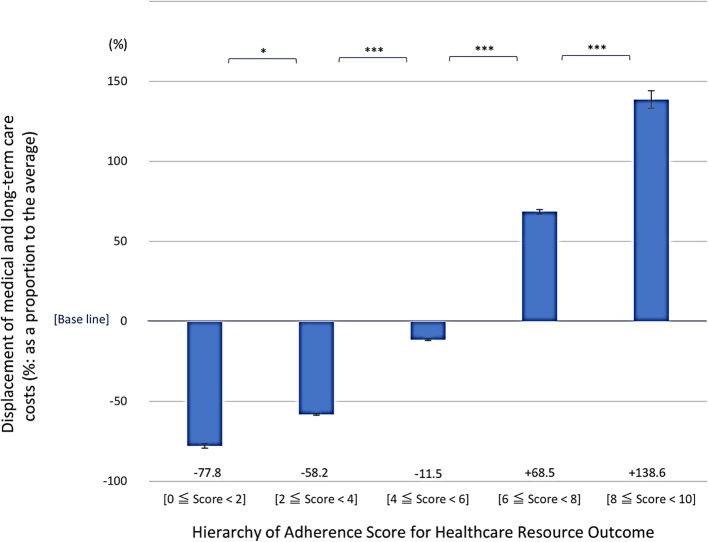
Results: Overall, 48,456 patients were discharged from the hospital with cardiovascular disease (mean age, 68.3 ± 9.9 years; male, 61.9%). The broad adherence score classification, adjusted as an index of the predictive model by machine learning, was an index of eight: secondary prevention, rehabilitation intensity, guidance, proportion of days covered, overlapping outpatient visits/clinical laboratory and physiological tests, medical attendance, and generic drug rate. Multiple regression analysis showed an overall coefficient of determination of 0.313 (p < 0.001). Logistic regression analysis with cut-off values of 50% and 25%/75% for medical and long-term care costs showed that the overall coefficient of determination was statistically significant (p < 0.001). The score of ASHRO was associated with the incidence of all deaths between the two 50% cut-off groups (2% vs. 7%; p < 0.001).
Conclusions: ASHRO accurately predicted future integrated healthcare resource consumption and was associated with clinical outcomes. It can be a valuable tool for evaluating the economic usefulness of individual adherence behaviours and optimising clinical outcomes.
Keywords: Artificial intelligence; Circulatory diseases; Clinical outcome; Health behaviour; Healthcare big data; Medical and long-term care resource consumption.
Conflict of interest statement
T. Takura reports grants from Nihon Medi-Physics Co., Ltd.; Terumo Corporation; and Fujifilm Toyama Chemical Co., Ltd., outside the submitted work.
The other authors declare that they have no competing interests.
Figures

Similar articles
-
Relationship between glycemic control and diabetes-related hospital costs in patients with type 1 or type 2 diabetes mellitus.J Manag Care Pharm. 2010 May;16(4):264-75. doi: 10.18553/jmcp.2010.16.4.264. J Manag Care Pharm. 2010. PMID: 20433217 Free PMC article.
-
Healthcare utilization and costs of patients with rosacea in an insured population.J Drugs Dermatol. 2008 Jan;7(1):41-9. J Drugs Dermatol. 2008. PMID: 18246697
-
Real-World Economic Outcomes During Time on Treatment Among Patients Who Initiated Sunitinib or Pazopanib as First Targeted Therapy for Advanced Renal Cell Carcinoma: A Retrospective Analysis of Medicare Claims Data.J Manag Care Spec Pharm. 2018 Jun;24(6):525-533. doi: 10.18553/jmcp.2018.24.6.525. J Manag Care Spec Pharm. 2018. PMID: 29799328 Free PMC article.
-
Use of Claims Data for Cost and Cost-Effectiveness Research.Semin Radiat Oncol. 2019 Oct;29(4):348-353. doi: 10.1016/j.semradonc.2019.05.009. Semin Radiat Oncol. 2019. PMID: 31472737 Free PMC article. Review.
-
Role of Big Data in Cardiovascular Research.J Am Heart Assoc. 2019 Jul 16;8(14):e012791. doi: 10.1161/JAHA.119.012791. Epub 2019 Jul 11. J Am Heart Assoc. 2019. PMID: 31293194 Free PMC article. Review. No abstract available.
Cited by
-
Factors Influencing Drug Prescribing for Patients With Hospitalization History in Circulatory Disease-Patient Severity, Composite Adherence, and Physician-Patient Relationship: Retrospective Cohort Study.JMIR Aging. 2024 Dec 6;7:e59234. doi: 10.2196/59234. JMIR Aging. 2024. PMID: 39421979 Free PMC article.
-
Patient perspective on predictive models in healthcare: translation into practice, ethical implications and limitations?BMJ Health Care Inform. 2025 Jan 16;32(1):e101153. doi: 10.1136/bmjhci-2024-101153. BMJ Health Care Inform. 2025. PMID: 39824519 Free PMC article.
-
Predicting the individualized risk of human immunodeficiency virus infection among sexually active women in Ethiopia using a nomogram: prediction model development and validation.Front Public Health. 2024 Jun 24;12:1375270. doi: 10.3389/fpubh.2024.1375270. eCollection 2024. Front Public Health. 2024. PMID: 38979038 Free PMC article.
-
Challenges in predictive modelling of chronic kidney disease: A narrative review.World J Nephrol. 2024 Sep 25;13(3):97214. doi: 10.5527/wjn.v13.i3.97214. World J Nephrol. 2024. PMID: 39351189 Free PMC article. Review.
-
Identification and Prediction of Chronic Diseases Using Machine Learning Approach.J Healthc Eng. 2022 Feb 25;2022:2826127. doi: 10.1155/2022/2826127. eCollection 2022. J Healthc Eng. 2022. PMID: 35251563 Free PMC article.
References
-
- Ishihara H, Suzuki M. Japanese guidelines for the management of stroke 2015: overview of the chapter on subarachnoid hemorrhage. Nihon Rinsho. 2016;74:677–680. - PubMed
-
- The Japanese Registry of All Cardiac and Vascular Diseases (JROAD). Annual Rep. 2018. http://www.j-circ.or.jp/jittai_chosa/jittai_chosa2018web.pdf. Accessed 21 Aug 2020.
-
- Takura T. Current trends in medical economics in the circulatory field―socioeconomics background and research issue. Circ Rep. 2019;1:342–346. doi: 10.1253/circrep.CR-19-0031. - DOI - PMC - PubMed
-
- Minematsu K. Stroke and cardiovascular disease control act. Jpn J Thromb Hemost. 2019;30:862–865. doi: 10.2491/jjsth.30.862. - DOI
Publication types
MeSH terms
LinkOut - more resources
Full Text Sources
Other Literature Sources
