

Sputum ACE2, TMPRSS2 and FURIN gene expression in severe neutrophilic asthma
- PMID: 33413387
- PMCID: PMC7788167
- DOI: 10.1186/s12931-020-01605-8
Sputum ACE2, TMPRSS2 and FURIN gene expression in severe neutrophilic asthma
Erratum in
-
Correction to: Sputum ACE2, TMPRSS2 and FURIN gene expression in severe neutrophilic asthma.Respir Res. 2021 Feb 8;22(1):47. doi: 10.1186/s12931-021-01642-x. Respir Res. 2021. PMID: 33557817 Free PMC article. No abstract available.
Abstract
Background: Patients with severe asthma may have a greater risk of dying from COVID-19 disease. Angiotensin converting enzyme-2 (ACE2) and the enzyme proteases, transmembrane protease serine 2 (TMPRSS2) and FURIN, are needed for viral attachment and invasion into host cells.
Methods: We examined microarray mRNA expression of ACE2, TMPRSS2 and FURIN in sputum, bronchial brushing and bronchial biopsies of the European U-BIOPRED cohort. Clinical parameters and molecular phenotypes, including asthma severity, sputum inflammatory cells, lung functions, oral corticosteroid (OCS) use, and transcriptomic-associated clusters, were examined in relation to gene expression levels.
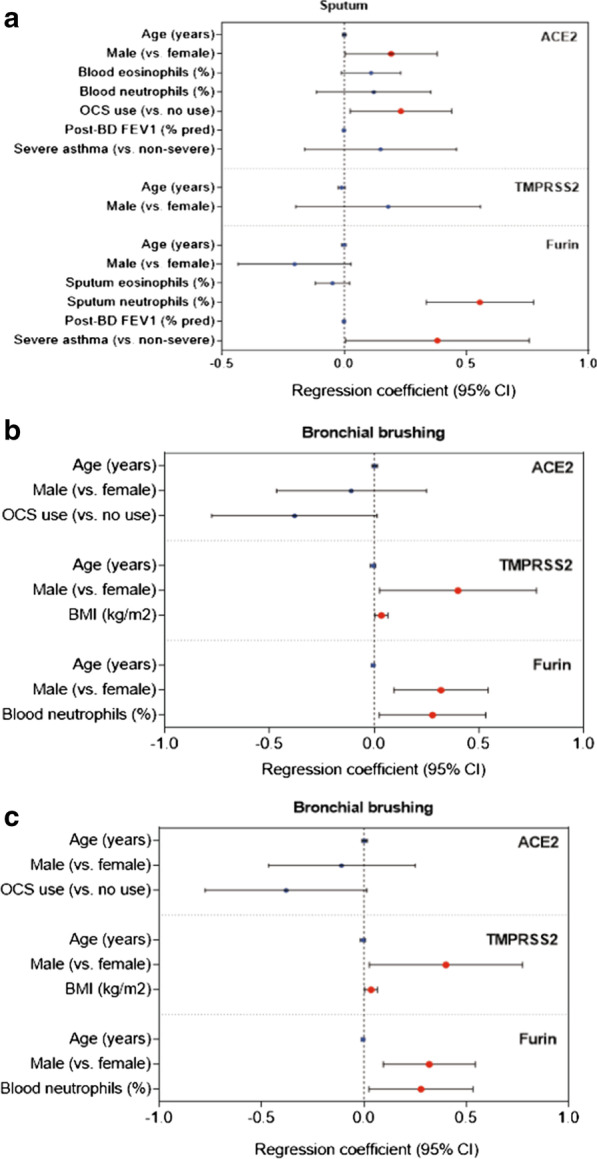
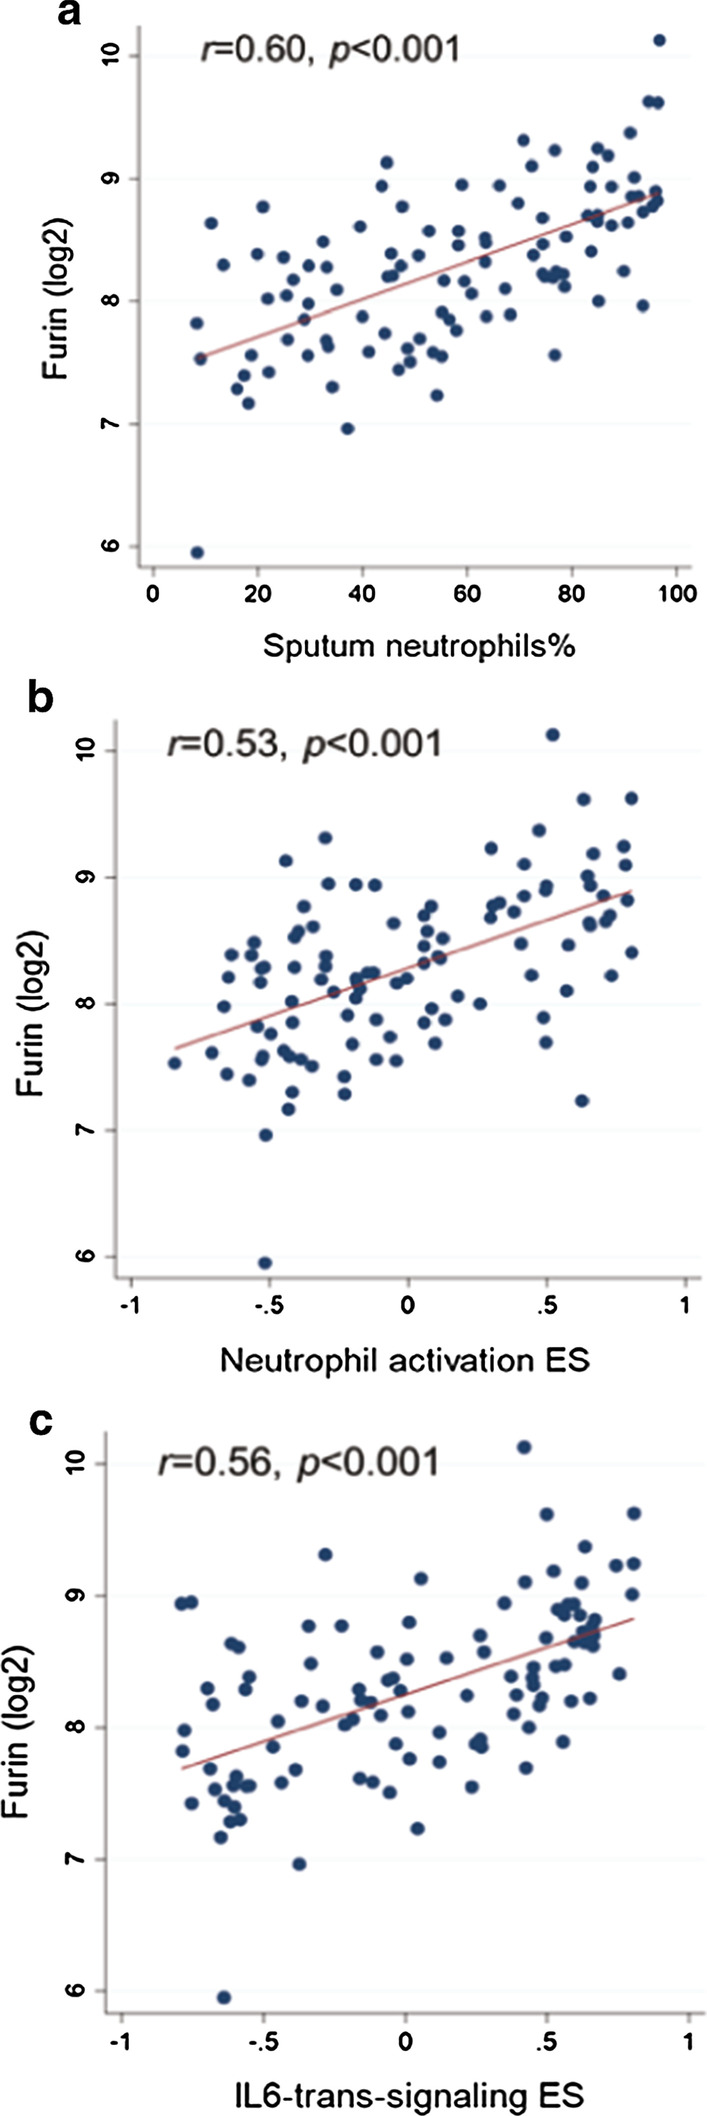
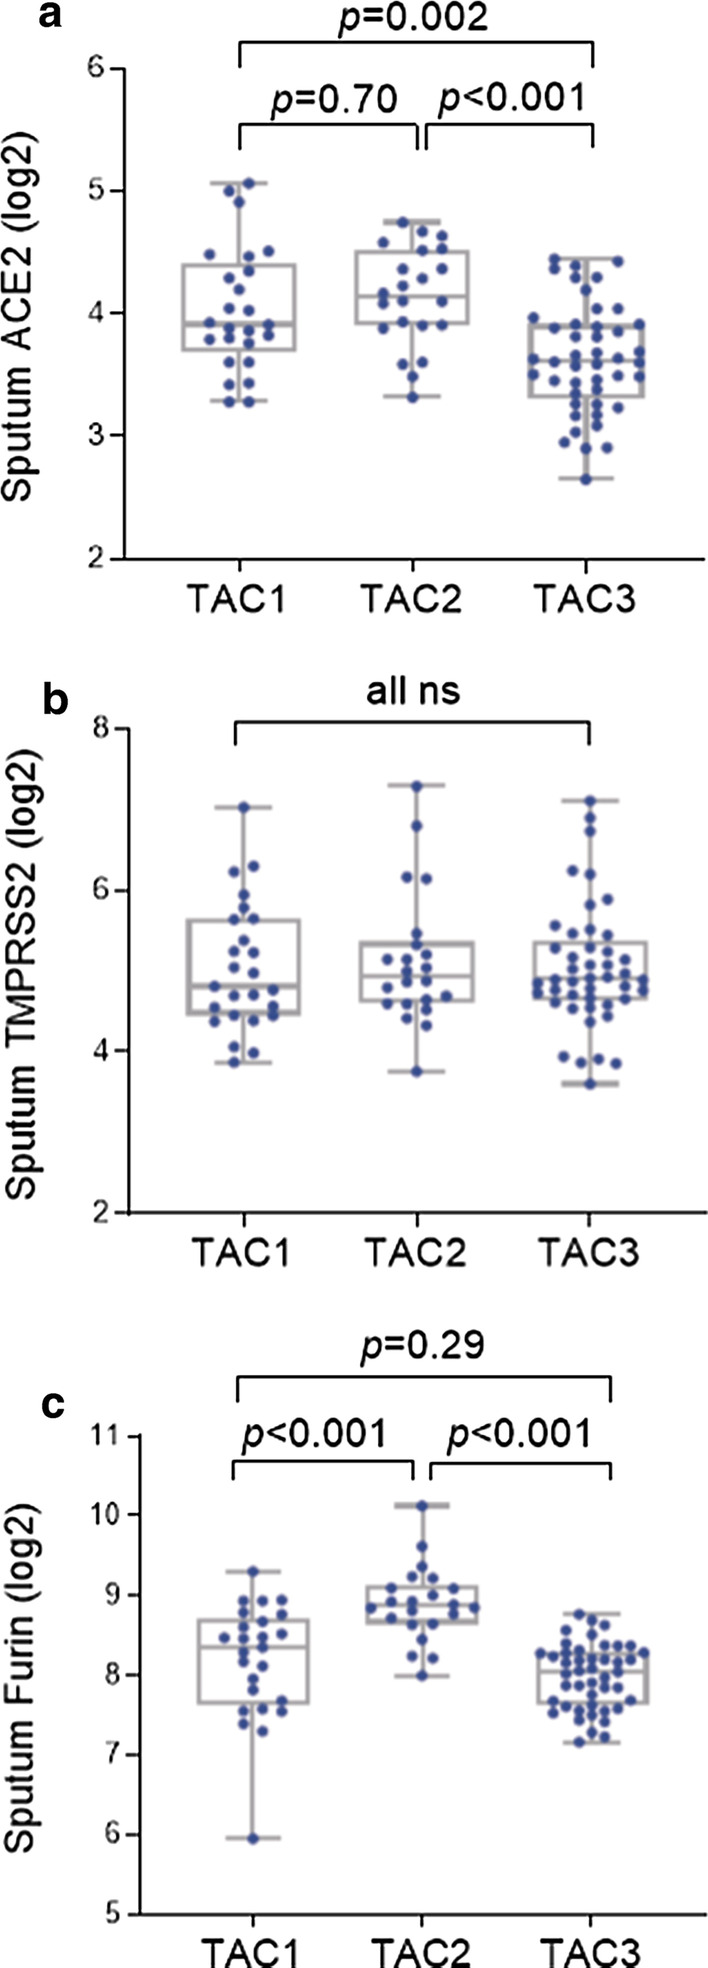
Results: ACE2 levels were significantly increased in sputum of severe asthma compared to mild-moderate asthma. In multivariate analyses, sputum ACE2 levels were positively associated with OCS use and male gender. Sputum FURIN levels were significantly related to neutrophils (%) and the presence of severe asthma. In bronchial brushing samples, TMPRSS2 levels were positively associated with male gender and body mass index, whereas FURIN levels with male gender and blood neutrophils. In bronchial biopsies, TMPRSS2 levels were positively related to blood neutrophils. The neutrophilic molecular phenotype characterised by high inflammasome activation expressed significantly higher FURIN levels in sputum than the eosinophilic Type 2-high or the pauci-granulocytic oxidative phosphorylation phenotypes.
Conclusion: Levels of ACE2 and FURIN may differ by clinical or molecular phenotypes of asthma. Sputum FURIN expression levels were strongly associated with neutrophilic inflammation and with inflammasome activation. This might indicate the potential for a greater morbidity and mortality outcome from SARS-CoV-2 infection in neutrophilic severe asthma.
Keywords: ACE2; FURIN; Neutrophil; Severe asthma; TMPRSS2.
Conflict of interest statement
Dr Djukanovic reports receiving fees for lectures at symposia organised by Novartis, AstraZeneca and TEVA, consultation for TEVA and Novartis as member of advisory boards, and participation in a scientific discussion about asthma organised by GlaxoSmithKline. He is a co-founder and current consultant, and has shares in Synairgen, a University of Southampton spin out company. Dr. Sterk has nothing to disclose. Dr. Sterk reports grants from public–private funding by the Innovative Medicines Initiative (IMI) covered by the European Union (EU) and the European Federation of Pharmaceutical Industries and Associations (EFPIA), during the conduct of the study. Dr Chung has received honoraria for participating in Advisory Board meetings of GSK, AZ, Roche, Novartis, Merck, BI, TEVA and Shionogi regarding treatments for asthma, chronic obstructive pulmonary disease and chronic cough and has also been renumerated for speaking engagements. Dr. Dahlén reports personal fees from AZ, Cayman Chemical, GSK, Novartis, Sanofi, Regeneron, TEVA, outside the submitted work. Mr Versi, Dr Kermani, Dr Song, Mr Badi, Dr Guo, Dr Sun, Dr Bhavsar, Dr Howarth and Dr Adcock have nothing to disclose.
Figures

References
-
- Wu Z, McGoogan JM. Characteristics of and important lessons from the coronavirus disease 2019 (COVID-19) outbreak in China: summary of a report of 72314 cases from the Chinese Center for Disease Control and Prevention. JAMA. 2020;323:1239–1242. - PubMed
MeSH terms
Substances
Grants and funding
LinkOut - more resources
Full Text Sources
Other Literature Sources
Medical
Miscellaneous
