. 2021 Jan 7;20(1):7.
doi: 10.1186/s12933-020-01208-z.

Dual SGLT-1 and SGLT-2 inhibition improves left atrial dysfunction in HFpEF

Affiliations

Dual SGLT-1 and SGLT-2 inhibition improves left atrial dysfunction in HFpEF

David Bode et al. Cardiovasc Diabetol. .

Abstract

Background: Sodium-glucose linked transporter type 2 (SGLT-2) inhibition has been shown to reduce cardiovascular mortality in heart failure independently of glycemic control and prevents the onset of atrial arrhythmias, a common co-morbidity in heart failure with preserved ejection fraction (HFpEF). The mechanism behind these effects is not fully understood, and it remains unclear if they could be further enhanced by additional SGLT-1 inhibition. We investigated the effects of chronic treatment with the dual SGLT-1&2 inhibitor sotagliflozin on left atrial (LA) remodeling and cellular arrhythmogenesis (i.e. atrial cardiomyopathy) in a metabolic syndrome-related rat model of HFpEF.

Methods: 17 week-old ZSF-1 obese rats, a metabolic syndrome-related model of HFpEF, and wild type rats (Wistar Kyoto), were fed 30 mg/kg/d sotagliflozin for 6 weeks. At 23 weeks, LA were imaged in-vivo by echocardiography. In-vitro, Ca2+ transients (CaT; electrically stimulated, caffeine-induced) and spontaneous Ca2+ release were recorded by ratiometric microscopy using Ca2+-sensitive fluorescent dyes (Fura-2) during various experimental protocols. Mitochondrial structure (dye: Mitotracker), Ca2+ buffer capacity (dye: Rhod-2), mitochondrial depolarization (dye: TMRE) and production of reactive oxygen species (dye: H2DCF) were visualized by confocal microscopy. Statistical analysis was performed with 2-way analysis of variance followed by post-hoc Bonferroni and student's t-test, as applicable.

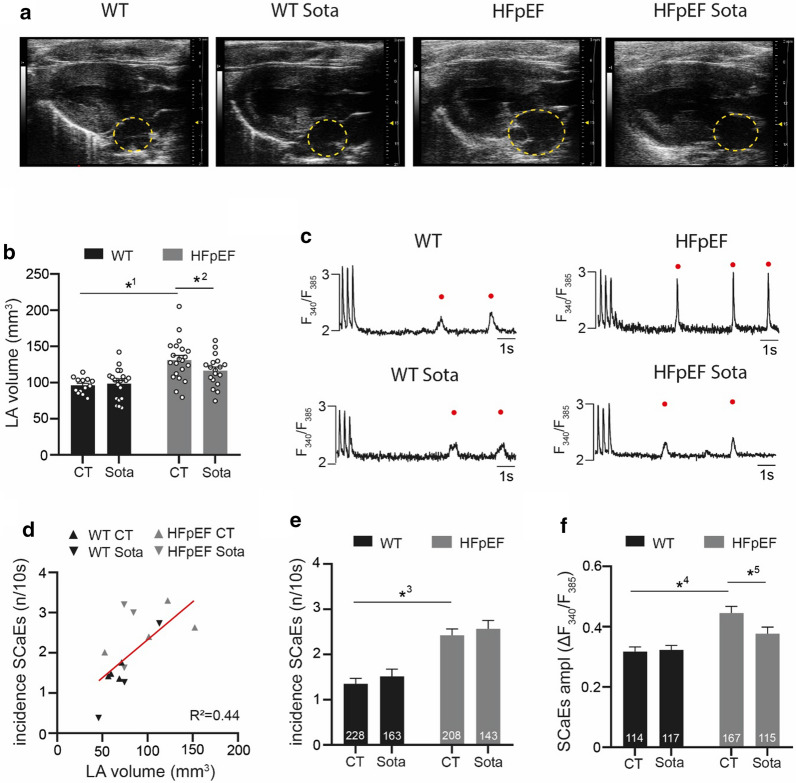
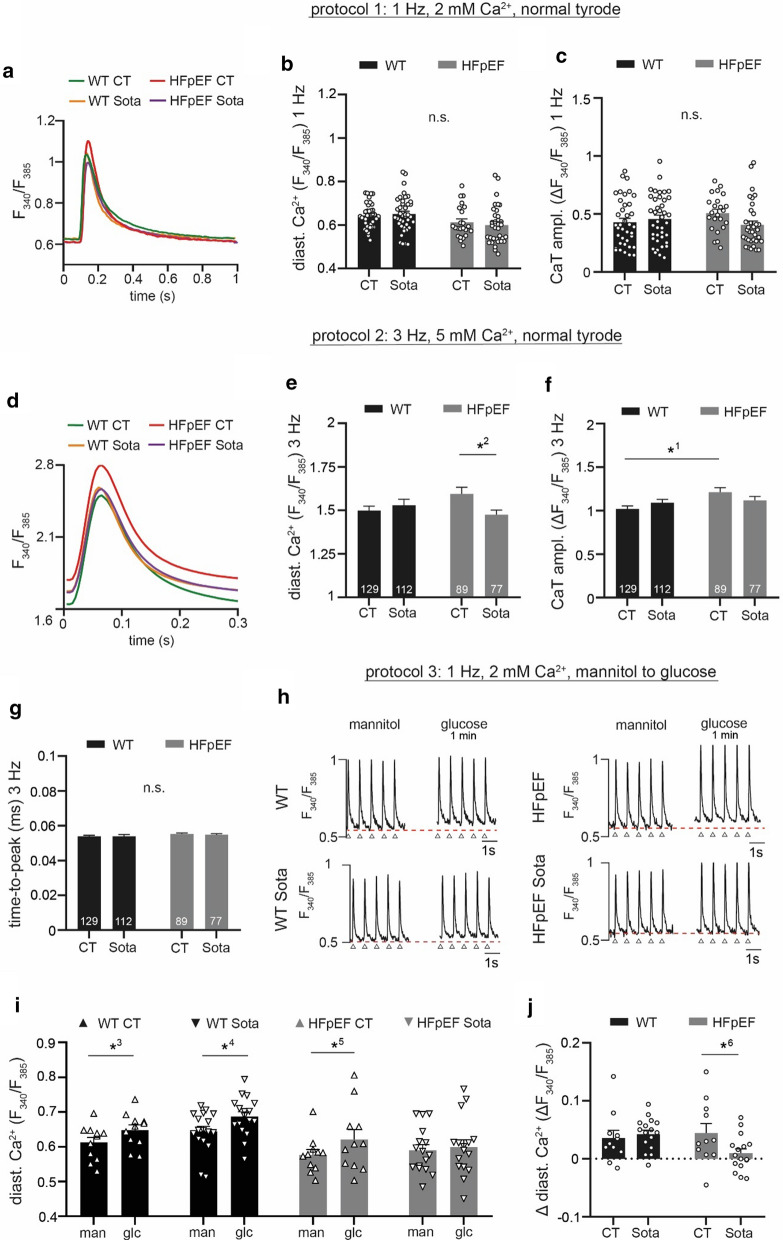
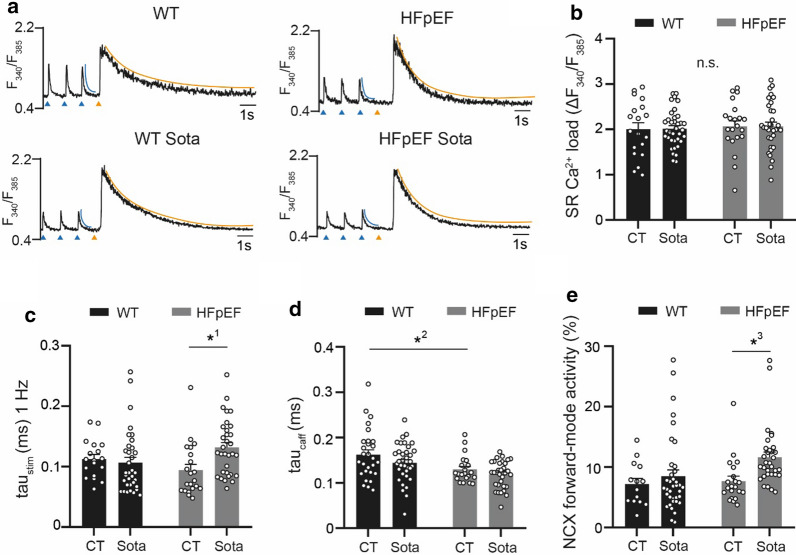
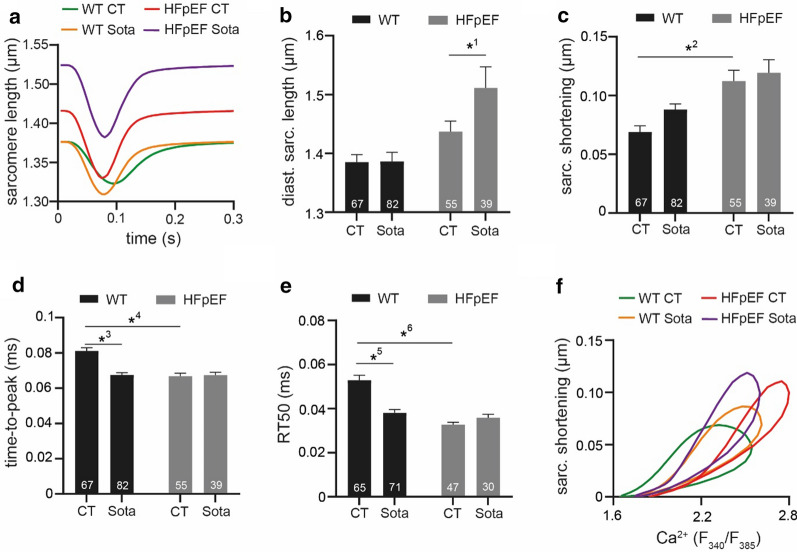
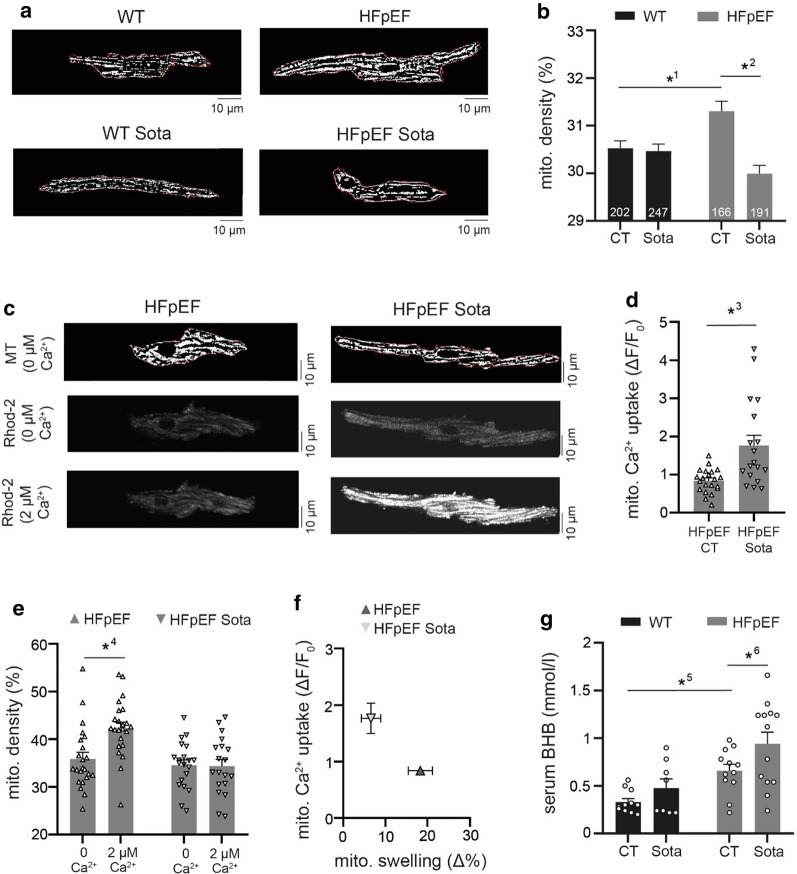
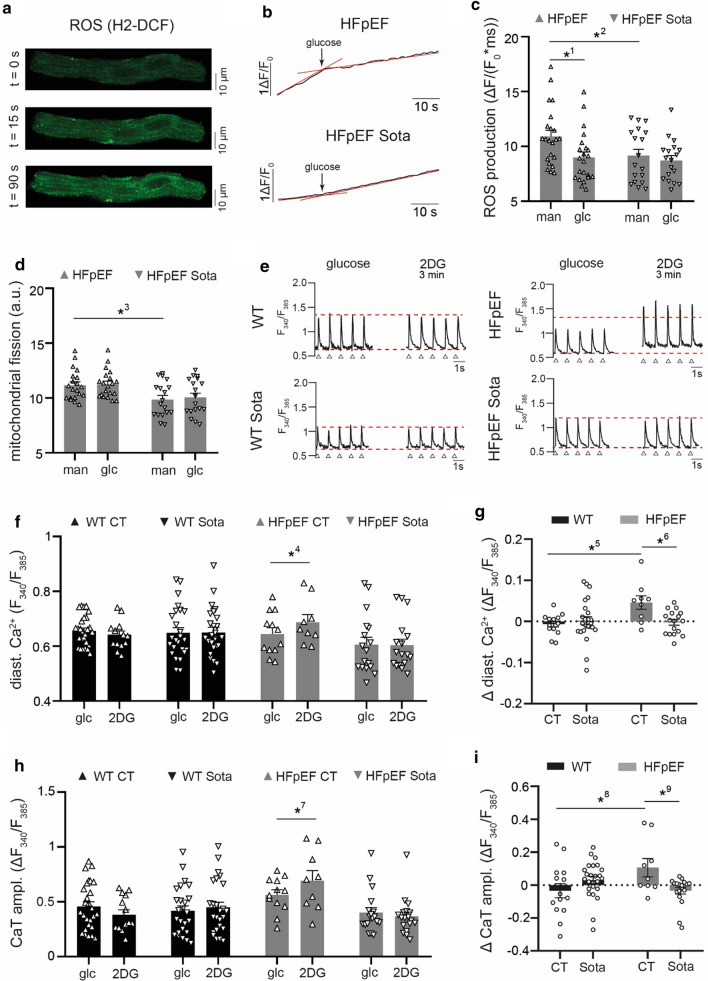
Results: Sotagliflozin ameliorated LA enlargement in HFpEF in-vivo. In-vitro, LA cardiomyocytes in HFpEF showed an increased incidence and amplitude of arrhythmic spontaneous Ca2+ release events (SCaEs). Sotagliflozin significantly reduced the magnitude of SCaEs, while their frequency was unaffected. Sotagliflozin lowered diastolic [Ca2+] of CaT at baseline and in response to glucose influx, possibly related to a ~ 50% increase of sodium sodium-calcium exchanger (NCX) forward-mode activity. Sotagliflozin prevented mitochondrial swelling and enhanced mitochondrial Ca2+ buffer capacity in HFpEF. Sotagliflozin improved mitochondrial fission and reactive oxygen species (ROS) production during glucose starvation and averted Ca2+ accumulation upon glycolytic inhibition.

Conclusion: The SGLT-1&2 inhibitor sotagliflozin ameliorated LA remodeling in metabolic HFpEF. It also improved distinct features of Ca2+-mediated cellular arrhythmogenesis in-vitro (i.e. magnitude of SCaEs, mitochondrial Ca2+ buffer capacity, diastolic Ca2+ accumulation, NCX activity). The safety and efficacy of combined SGLT-1&2 inhibition for the treatment and/or prevention of atrial cardiomyopathy associated arrhythmias should be further evaluated in clinical trials.

Keywords: Atrial cardiomyopathy; Atrial remodeling; Calcium cycling; Heart failure with preserved ejection fraction; Left atrial cardiomyocytes; Mitochondria; SGLT inhibition.


Conflict of interest statement

Lexicon Pharmaceuticals and Sanofi-Aventis provided sotagliflozin used for this study. D.P., employed by Lexicon Pharmaceuticals, as well as R.D. and H.R., employed by Sanofi-Aventis, have been involved in the development of sotagliflozin. The other authors have nothing to declare.

Figures

Fig. 1
Fig. 1
a Representative B-mode images in parasternal long axis view. Yellow, dashed circles indicate the LA. b Related data of LA volume. c Representative recordings of spontaneous Ca2+ release during a non-stimulated interval, following stimulation at 3 Hz for 10 s. d Linear regression of arrhythmic SR Ca2+ release events (SCaEs) in-vitro (average per animal) and LA volume in-vivo. e Occurrence of SCaEs and their f corresponding CaT amplitude (average per cell, respectively). Statistical analysis: Two-way ANOVA followed by post-hoc Bonferroni. p-values: 10.001, 20.045, 3< 0.001, 40.028, 5< 0.001. b n = animals, e, f n = cells derived from 6 animals per group
Fig. 2
Fig. 2
a Representative examples of CaT during 1 Hz electric stimulation and 2 mM extracellular [Ca2+]. Related data of b diastolic Ca2+ and c CaT amplitude. d Averaged CaT (all cells per group) during 3 Hz electric stimulation and 5 mM extracellular [Ca2+]. Related data of e diastolic Ca2+, f CaT amplitude and g time-to-peak. h Representative examples of CaT at 1 Hz electric stimulation after 1 h incubation in glucose-deprived buffer (left) and after reintroduction of 30 mM glucose for 1 min (right). Red, dashed lines indicate diastolic Ca2+ at baseline, arrows indicate stimulation triggers. i Related data of diastolic Ca2+ before (man) and after treatment with glucose (glc); j change of diastolic Ca2+. Statistical analysis: two-way ANOVA followed by post-hoc Bonferroni. p-values: 10.03, 20.02, 30.01, 4< 0.001, 50.001, 60.046. n = cells derived from 6 animals per group
Fig. 3
Fig. 3
a Representative examples of electrically (1 Hz; left) and caffeine-induced (20 mM; right) CaT. Tau of decay was determined during electric stimulation (left; blue curvature) and after caffeine (right; orange curvature). Blue arrows indicate electric stimulation triggers, orange arrows indicate caffeine application. Related data of b SR Ca2+ load, c tau of electrically stimulated CaT (d), tau of caffeine-induced CaT and e NCX forward-mode activity (calculated from c and d, see “Methods”). Statistical analysis: two-way ANOVA followed by post-hoc Bonferroni. p-values: 10.008, 20.01, 30.01. n = cells derived from 6 animals per group
Fig. 4
Fig. 4
a Representative examples of sarcomere shortening during 3 Hz electric stimulation and 5 mM extracellular [Ca2+]. Related data of b diastolic sarcomere length, c sarcomere shortening, d time-to-peak and e RT50 of decay. f Relationship of averaged CaT (Fig. 2a) and averaged sarcomere shortening (Fig. 3a). Statistical analysis: two-way ANOVA followed by post-hoc Bonferroni. p-values: 10.03, 2< 0.001, 3< 0.001, 4< 0.001, 5< 0.001, 6< 0.001. n = cells derived from 6 animals per group
Fig. 5
Fig. 5
a Representative examples of mitochondrial structure in LA cardiomyocytes (dye: MitoTracker after thresholding) and b related data of mitochondrial density. c Representative example of mitochondrial structure of LA cardiomyocytes after permeabilization of the sarcolemma (above), mitochondrial Ca2+ during perfusion with internal solution containing either 0 µM (center) or 2 µM Ca2+ (below). d Related data of mitochondrial Ca2+ uptake, e mitochondrial density and f correlation of mitochondrial Ca2+ uptake and mitochondrial swelling. g Serum concentration of β-hydroxybutyrate (BHB). Statistical analysis: Two-way ANOVA followed by post-hoc Bonferroni (b, e, g) or unpaired, two-tailed Student’s t-test (d). p-values: 10.004, 2< 0.001, 3< 0.001, 4< 0.001, 50.026, 60.049. af n = cells derived from 6 animals per group. g n = animals
Fig. 6
Fig. 6
a Example image sequence of ROS measurements in LA cardiomyocytes (shown: HFpEF). b Representative example and c related data of ROS production after 1 h incubation in glucose-deprived buffer (man) and after 30 s of glucose reintroduction (glc). d Mitochondrial fission of LA cardiomyocytes after 1 h incubation in glucose-deprived buffer (man) and after 60 s of glucose reintroduction (glc). e Representative examples of CaT at 1 Hz electric stimulation before (left) and 3 min after glycolytic inhibition with 2-deoxyglucose (2DG; right). Red, dashed lines indicate CaT peak (upper) and diastolic Ca2+ (lower) at baseline, arrows indicate stimulation triggers. Related data of f diastolic Ca2+ and (H) CaT amplitude before (glc) and after glycolytic inhibition (2DG); g corresponding change of diastolic Ca2+ and (I) CaT amplitude. Statistical analysis: Two-way ANOVA followed by post-hoc Bonferroni. p-values: 1< 0.001, 20.046, 30.015, 40.005, 50.007, 60.01, 70.04, 80.02, 90.016. n = cells derived from 6 animals per group

References

    1. Hohendanner F, Messroghli D, Bode D, Blaschke F, Parwani A, Boldt LH, Heinzel FR. Atrial remodelling in heart failure: recent developments and relevance for heart failure with preserved ejection fraction. ESC Heart Fail. 2018;5(2):211–221. doi: 10.1002/ehf2.12260. - DOI - PMC - PubMed
    1. Hohendanner F, Heinzel FR, Blaschke F, Pieske BM, Haverkamp W, Boldt HL, Parwani AS. Pathophysiological and therapeutic implications in patients with atrial fibrillation and heart failure. Heart Fail Rev. 2018;23(1):27–36. doi: 10.1007/s10741-017-9657-9. - DOI - PubMed
    1. Goette A, Kalman JM, Aguinaga L, Akar J, Cabrera JA, Chen SA, Chugh SS, Corradi D, D'Avila A, Dobrev D, et al. EHRA/HRS/APHRS/SOLAECE expert consensus on Atrial cardiomyopathies: Definition, characterisation, and clinical implication. J Arrhythm. 2016;32(4):247–278. doi: 10.1016/j.joa.2016.05.002. - DOI - PMC - PubMed
    1. Marrouche NF, Brachmann J, Andresen D, Siebels J, Boersma L, Jordaens L, Merkely B, Pokushalov E, Sanders P, Proff J, et al. Catheter ablation for atrial fibrillation with heart failure. N Engl J Med. 2018;378(5):417–427. doi: 10.1056/NEJMoa1707855. - DOI - PubMed
    1. Zelniker TA, Bonaca MP, Furtado RHM, Mosenzon O, Kuder JF, Murphy SA, Bhatt DL, Leiter LA, McGuire DK, Wilding JPH, et al. Effect of dapagliflozin on atrial fibrillation in patients with type 2 diabetes mellitus: insights from the DECLARE-TIMI 58 trial. Circulation. 2020;141(15):1227–1234. doi: 10.1161/CIRCULATIONAHA.119.044183. - DOI - PubMed

Publication types

MeSH terms

Substances