

Transcriptome of nasopharyngeal samples from COVID-19 patients and a comparative analysis with other SARS-CoV-2 infection models reveal disparate host responses against SARS-CoV-2
- PMID: 33413422
- PMCID: PMC7790360
- DOI: 10.1186/s12967-020-02695-0
Transcriptome of nasopharyngeal samples from COVID-19 patients and a comparative analysis with other SARS-CoV-2 infection models reveal disparate host responses against SARS-CoV-2
Abstract
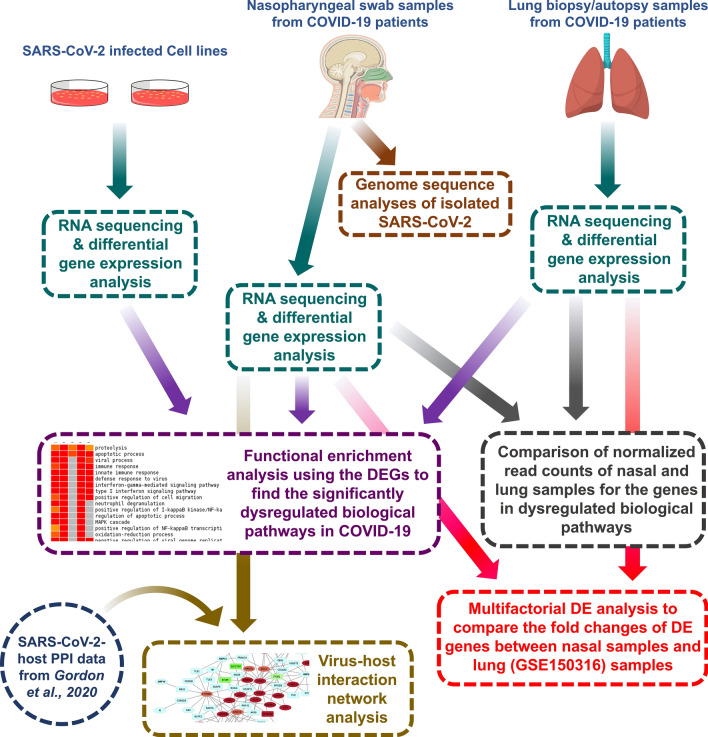
Background: Although it is becoming evident that individual's immune system has a decisive influence on SARS-CoV-2 disease progression, pathogenesis is largely unknown. In this study, we aimed to profile the host transcriptome of COVID-19 patients from nasopharyngeal samples along with virus genomic features isolated from respective host, and a comparative analyses of differential host responses in various SARS-CoV-2 infection systems.
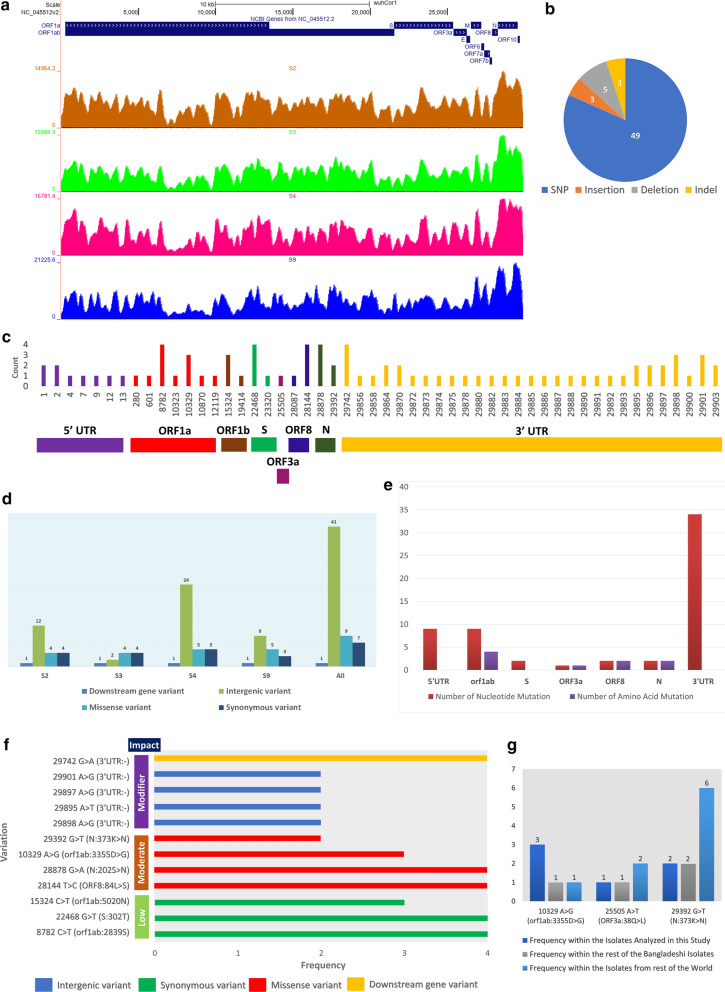
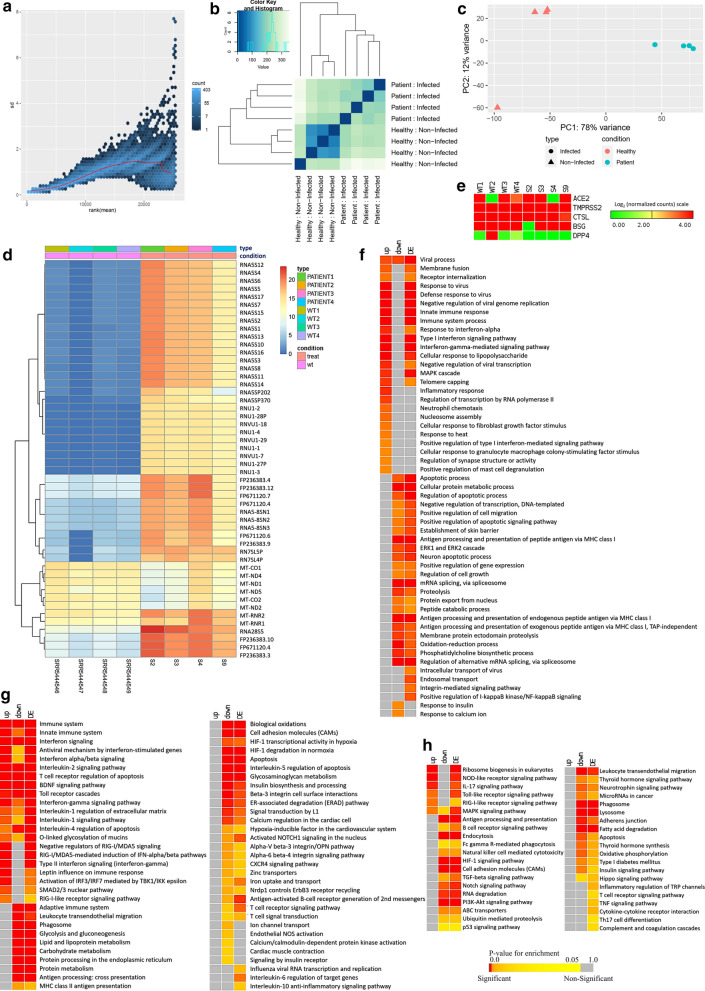
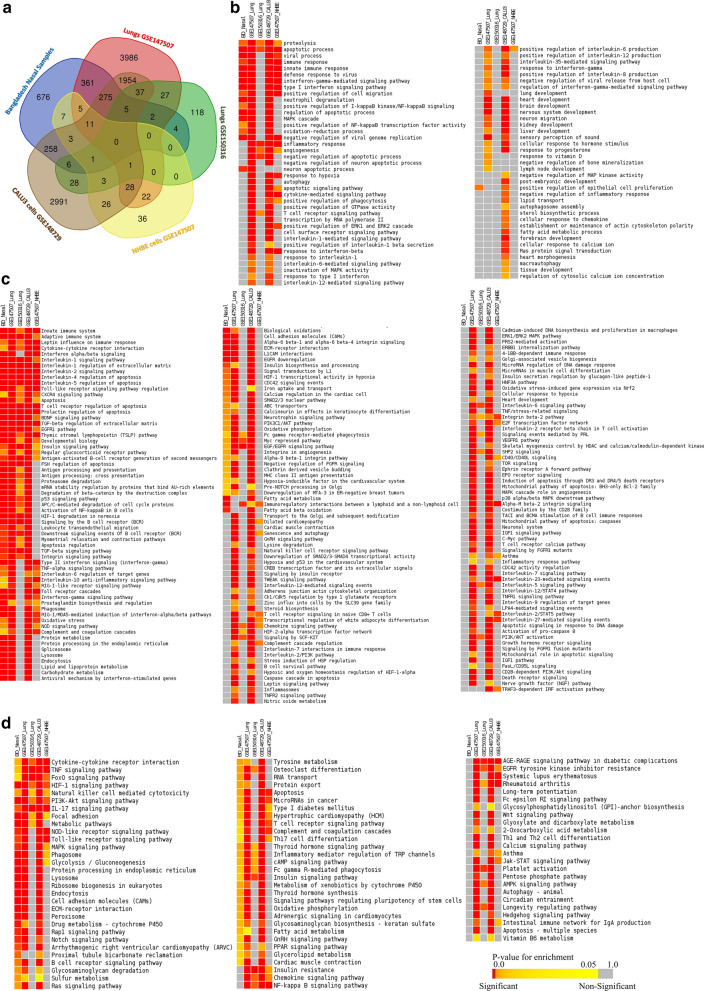
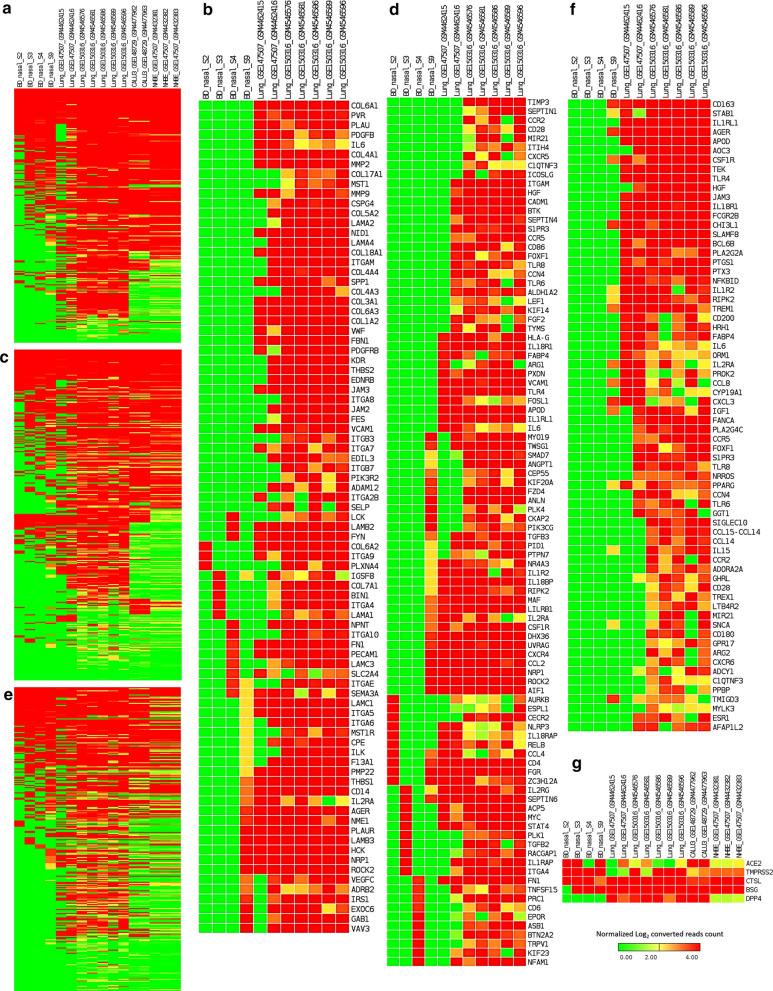
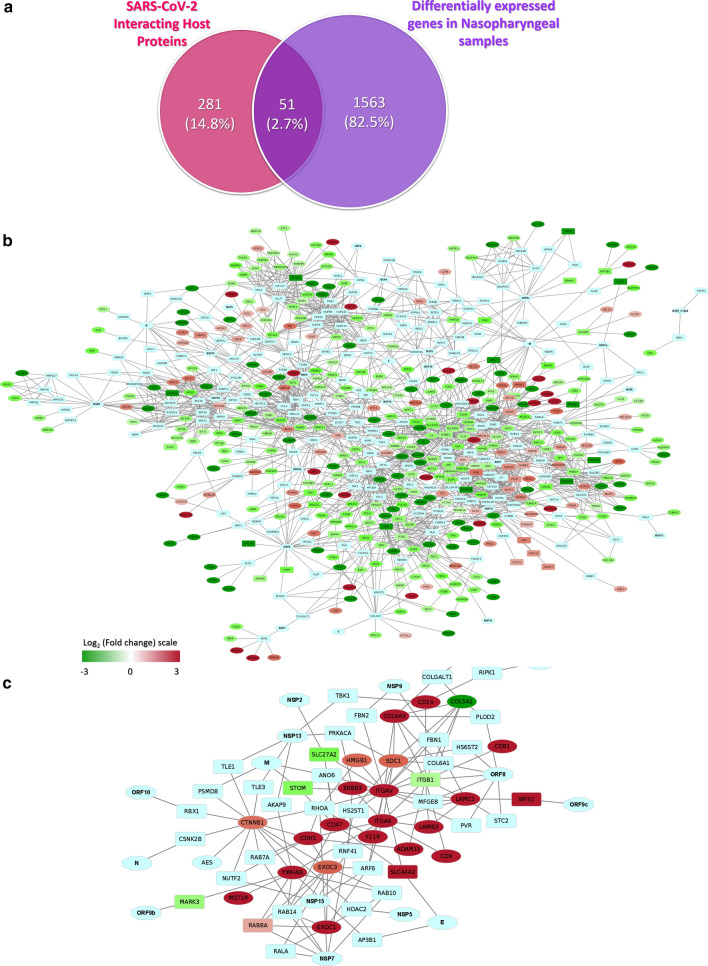
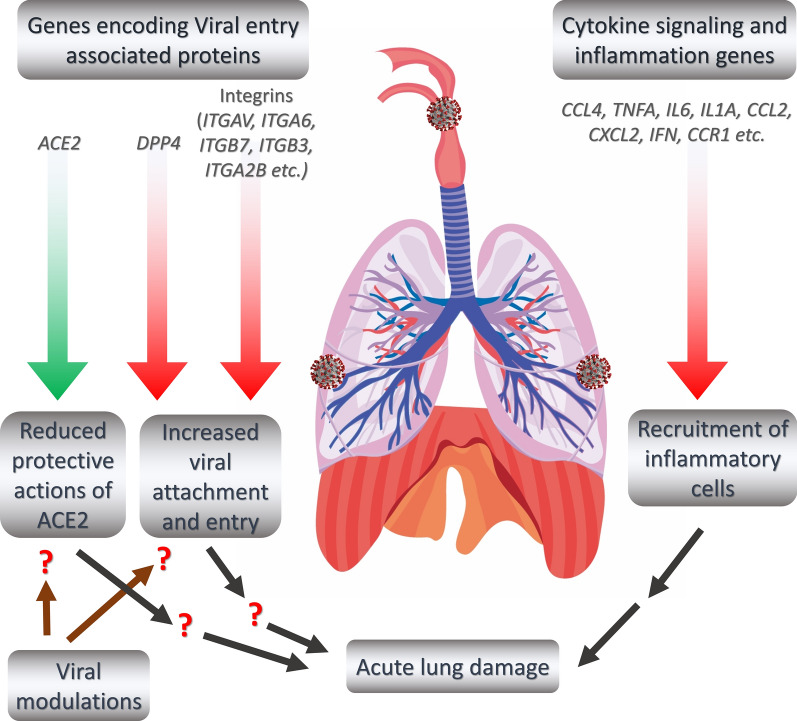
Results: Unique and rare missense mutations in 3C-like protease observed in all of our reported isolates. Functional enrichment analyses exhibited that the host induced responses are mediated by innate immunity, interferon, and cytokine stimulation. Surprisingly, induction of apoptosis, phagosome, antigen presentation, hypoxia response was lacking within these patients. Upregulation of immune and cytokine signaling genes such as CCL4, TNFA, IL6, IL1A, CCL2, CXCL2, IFN, and CCR1 were observed in lungs. Lungs lacked the overexpression of ACE2 as suspected, however, high ACE2 but low DPP4 expression was observed in nasopharyngeal cells. Interestingly, directly or indirectly, viral proteins specially non-structural protein mediated overexpression of integrins such as ITGAV, ITGA6, ITGB7, ITGB3, ITGA2B, ITGA5, ITGA6, ITGA9, ITGA4, ITGAE, and ITGA8 in lungs compared to nasopharyngeal samples suggesting the possible way of enhanced invasion. Furthermore, we found comparatively highly expressed transcription factors such as CBP, CEBP, NFAT, ATF3, GATA6, HDAC2, TCF12 which have pivotal roles in lung injury.
Conclusions: Even though this study incorporates a limited number of cases, our data will provide valuable insights in developing potential studies to elucidate the differential host responses on the viral pathogenesis in COVID-19, and incorporation of further data will enrich the search of an effective therapeutics.
Keywords: COVID-19; Genome variations; Host transcriptional response; Immune response; Integrins; SARS-CoV-2.
Conflict of interest statement
The authors declare no competing interests.
Figures

Similar articles
-
Long Noncoding RNAs as Emerging Regulators of COVID-19.Front Immunol. 2021 Aug 2;12:700184. doi: 10.3389/fimmu.2021.700184. eCollection 2021. Front Immunol. 2021. PMID: 34408749 Free PMC article. Review.
-
SARS-CoV-2 infection and the antiviral innate immune response.J Mol Cell Biol. 2020 Nov 26;12(12):963-967. doi: 10.1093/jmcb/mjaa071. J Mol Cell Biol. 2020. PMID: 33377937 Free PMC article. Review. No abstract available.
-
Comparative analysis of dynamic transcriptomes reveals specific COVID-19 features and pathogenesis of immunocompromised populations.mSystems. 2024 Jun 18;9(6):e0138523. doi: 10.1128/msystems.01385-23. Epub 2024 May 16. mSystems. 2024. PMID: 38752789 Free PMC article.
-
Shotgun transcriptome, spatial omics, and isothermal profiling of SARS-CoV-2 infection reveals unique host responses, viral diversification, and drug interactions.Nat Commun. 2021 Mar 12;12(1):1660. doi: 10.1038/s41467-021-21361-7. Nat Commun. 2021. PMID: 33712587 Free PMC article.
-
Ribosome-Profiling Reveals Restricted Post Transcriptional Expression of Antiviral Cytokines and Transcription Factors during SARS-CoV-2 Infection.Int J Mol Sci. 2021 Mar 25;22(7):3392. doi: 10.3390/ijms22073392. Int J Mol Sci. 2021. PMID: 33806254 Free PMC article.
Cited by
-
Systems biology models to identify the influence of SARS-CoV-2 infections to the progression of human autoimmune diseases.Inform Med Unlocked. 2022;32:101003. doi: 10.1016/j.imu.2022.101003. Epub 2022 Jul 6. Inform Med Unlocked. 2022. PMID: 35818398 Free PMC article.
-
Updated pharmacological effects of Lonicerae japonicae flos, with a focus on its potential efficacy on coronavirus disease-2019 (COVID-19).Curr Opin Pharmacol. 2021 Oct;60:200-207. doi: 10.1016/j.coph.2021.07.019. Epub 2021 Aug 10. Curr Opin Pharmacol. 2021. PMID: 34461565 Free PMC article. Review.
-
Systems-level profiling of early peripheral host-response landscape variations across COVID-19 severity states in an Indian cohort.Genes Immun. 2023 Aug;24(4):183-193. doi: 10.1038/s41435-023-00210-1. Epub 2023 Jul 12. Genes Immun. 2023. PMID: 37438430
-
Predicting COVID-19 disease severity from SARS-CoV-2 spike protein sequence by mixed effects machine learning.Comput Biol Med. 2022 Oct;149:105969. doi: 10.1016/j.compbiomed.2022.105969. Epub 2022 Aug 17. Comput Biol Med. 2022. PMID: 36041271 Free PMC article.
-
Exploring COVID-19 pathogenesis on command-line: A bioinformatics pipeline for handling and integrating omics data.Adv Protein Chem Struct Biol. 2022;131:311-339. doi: 10.1016/bs.apcsb.2022.04.002. Epub 2022 May 12. Adv Protein Chem Struct Biol. 2022. PMID: 35871895 Free PMC article.
References
-
- Worldometer. Coronavirus Cases. New York: Worldometer ; 2020. p. 1–22.
-
- NCBI-Gene. Gene Links for Nucleotide (Select 1798174254) - Gene - NCBI. 2020.
Publication types
MeSH terms
Substances
LinkOut - more resources
Full Text Sources
Other Literature Sources
Medical
Molecular Biology Databases
Research Materials
Miscellaneous
