

Global, regional, and national trends and patterns in physical activity research since 1950: a systematic review
- PMID: 33413479
- PMCID: PMC7792158
- DOI: 10.1186/s12966-020-01071-x
Global, regional, and national trends and patterns in physical activity research since 1950: a systematic review
Erratum in
-
Correction to: Global, regional, and national trends and patterns in physical activity research since 1950: a systematic review.Int J Behav Nutr Phys Act. 2021 Mar 8;18(1):35. doi: 10.1186/s12966-021-01100-3. Int J Behav Nutr Phys Act. 2021. PMID: 33685444 Free PMC article. No abstract available.
Abstract
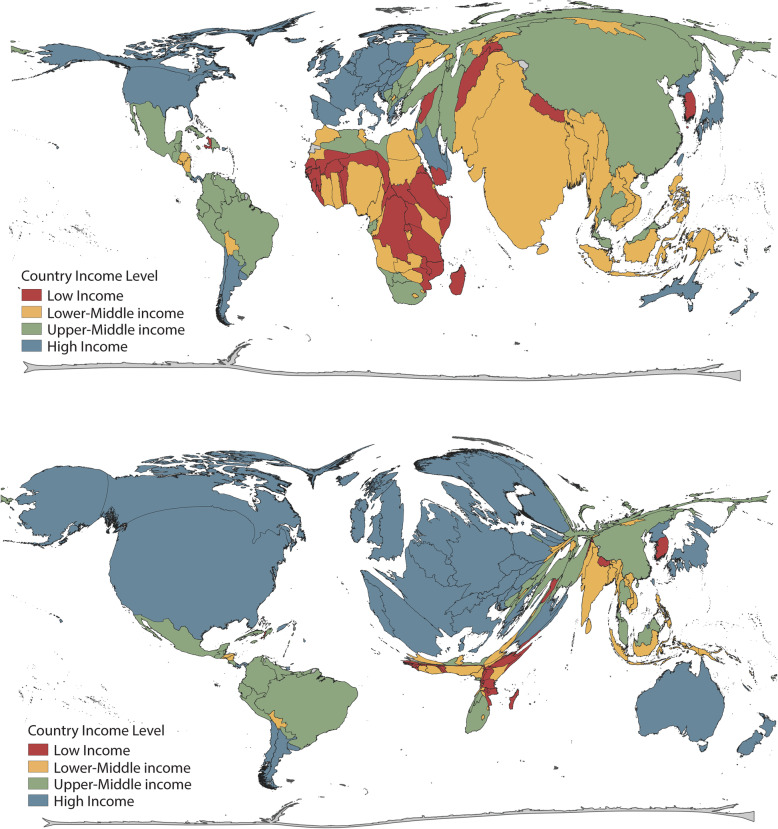
Background: National, regional and global scientific production and research capacity for physical activity - PA may contribute to improving public health PA policies and programs. There is an uneven distribution of research productivity by region and country income group, where countries with the highest burden of non-communicable diseases attributable to physical inactivity having low research productivity. A first step towards improving global research capacity is to objectively quantify patterns, trends, and gaps in PA research. This study describes national, regional and global trends and patterns of PA research from 1950 to 2019.
Methods: A systematic review using searches in PubMed, SCOPUS and ISI Web of Knowledge databases was conducted in August 2017 and updated between January and May 2020. The review was registered at the PROSPERO database number CRD42017070153. PA publications per 100,000 inhabitants per country was the main variable of interest. Descriptive and time-trend analyses were conducted in STATA version 16.0.
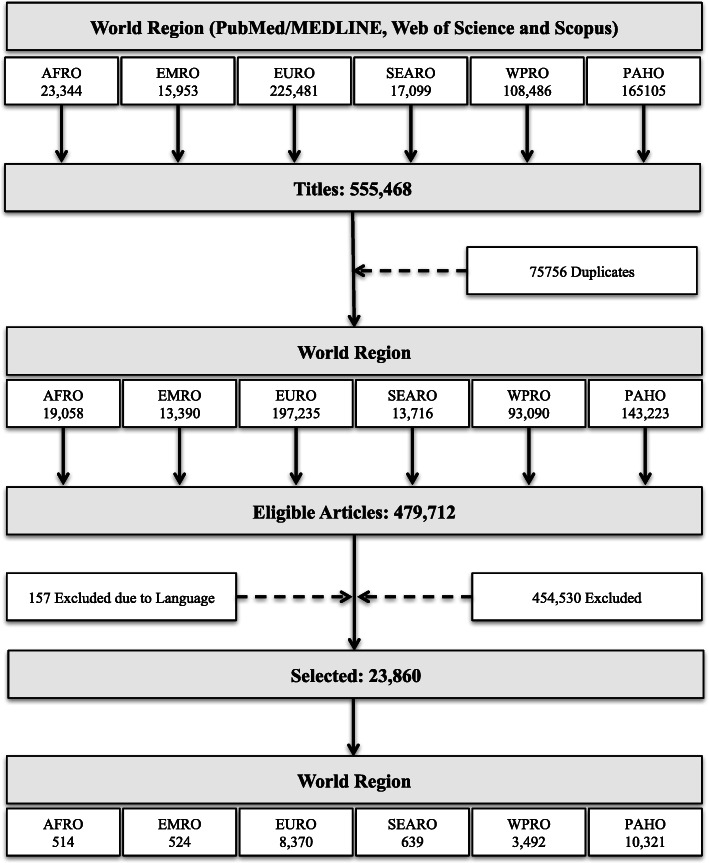
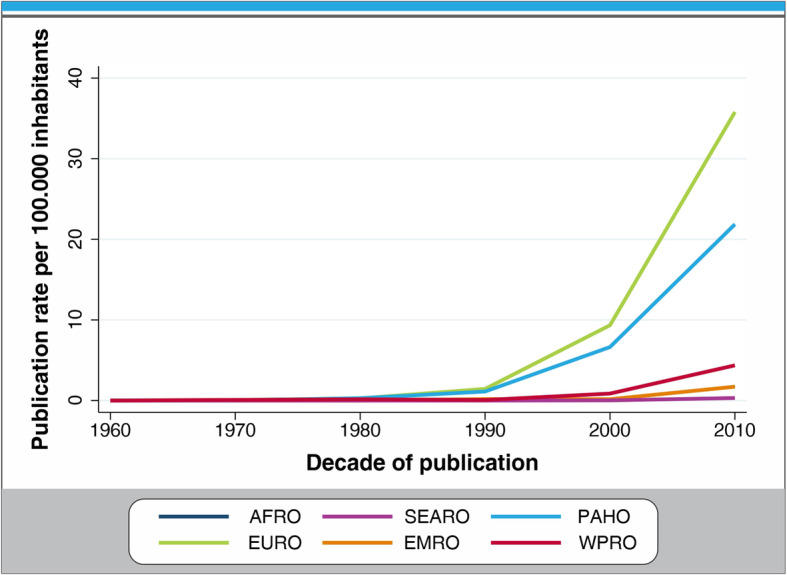
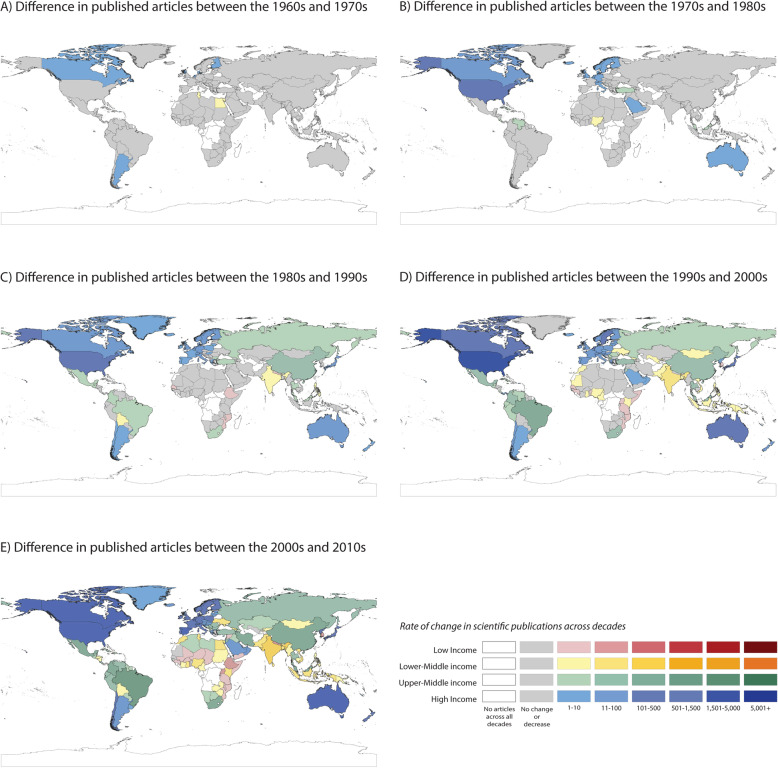
Results: The search retrieved 555,468 articles of which 75,756 were duplicates, leaving 479,712 eligible articles. After reviewing inclusion and exclusion criteria, 23,860 were eligible for data extraction. Eighty-one percent of countries (n = 176) had at least one PA publication. The overall worldwide publication rate in the PA field was 0.46 articles per 100,000 inhabitants. Europe had the highest rate (1.44 articles per 100,000 inhabitants) and South East Asia had the lowest (0.04 articles per 100,000 inhabitants). A more than a 50-fold difference in publications per 100,000 inhabitants was identified between high and low-income countries. The least productive and poorest regions have rates resembling previous decades of the most productive and the richest.
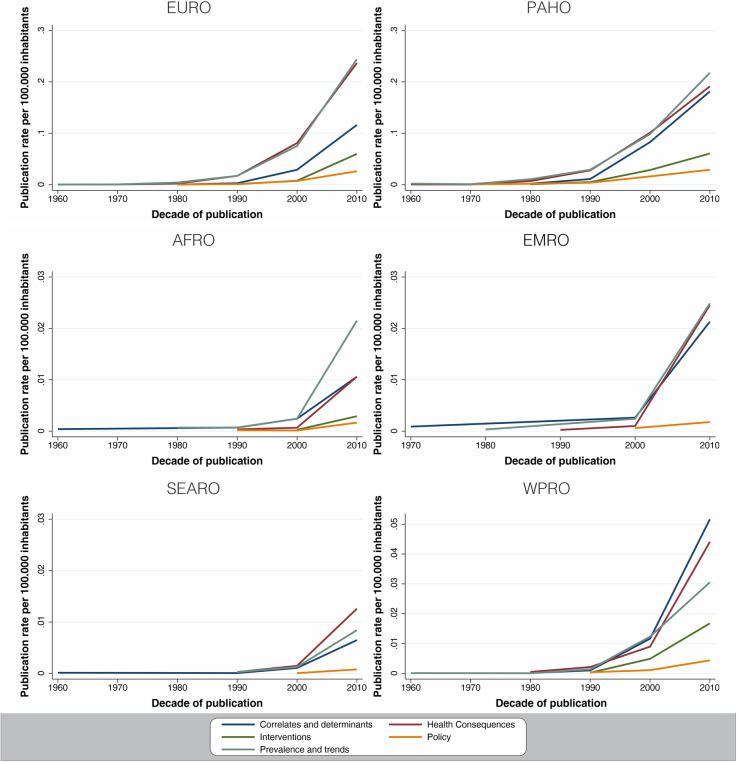
Conclusion: This study showed an increasing number of publications over the last 60 years with a growing number of disciplines and research methods over time. However, striking inequities were revealed and the knowledge gap across geographic regions and by country income groups was substantial over time. The need for regular global surveillance of PA research, particularly in countries with the largest data gaps is clear. A focus on the public health impact and global equity of research will be an important contribution to making the world more active.
Keywords: Epidemiology; Physical activity; Public health; Research; Surveillance.
Conflict of interest statement
The authors declare no conflict of interest.
Figures
References
-
- WHO. World Health Report: Reducing risks and promoting a healthy life. World Health Organization. 2002. Available from: http://www.who.int/whr/2002/en/. Accessed March 202.
-
- WHO. Global Status Report on noncommunicable diseases 2010. World Health Organization 2010. Available from: http://www.who.int/nmh/publications/ncd_report_full_en.pdf. Accessed March 2020.
-
- WHO. World Health Organization Global action plan for the prevention and control of noncommunicable diseases 2013–2020. 2013. Available from: https://www.who.int/nmh/events/ncd_action_plan/en/ Accessed March 2020.
-
- WHO. Global status report on noncommunicable diseases 2014; Available from: http://www.who.int/nmh/publications/ncd-status-report-2014/en/. Accessed March 2020.
-
- Guthold R, Stevens GA, Riley LM, Bull FC. Worldwide trends in insufficient physical activity from 2001 to 2016: a pooled analysis of 358 population-based surveys with 1· 9 million participants. Lancet Global Health. 2018;6(10). 10.1016/S2214-109X(18)30357-7. - PubMed
Publication types
MeSH terms
LinkOut - more resources
Full Text Sources
Other Literature Sources
Medical
Miscellaneous
