. 2021 Feb;31(2):186-197.
doi: 10.1101/gr.234559.118. Epub 2021 Jan 7.

KDM1A maintains genome-wide homeostasis of transcriptional enhancers

Affiliations

KDM1A maintains genome-wide homeostasis of transcriptional enhancers

Saurabh Agarwal et al. Genome Res. 2021 Feb.

Abstract

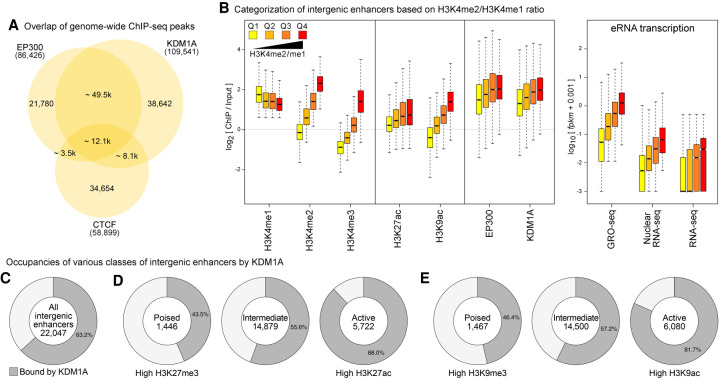
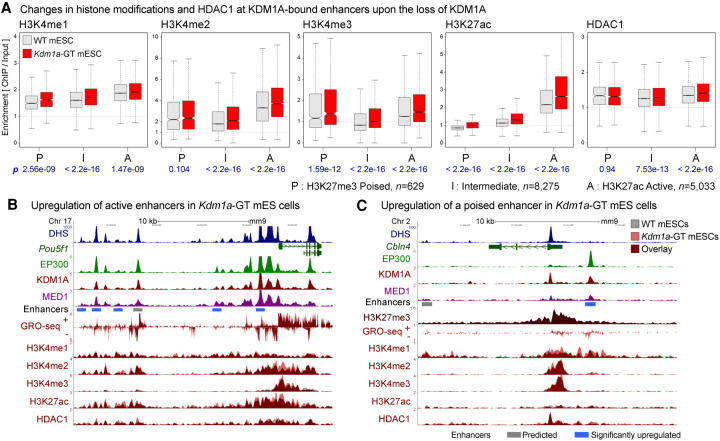
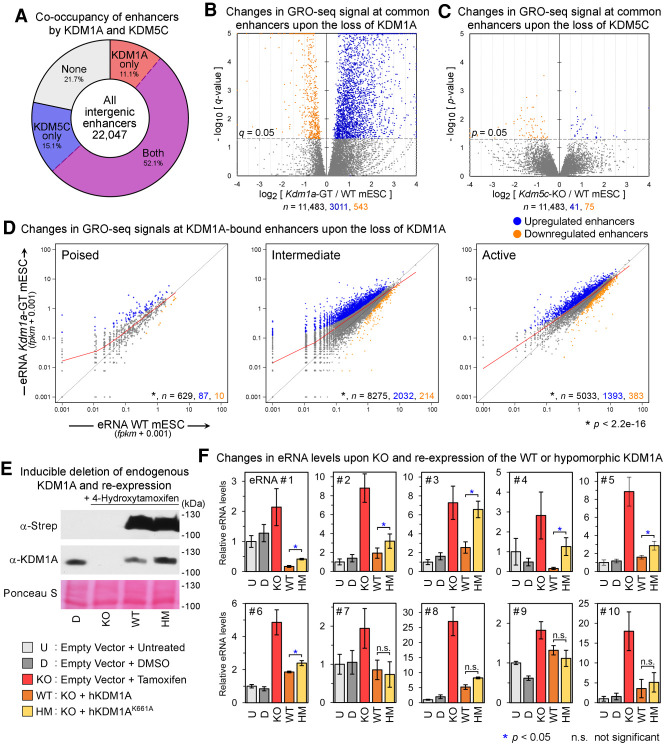
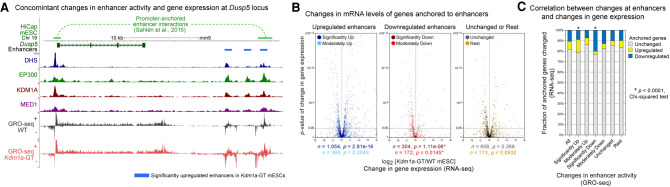
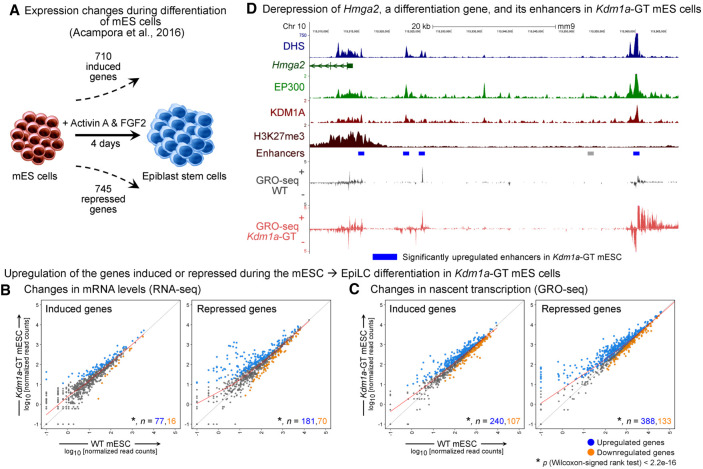
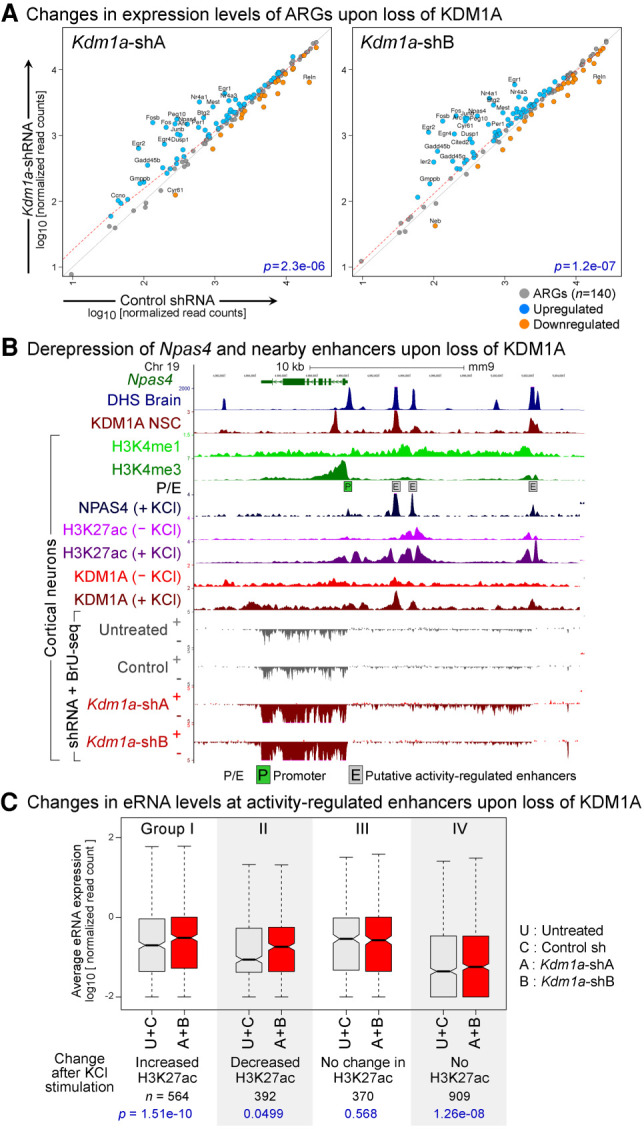
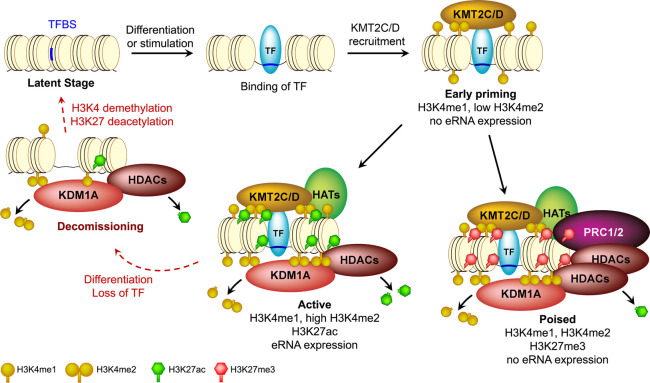
Transcriptional enhancers enable exquisite spatiotemporal control of gene expression in metazoans. Enrichment of monomethylation of histone H3 lysine 4 (H3K4me1) is a major chromatin signature of transcriptional enhancers. Lysine (K)-specific demethylase 1A (KDM1A, also known as LSD1), an H3K4me2/me1 demethylase, inactivates stem-cell enhancers during the differentiation of mouse embryonic stem cells (mESCs). However, its role in undifferentiated mESCs remains obscure. Here, we show that KDM1A actively maintains the optimal enhancer status in both undifferentiated and lineage-committed cells. KDM1A occupies a majority of enhancers in undifferentiated mESCs. KDM1A levels at enhancers exhibit clear positive correlations with its substrate H3K4me2, H3K27ac, and transcription at enhancers. In Kdm1a-deficient mESCs, a large fraction of these enhancers gains additional H3K4 methylation, which is accompanied by increases in H3K27 acetylation and increased expression of both enhancer RNAs (eRNAs) and target genes. In postmitotic neurons, loss of KDM1A leads to premature activation of neuronal activity-dependent enhancers and genes. Taken together, these results suggest that KDM1A is a versatile regulator of enhancers and acts as a rheostat to maintain optimal enhancer activity by counterbalancing H3K4 methylation at enhancers.


Figures

Figure 1.
Figure 1.
KDM1A occupies a large fraction of enhancers in mESCs. (A) Overlap of binding sites of EP300, CTCF, and KDM1A in mESCs. (B) Intergenic enhancers were divided into quartiles (Q1–Q4) based on the enrichment of H3K4me2 relative to H3K4me1 (left panel). Box plots show the enrichment of the indicated histone modifications, KDM1A, and EP300, as measured using ChIP-seq and eRNA levels (GRO-seq, nuclear RNA-seq, and RNA-seq) at each quartile of the intergenic enhancers. Levels of KDM1A show positive correlations with increases in H3K4me2 and eRNA expression from Q1 to Q4. In all figures, the bottom and top boxes signify the second and third quartiles, respectively, and the middle band represents the median of the population. Whiskers represent 1.5 times the interquartile range (IQR), and the notch represents the 95% confidence interval of the median. (C) The percentage of intergenic enhancers with KDM1A peaks. (D,E) Active, poised, and intermediate enhancers were classified based on the enrichment of either trimethylation or acetylation of H3K27 (D) or H3K9 (E). KDM1A occupancy at enhancers increases with higher enhancer activity.
Figure 2.
Figure 2.
Loss of KDM1A results in increases in H3K4 methylation and H3K27 acetylation at enhancers. (A) H3K4me1, H3K4me2, H3K4me3, H3K27ac, and HDAC1 levels on KDM1A-bound enhancers in WT (gray boxes) and Kdm1a-GT mESCs (red boxes). Enhancers were classified into poised (P), intermediate (I), and active (A) enhancers based on the enrichment of either H3K27ac or H3K27me3. Geometric mean of ChIP:Input ratios from the two independent ChIP-seq replicates are shown. P-values (p) from Wilcoxon signed-rank tests on log2(Kdm1a-GT/WT) are denoted in blue beneath each panel. n indicates the number of enhancers in each category. (B) Dysregulation of active enhancers at the Pou5f1 locus. Several enhancers are co-occupied by EP300 and KDM1A in WT mESCs, some of which show increased H3K4me2, H3K27ac, and GRO-seq signals in Kdm1a-GT mESCs (red vs. gray). (C) Misregulation of a poised enhancer at the Cbln4 locus. This locus is decorated with a broad H3K27me3 domain and shows elevations in H3K4me1, H3K4me2, and GRO-seq signals upon the loss of KDM1A. Gray bar: Predicted enhancer, blue bar: significantly up-regulated enhancer in Kdm1a-GT mESCs compared with WT mESCs based on changes in the GRO-seq signal (see Fig. 3).
Figure 3.
Figure 3.
Loss of KDM1A but not KDM5C results in aberrant activation of enhancers. (A) Fractions of intergenic enhancers bound by KDM1A and/or KDM5C in mESCs. (B,C) Volcano plots of GRO-seq signals at enhancers bound by both KDM1A and KDM5C from DESeq analyses. Whereas the loss of KDM1A resulted in a large-scale increase in GRO-seq signals at enhancers, the deletion of KDM5C had a minimal impact. The x-axis and y-axis indicate the log2 fold-change and significance, respectively, of differential expression in WT and mutant mESC lines. (D) Scatterplots of GRO-seq levels at KDM1A-bound poised, intermediate, and active enhancers. Significantly up-regulated and down-regulated enhancers (q < 0.05, DESeq) are shown in blue and orange, respectively. The LOWESS curve for each class of enhancers is shown in red. The total number (n) of all, significantly up-regulated, and significantly down-regulated enhancers in each group are indicated in black, blue, and orange, respectively. Each class of enhancers shows a significant up-regulation (P < 2.2−16, Wilcoxon signed-rank test) in Kdm1a-GT mESCs compared with WT mESCs. (E) Western blot analysis to validate the re-expression of KDM1A-WT or the hypomorphic K661A mutant after inducible Kdm1a-KO in mESCs. (F) eRNA levels measured using RT-qPCR. Mean ± SEM (n = 4 biological replicates). (*) P < 0.05; Student's t-test, (n.s.) not significant. See Supplemental Table S4 for details of the enhancers.
Figure 4.
Figure 4.
Aberrant changes in enhancer activity are associated with misregulation of physically interacting genes. (A) An example of long-range promoter-enhancer interactions (top track) obtained from the mESCs HiCap data set (Sahlén et al. 2015) at the Dusp5 locus. One of the three significantly up-regulated enhancers (blue bars) interacts with the Dusp5 promoter. Upon the loss of KDM1A, the gene and enhancers show up-regulation of H3K4me2, H3K27ac, and GRO-seq signals in Kdm1a-GT mESCs (red) compared with WT mESCs (gray). (B) Volcano plots of changes in mRNA levels (RNA-seq) of genes that physically interact with misregulated enhancers. On the basis of changes in enhancer-associated GRO-seq signals upon the loss of KDM1A, enhancers were subdivided as significantly up (q < 0.05, DESeq), significantly down, moderately up (0.05 ≤ q < 0.25), moderately down, unchanged (q ≥ 0.5 and fold-change ≤ 25%), and the rest. When multiple enhancers showed interactions with a single promoter, the assignment of the gene to an enhancer subgroup was prioritized in the aforementioned order. The total number of associated genes (n) and P-values (p) from Wilcoxon signed-rank tests on differences between mRNA levels in Kdm1a-GT and WT mESCs are shown beneath each panel. (C) χ2 test of the association of misregulated enhancers (GRO-seq) with the number of misregulated genes (RNA-seq). Significantly up- or down-regulated enhancers were more likely to be anchored to promoters of the genes that showed analogous up- or down-regulation in Kdm1a-GT mESCs. (*) P < 0.0001.
Figure 5.
Figure 5.
Both mESC-specific and differentiation genes are up-regulated after KDM1A loss in undifferentiated mESCs. (A) Schematic showing the number of significantly induced and repressed genes after differentiation of mESCs to epiblast stem cells with Activin A and FGF2 (Acampora et al. 2016). (B,C) Scatterplots of mRNA levels (B) and levels of nascent transcription (C), as measured using RNA-seq and GRO-seq, respectively, in WT and Kdm1a-GT mESCs. Number (n) of significantly up-regulated (q < 0.05) and down-regulated genes in each category are shown in blue and orange, respectively. Upon the loss of KDM1A in mESCs, both groups of induced and repressed genes show a significant increase (P < 2.2−16, Wilcoxon signed-rank test) in mRNA levels and nascent transcription. (D) Elevated transcription of Hmga2 and its nearby enhancers in Kdm1a-GT mESCs. Gray bar: Predicted enhancer, blue bar: significantly up-regulated enhancer in Kdm1a-GT mESCs.
Figure 6.
Figure 6.
KDM1A represses inducible genes and enhancers in terminally differentiated neurons. (A) Up-regulation of activity-regulated genes (ARGs) in Kdm1a-KD cortical neurons. Scatterplots of transcription levels of ARGs (n = 140) from BrU-seq analysis in CN treated with either Kdm1a shRNAs (y-axis) or control shRNA (x-axis). Significantly up-regulated (q < 0.05, DESeq) and down-regulated ARGs are shown in blue and orange, respectively, and ARGs with greater than a twofold difference with KDM1A loss are labeled with gene symbols. P-values (p) from Wilcoxon signed-rank tests are denoted in blue. (B) Aberrant induction of Npas4, an ARG, upon Kdm1a-KD in resting CN. Boxed P: Npas4 promoter, boxed E: putative activity-regulated enhancers as evident from the presence of DHS (Neph et al. 2012), high H3K4me1, low H3K4me3 (Iwase et al. 2016), activity-dependent binding of NPAS4, and an increase in H3K27ac after KCl treatment (Malik et al. 2014). Npas4 mRNA and eRNA are up-regulated in the Kdm1a-KD neurons (red). KDM1A ChIP-seq data were obtained from previous studies using neuronal stem cells (NSC) (Wang et al. 2016) and CN (Wang et al. 2015). (C) Increased eRNA levels at activity-regulated enhancers in Kdm1a-KD CN. These enhancers were divided into four groups based on the activity-induced changes in H3K27ac (Malik et al. 2014). Three groups of enhancers show a significant increase in eRNA levels upon Kdm1a-KD (red boxes) compared with control conditions (untreated CN or control shRNA-treated CN, gray boxes). (A + B) Geometric mean of eRNA levels in CN treated with Kdm1a shRNAs A or B, (U + C) geometric mean of eRNA levels in control neurons. P-values (p) from Wilcoxon signed-rank tests are denoted in blue.
Figure 7.
Figure 7.
A model of KDM1A-mediated homeostasis of enhancers during their life cycle. TF binding and subsequent recruitment of methyltransferases, KMT2C/D, prime an enhancer with H3K4me1 and/or H3K4me2. KDM1A is then recruited to this enhancer by yet unknown H3K4me-sensing mechanisms and cooperates with histone deacetylases (HDACs) to suppress its aberrant activation. A primed enhancer, depending on further regulatory signals, can become either “active” or “poised.” The presence of KDM1A/HDACs is required to antagonize the activities of the methyltransferases and acetyltransferases (HATs) and maintain an optimal histone modification landscape. The equilibrium of these counteractions likely defines the activity of an enhancer. When an enhancer is decommissioned upon the loss of TF binding, KDM1A may remove the remnant H3K4me1/2 before dissociating and rendering it latent.

References

    1. Acampora D, Omodei D, Petrosino G, Garofalo A, Savarese M, Nigro V, Di Giovannantonio LG, Mercadante V, Simeone A. 2016. Loss of the Otx2-binding site in the Nanog promoter affects the integrity of embryonic stem cell subtypes and specification of inner cell mass-derived epiblast. Cell Rep 15: 2651–2664. 10.1016/j.celrep.2016.05.041 - DOI - PubMed
    1. Adamo A, Sesé B, Boue S, Castaño J, Paramonov I, Barrero MJ, Izpisua Belmonte JC. 2011. LSD1 regulates the balance between self-renewal and differentiation in human embryonic stem cells. Nat Cell Biol 13: 652–659. 10.1038/ncb2246 - DOI - PubMed
    1. Agarwal S, Macfarlan TS, Sartor MA, Iwase S. 2015. Sequencing of first-strand cDNA library reveals full-length transcriptomes. Nat Commun 6: 6002 10.1038/ncomms7002 - DOI - PMC - PubMed
    1. AlAbdi L, Saha D, He M, Dar MS, Utturkar SM, Sudyanti PA, McCune S, Spears BH, Breedlove JA, Lanman NA, et al. 2020. Oct4-mediated inhibition of Lsd1 activity promotes the active and primed state of pluripotency enhancers. Cell Rep 30: 1478–1490.e6. 10.1016/j.celrep.2019.11.040 - DOI - PMC - PubMed
    1. Anders S, Huber W. 2010. Differential expression analysis for sequence count data. Genome Biol 11: R106 10.1186/gb-2010-11-10-r106 - DOI - PMC - PubMed