. 2021 Mar 10;95(7):e02260-20.
doi: 10.1128/JVI.02260-20. Epub 2021 Jan 7.

COVID-19 vaccine candidates based on modified vaccinia virus Ankara expressing the SARS-CoV-2 spike induce robust T- and B-cell immune responses and full efficacy in mice

Affiliations

COVID-19 vaccine candidates based on modified vaccinia virus Ankara expressing the SARS-CoV-2 spike induce robust T- and B-cell immune responses and full efficacy in mice

Juan García-Arriaza et al. J Virol. .

Abstract

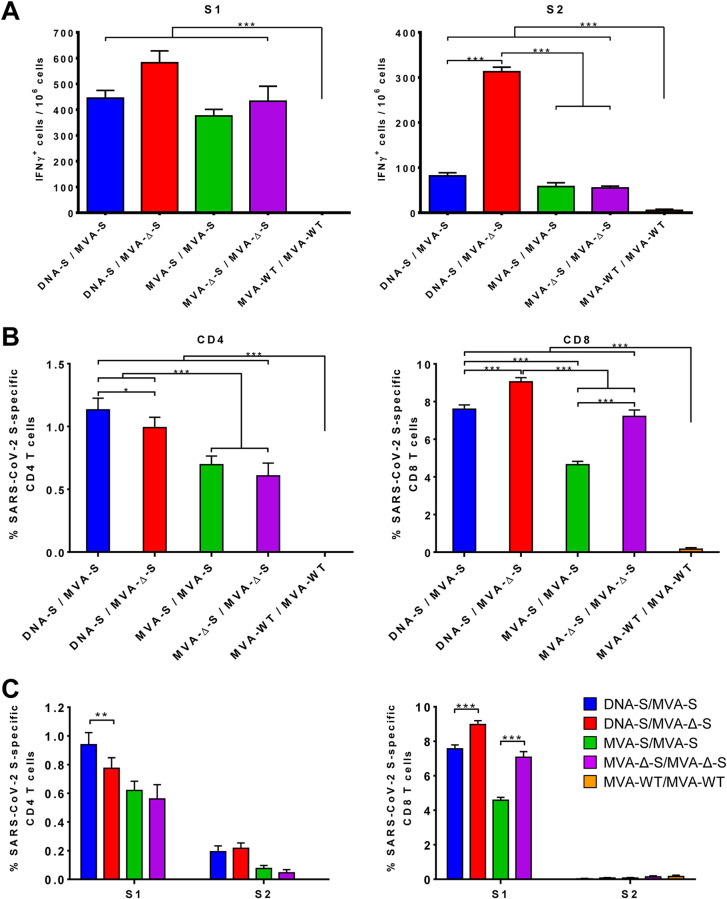
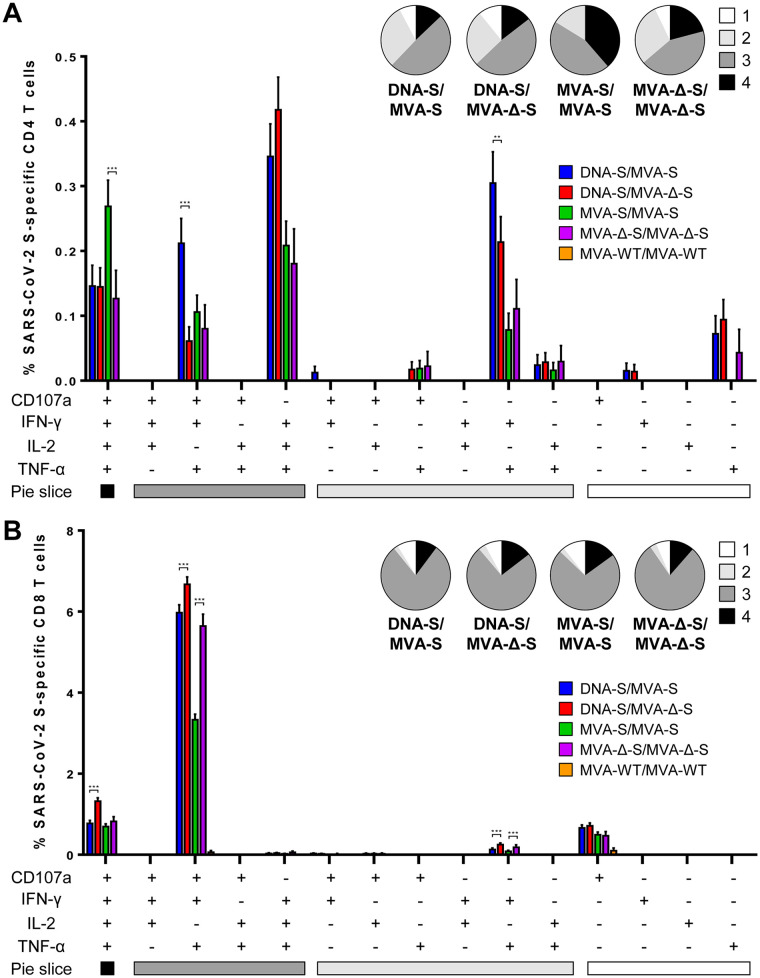
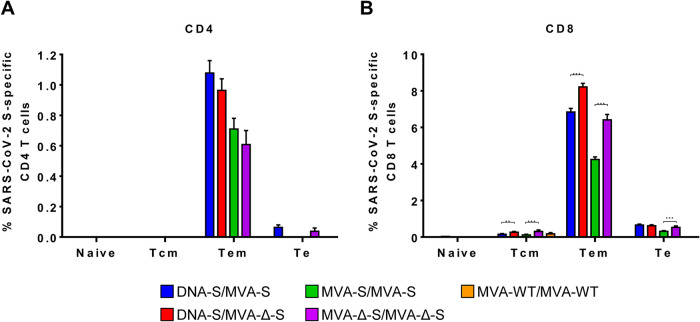
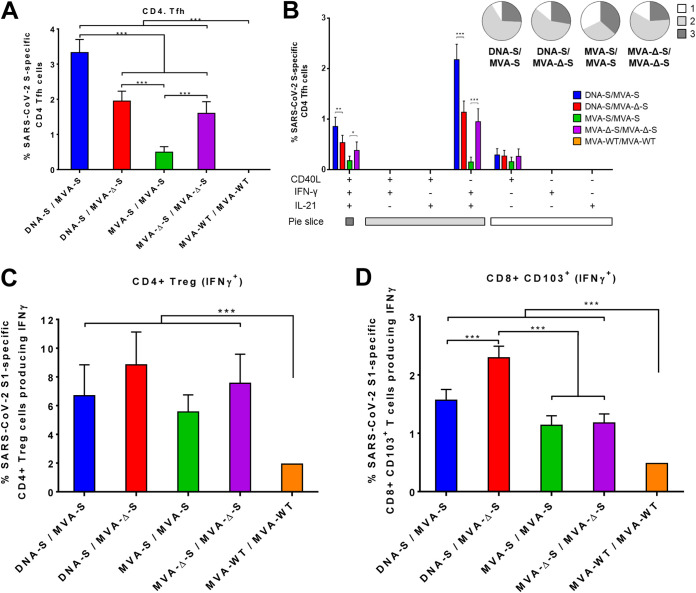
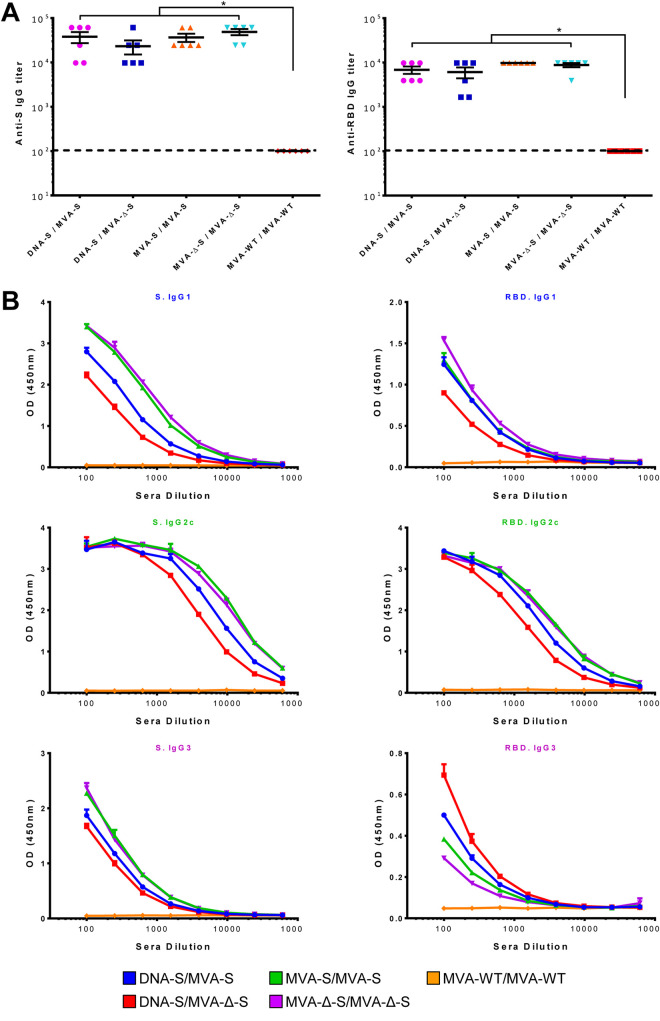
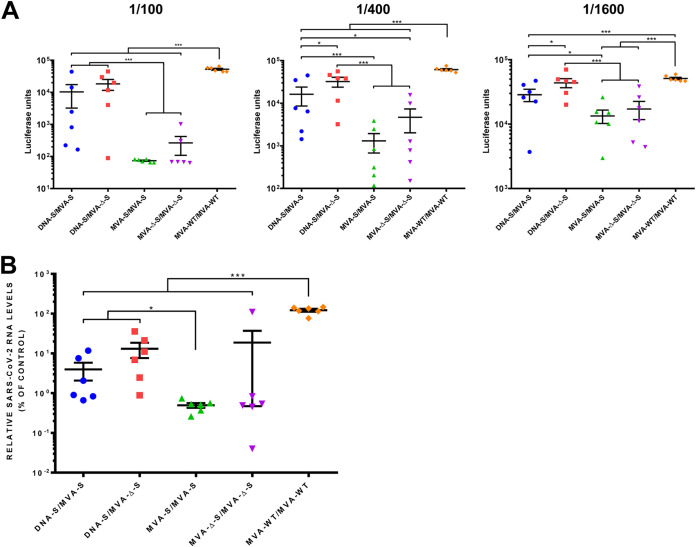
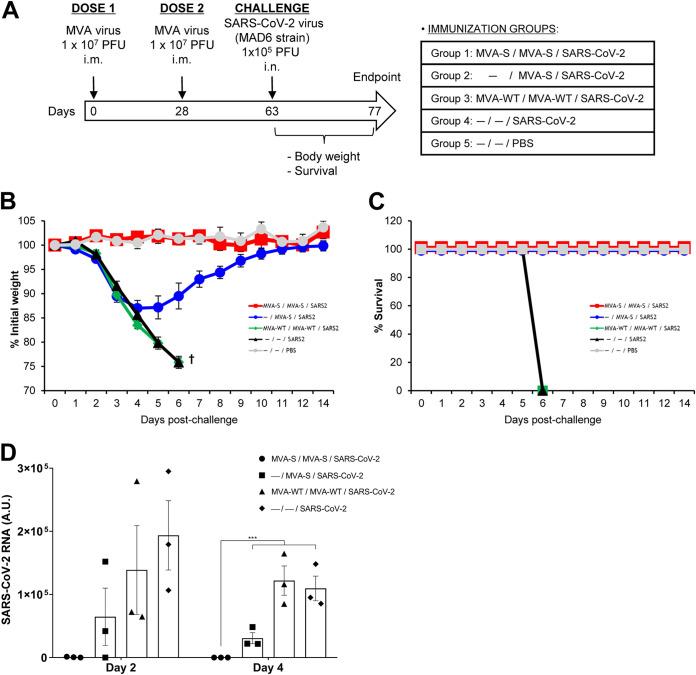
Vaccines against SARS-CoV-2, the causative agent of the COVID-19 pandemic, are urgently needed. We developed two COVID-19 vaccines based on modified vaccinia virus Ankara (MVA) vectors expressing the entire SARS-CoV-2 spike (S) protein (MVA-CoV2-S); their immunogenicity was evaluated in mice using DNA/MVA or MVA/MVA prime/boost immunizations. Both vaccines induced robust, broad and polyfunctional S-specific CD4+ (mainly Th1) and CD8+ T-cell responses, with a T effector memory phenotype. DNA/MVA immunizations elicited higher T-cell responses. All vaccine regimens triggered high titers of IgG antibodies specific for the S, as well as for the receptor-binding domain; the predominance of the IgG2c isotype was indicative of Th1 immunity. Notably, serum samples from vaccinated mice neutralized SARS-CoV-2 in cell cultures, and those from MVA/MVA immunizations showed a higher neutralizing capacity. Remarkably, one or two doses of MVA-CoV2-S protect humanized K18-hACE2 mice from a lethal dose of SARS-CoV-2. In addition, two doses of MVA-CoV2-S confer full inhibition of virus replication in the lungs. These results demonstrate the robust immunogenicity and full efficacy of MVA-based COVID-19 vaccines in animal models and support its translation to the clinic.IMPORTANCE The continuous dissemination of the novel emerging SARS-CoV-2 virus, with more than 78 million infected cases worldwide and higher than 1,700,000 deaths as of December 23, 2020, highlights the urgent need for the development of novel vaccines against COVID-19. With this aim, we have developed novel vaccine candidates based on the poxvirus modified vaccinia virus Ankara (MVA) strain expressing the full-length SARS-CoV-2 spike (S) protein, and we have evaluated their immunogenicity in mice using DNA/MVA or MVA/MVA prime/boost immunization protocols. The results showed the induction of a potent S-specific T-cell response and high titers of neutralizing antibodies. Remarkably, humanized K18-hACE2 mice immunized with one or two doses of the MVA-based vaccine were 100% protected from SARS-CoV-2 lethality. Moreover, two doses of the vaccine prevented virus replication in lungs. Our findings prove the robust immunogenicity and efficacy of MVA-based COVID-19 vaccines in animal models and support its translation to the clinic.


Figures

FIG 1
FIG 1
Design, generation, and in vitro characterization of MVA-S and MVA-Δ-S vaccine candidates. (A) Scheme of the MVA-S and MVA-Δ-S genomes with the SARS-CoV-2 S gene inserted within the MVA TK viral locus (J2R). The MVA genome regions are indicated by capital letters. Deleted or fragmented MVA genes are represented as black boxes. The locations of C6L, K7R, and A46R genes deleted in the MVA-Δ-S construct are indicated. (B) Expression of SARS-CoV-2 S protein by MVA-S vaccine candidates. Western blotting of the MVA-infected DF-1 cell samples (5 PFU/cell), treated or untreated with tunicamycin, at 4 and 24 h postinfection (hpi). Mouse monoclonal or rabbit polyclonal anti-S antibodies were used to identify the protein as described in Materials and Methods. A rabbit polyclonal antibody against the VACV E3 protein was used to control the amount of viral proteins loaded on the 7% SDS-PAGE under reducing conditions. The size (in kilodaltons [kDa]) and migration of the molecular weight markers are indicated. (C) Expression kinetics of S protein in cellular pellets and supernatants from cells infected with MVA-S and MVA-Δ-S vaccine candidates. Western blotting of MVA-infected cell samples and corresponding cell supernatants (SN) at 4 and 24 hpi, as in panel B. A rabbit polyclonal anti-S antibody was used for protein identification. (D) Expression of S protein under reducing and nonreducing conditions. Western blotting of MVA-infected DF-1 cell samples (24 hpi) under reducing (+ β-mercaptoethanol [BME]) and nonreducing (- BME) conditions. A rabbit polyclonal anti-S antibody was used for protein identification. The presumed state of the S protein based on its migration is indicated. (E and F) Genetic stability of MVA-S and MVA-Δ-S vaccine candidates. Western blotting of DF-1 cell samples (24 hpi) infected with initial P2 stocks and with 9 successive passages of MVA-S and MVA-Δ-S viruses (E) or from 20 individual virus plaques picked after 9 consecutive cell infection cycles of the MVA-S construct (F). Samples were analyzed under reducing conditions. Rabbit polyclonal anti-S and anti-VACV E3 antibodies were used for protein identification.
FIG 2
FIG 2
Subcellular distribution of the SARS-CoV-2 S protein in MVA-S- and MVA-Δ-S-infected cells. Confocal immunofluorescence microscopy of infected and permeabilized (A) or nonpermeabilized (B) HeLa cells. Cells were infected with 0.5 PFU/cell with the indicated viruses, fixed at 24 hpi, permeabilized or nonpermeabilized, and stained with Alexa Fluor 594-conjugated WGA probe (red) and with a rabbit polyclonal anti-S antibody further detected with a rabbit Alexa Fluor 488-conjugated antibody (green). Cell nuclei were stained using DAPI (blue). A diagram with the S and WGA signal profiles through a cell slice is shown on the right and shows colocalization (yellow) on the cell surface. Bars, 8 μm.
FIG 3
FIG 3
MVA-S and MVA-Δ-S elicit SARS-CoV-2 S-specific T-cell immune responses in immunized mice. (A) Magnitude of SARS-CoV-2-specific cell responses directed against S1 and S2 regions. Cells secreting IFN-γ per million of splenocytes and directed against S1 (left panel) or S2 (right panel) peptide pools in mice immunized with the indicate prime/boost protocols. IFN-γ was evaluated by an ELISpot assay from a pool of splenocytes derived from six immunized mice per group at 11 days postboost as described in Materials and Methods. Samples were analyzed in triplicate; bars show the triplicate mean values and the standard deviation. P values from one-way ANOVA followed by post hoc pairwise comparisons by Student’s t tests with Holm correction for multiple comparisons (***, P < 0.001). (B) Magnitude of total SARS-CoV-2 S-specific T-cell immune responses. Percentages of CD4+ or CD8+ T cells expressing CD107a and/or producing IFN-γ and/or TNF-α and/or IL-2 against a mixture of S1 and S2 peptide pools in mice immunized with the indicative regimen. Cell percentages were determined by ICS from splenocyte pools as described in Materials and Methods. (C) SARS-CoV-2 S-specific T-cell immune responses against S1 and S2 regions. The percentages of S1- or S2-specific CD4+ and CD8+ T cells were determined as described above for panel B. P values were determined as described in Materials and Methods using an approach that corrects measurements for the medium response, calculating confidence intervals (*, P < 0.05; **, P < 0.005; ***, P < 0.001).
FIG 4
FIG 4
MVA-S and MVA-Δ-S induce polyfunctional SARS-CoV-2 S-specific T-cell immune responses in immunized mice. Polyfunctional profiles (based on expression of selected markers CD107a, IFN-γ, TNF-α, and IL-2) of total SARS-CoV-2-specific CD4+ (A) or CD8+ (B) T-cell immune responses directed against a mixture of S1 and S2 peptide pools. T-cell responses were analyzed by ICS in splenocyte pools from six mice per group at 11 days postboost as described in Materials and Methods. The response profiles are shown on the x axis, and the percentages of T cells for each of the immunization regimens are shown on the y axis. The pie charts summarize the percentage of S-specific T cells exhibiting one, two, three, or four markers, which are shown color coded. P values were determined as described in Materials and Methods using an approach that corrects measurements for the medium response, calculating confidence intervals (**, P < 0.005; ***, P < 0.001).
FIG 5
FIG 5
Memory phenotypic profiles of the SARS-CoV-2 S-specific CD4+ and CD8+ T cells elicited in mice immunized with the MVA-S and MVA-Δ-S vaccine candidates. Percentages of naive (CD127/CD62L), T central memory (Tcm) (CD127+/CD62L+), T effector memory (Tem) (CD127+/CD62L), and T effector (Te) (CD127/CD62L) CD4+ (A) or CD8+ (B) T cells specific for S1 and S2 peptide pools, and expressing any of the markers, CD107a, IFN-γ, TNF-α, and IL-2. T-cell responses were analyzed by ICS in splenocyte pools from six mice per group at 11 days postboost as described in Materials and Methods. P values were determined as described in Materials and Methods using an approach that corrects measurements for the medium response, calculating confidence intervals (**, P < 0.005; ***, P < 0.001).
FIG 6
FIG 6
Characterization of the SARS-CoV-2 S-specific CD4+ Tfh, CD4+ Treg, and CD8+, CD103+ T resident-like memory cell immune responses elicited by MVA-S and MVA-Δ-S vaccine candidates in immunized mice. (A) Magnitude of the S-specific CD4+ Tfh cell immune responses directed against a mixture of S protein plus S1 and S2 peptide pools. Percentages of CD4+ Tfh cells (CXCR5+, PD1+) expressing CD40L and/or producing IFN-γ and/or IL-21 are shown. (B) Polyfunctionality of the S-specific CD4+ Tfh cells. The response profiles based on the T cell expression of the CD40L, IFN-γ, and/or IL-21 markers are shown as in Fig. 4. The pie charts summarize the percentage of S-specific T cells expressing one, two, or three markers, which are shown color coded. Percentages of IFN-γ-producing CD4+ Treg (CD4+, FOXP3+) cells or CD8+ CD103+ T resident-like memory specific for S1 peptide pool are shown in panels C and D, respectively. T-cell responses were analyzed by ICS in splenocyte pools from six mice per group at 11 days postboost as described in Materials and Methods. P values were determined as described in Materials and Methods using an approach that corrects measurements for the medium response, calculating confidence intervals (*, P < 0.05; **, P < 0.005; ***, P < 0.001).
FIG 7
FIG 7
MVA-S and MVA-Δ-S elicit SARS-CoV-2 S-specific humoral immune responses in immunized mice. (A) Titers of IgG antibodies specific for the S (left) and RBD (right) proteins. Titers were determined by ELISA in individual mouse serum samples collected 11 days postboost and were calculated as the serum dilution (y axis) at which the absorbance was three times higher than the naive serum value in each of the indicated immunization regimens, shown in the x axis. The dashed line represents the detection limit. P values from Kruskal-Wallis test followed by post hoc pairwise comparisons by Wilcoxon rank sum tests with Holm correction for multiple comparisons: (*, P < 0.05). (B) Levels of IgG1, IgG2c, and IgG3 isotypes specific for the S (left) and RBD (right) proteins. Mean optical density (OD at 450 nm) and standard deviations determined by ELISA with duplicate serum dilutions from pooled serum samples (n = 6) from immunized mice at 11 days postboost are represented.
FIG 8
FIG 8
MVA-S and MVA-Δ-S induce SARS-CoV-2 neutralizing antibodies in immunized mice. (A) Neutralization of retrovirus-based pseudoparticles expressing the SARS-CoV-2 S protein. Inhibition of S-pseudotype retrovirus entry in Vero-E6 cells was measured by a luciferase assay with serum samples collected 11 days postboost. Each dot represents the mean luciferase units determined from triplicates of individual mouse serum samples (diluted 1/100 [left panel], 1/400 [middle panel], and 1/1,600 [right panel]). Mean values and standard errors of the means (SEM) for each immunization group are represented. (B) Neutralization of SARS-CoV-2 cell infection. Virus RNA was quantified 6 h after infection of Vero-E6 cells with SARS-CoV-2 strain NL/2020 (MOI of 1 PFU/cell) mixed with a 1/50 dilution of mouse serum samples. Mean RNA levels and SEM from triplicates of individual serum samples are represented for each immunization group. The average RNA level from infections performed in the presence of mouse serum samples from the control group MVA-WT/MVA-WT was set at 100%. P values from Kruskal-Wallis test followed by post hoc pairwise comparisons by Wilcoxon rank sum tests with Holm correction for multiple comparisons: (*, P < 0.05; ***, P < 0.001).
FIG 9
FIG 9
MVA-S protects humanized K18-hACE2 mice from SARS-CoV-2 infection. (A) Efficacy schedule. K18-hACE2 mice (n = 5 per group) were immunized with one or two doses of 1 × 107 PFU of MVA-S or MVA-WT by the i.m. route at weeks 0 and 4. At week 9, mice were i.n. challenged with 1 × 105 PFU of SARS-CoV-2 (MAD6 isolate). Unvaccinated mice (n = 5) were also i.n. challenged with 1 × 105 PFU of SARS-CoV-2, and unvaccinated and unchallenged mice (n = 5) were used as a control. The challenged mice were monitored for change of body weights (B) and mortality (C) for 14 days. (D) SARS-CoV-2 RNA detected by RT-qPCR targeting viral E gene with normalization to 18S in lungs obtained at 2 (n = 3) and 4 (n = 3) days postchallenge from mice vaccinated and infected as in panel A. Mean RNA levels (in arbitrary units [A.U.]) and SEM from duplicates of each lung sample is represented for each immunization group; relative values are referred to uninfected mice. P values from two-way ANOVA test are shown (***, P < 0.001).

Similar articles

Cited by

References

    1. Lu R, Zhao X, Li J, Niu P, Yang B, Wu H, Wang W, Song H, Huang B, Zhu N, Bi Y, Ma X, Zhan F, Wang L, Hu T, Zhou H, Hu Z, Zhou W, Zhao L, Chen J, Meng Y, Wang J, Lin Y, Yuan J, Xie Z, Ma J, Liu WJ, Wang D, Xu W, Holmes EC, Gao GF, Wu G, Chen W, Shi W, Tan W. 2020. Genomic characterisation and epidemiology of 2019 novel coronavirus: implications for virus origins and receptor binding. Lancet 395:565–574. doi:10.1016/S0140-6736(20)30251-8. - DOI - PMC - PubMed
    1. Zhu N, Zhang D, Wang W, Li X, Yang B, Song J, Zhao X, Huang B, Shi W, Lu R, Niu P, Zhan F, Ma X, Wang D, Xu W, Wu G, Gao GF, Tan W, China Novel Coronavirus Investigating and Research Team . 2020. A novel coronavirus from patients with pneumonia in China, 2019. N Engl J Med 382:727–733. doi:10.1056/NEJMoa2001017. - DOI - PMC - PubMed
    1. de Wit E, van Doremalen N, Falzarano D, Munster VJ. 2016. SARS and MERS: recent insights into emerging coronaviruses. Nat Rev Microbiol 14:523–534. doi:10.1038/nrmicro.2016.81. - DOI - PMC - PubMed
    1. Chakraborty I, Maity P. 2020. COVID-19 outbreak: migration, effects on society, global environment and prevention. Sci Total Environ 728:138882. doi:10.1016/j.scitotenv.2020.138882. - DOI - PMC - PubMed
    1. Huang C, Wang Y, Li X, Ren L, Zhao J, Hu Y, Zhang L, Fan G, Xu J, Gu X, Cheng Z, Yu T, Xia J, Wei Y, Wu W, Xie X, Yin W, Li H, Liu M, Xiao Y, Gao H, Guo L, Xie J, Wang G, Jiang R, Gao Z, Jin Q, Wang J, Cao B. 2020. Clinical features of patients infected with 2019 novel coronavirus in Wuhan, China. Lancet 395:497–506. doi:10.1016/S0140-6736(20)30183-5. - DOI - PMC - PubMed