. 2021 May 15;81(10):2666-2678.
doi: 10.1158/0008-5472.CAN-20-1504. Epub 2021 Jan 7.

CDK2-Mediated Upregulation of TNFα as a Mechanism of Selective Cytotoxicity in Acute Leukemia

Affiliations

CDK2-Mediated Upregulation of TNFα as a Mechanism of Selective Cytotoxicity in Acute Leukemia

Husheng Ding et al. Cancer Res. .

Abstract

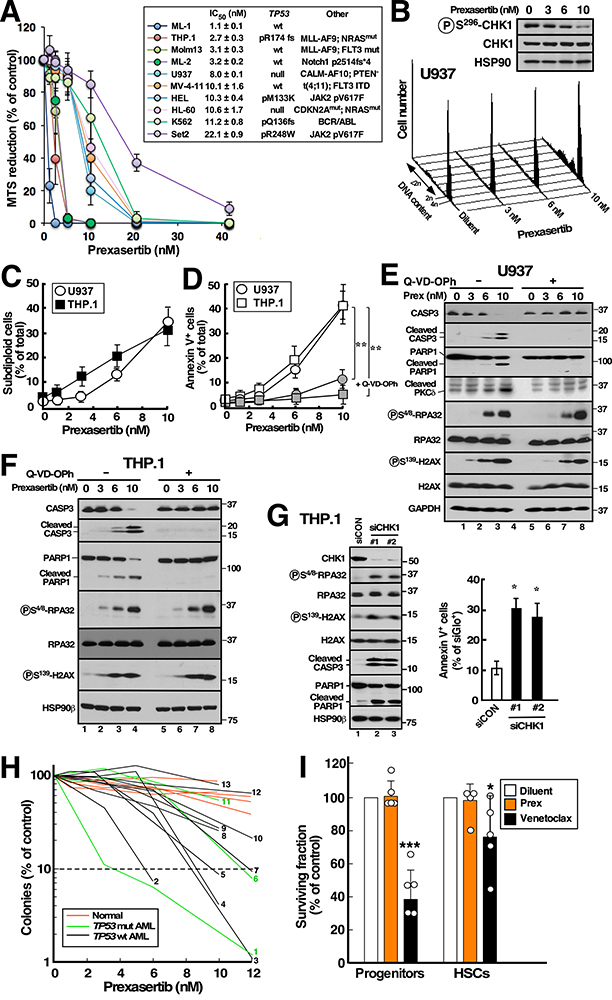
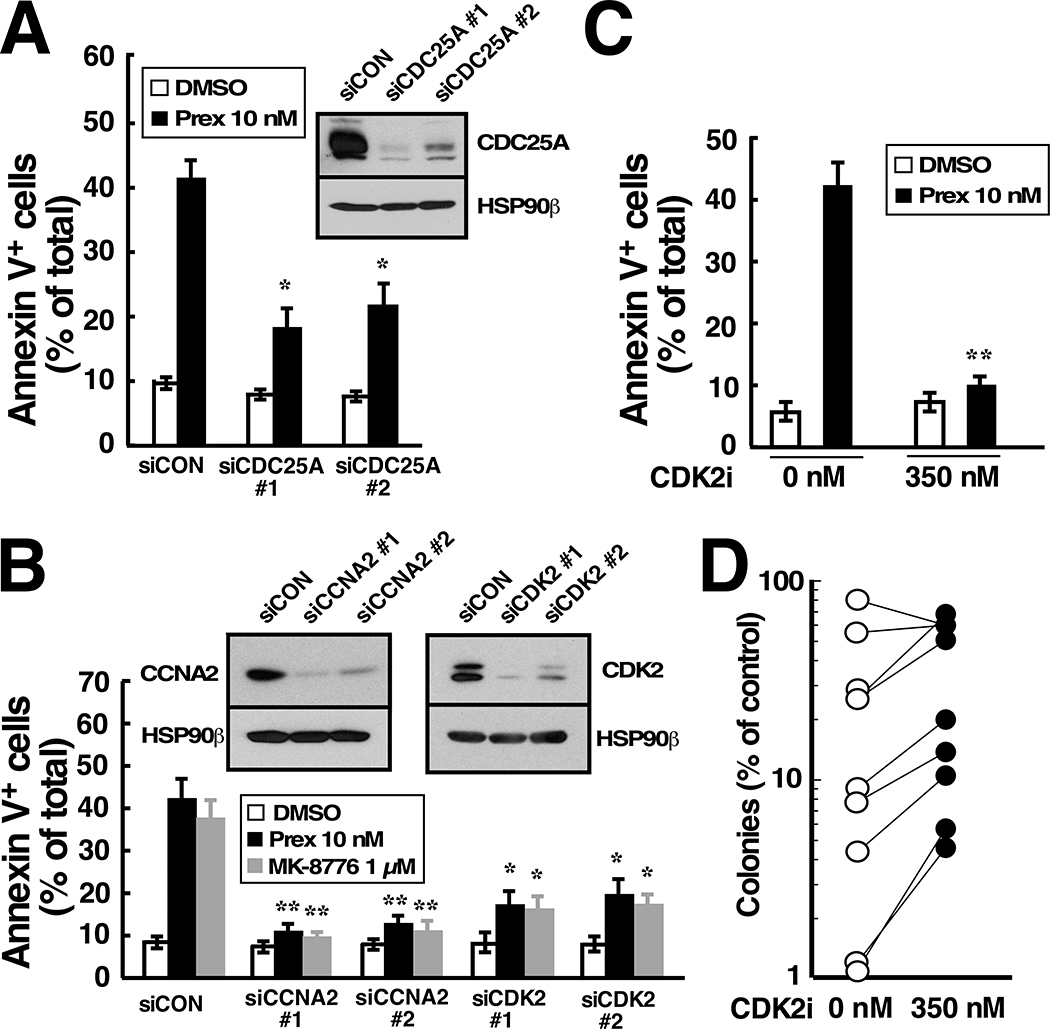
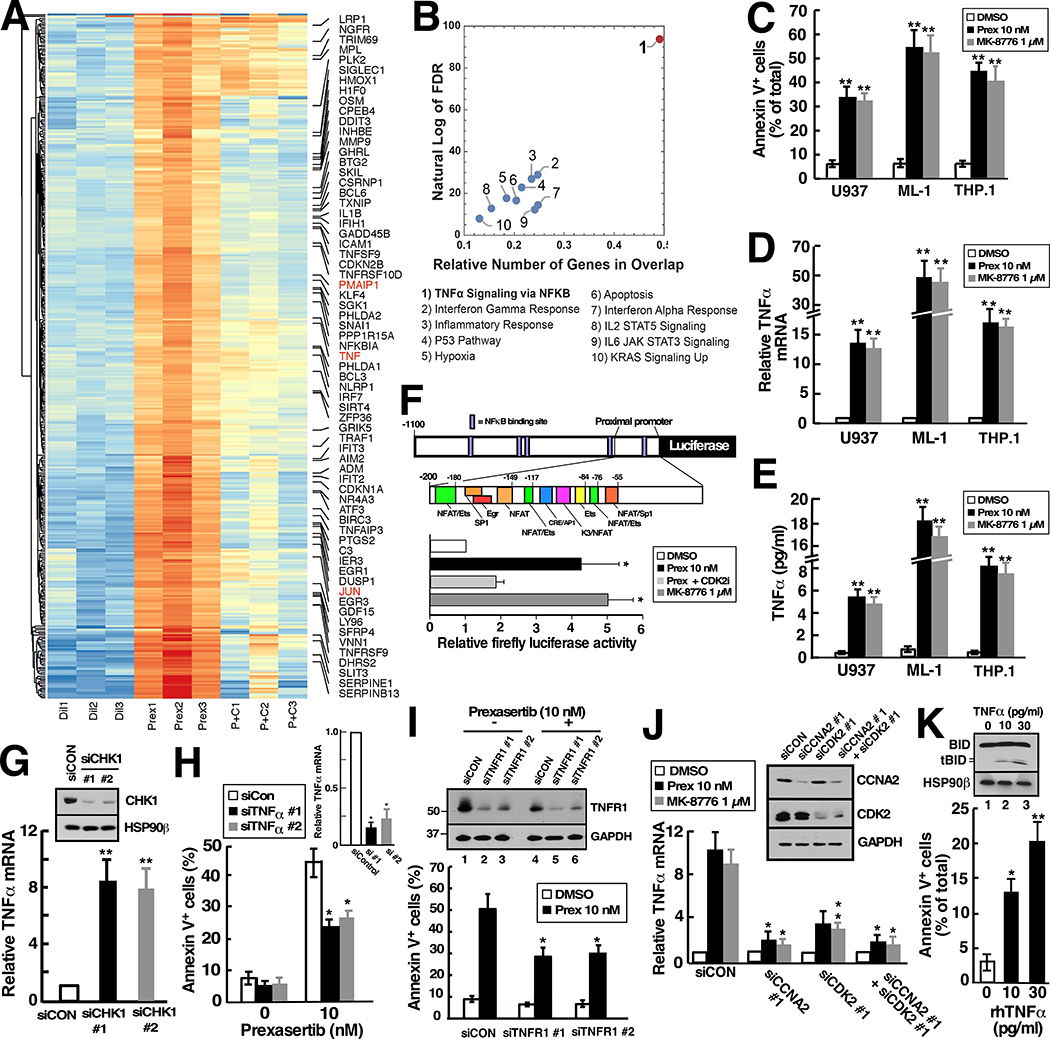
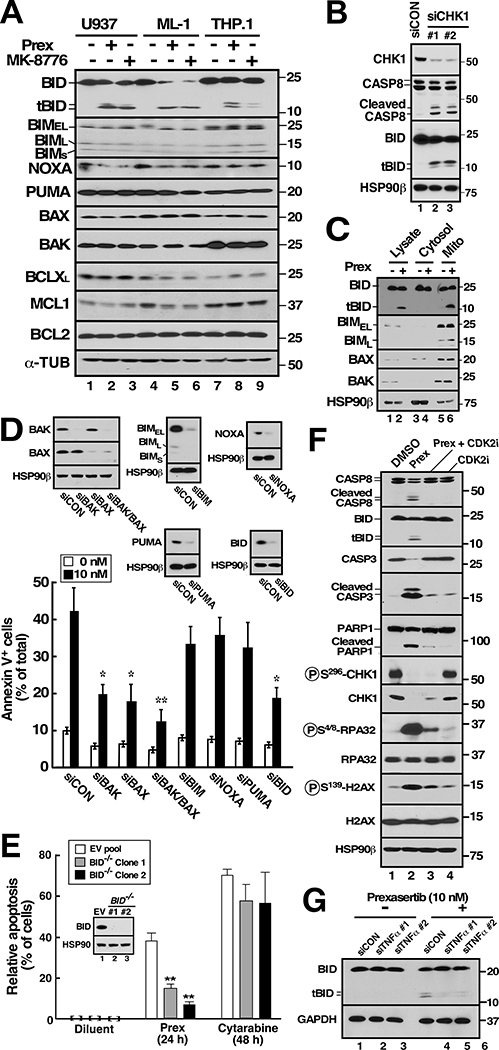
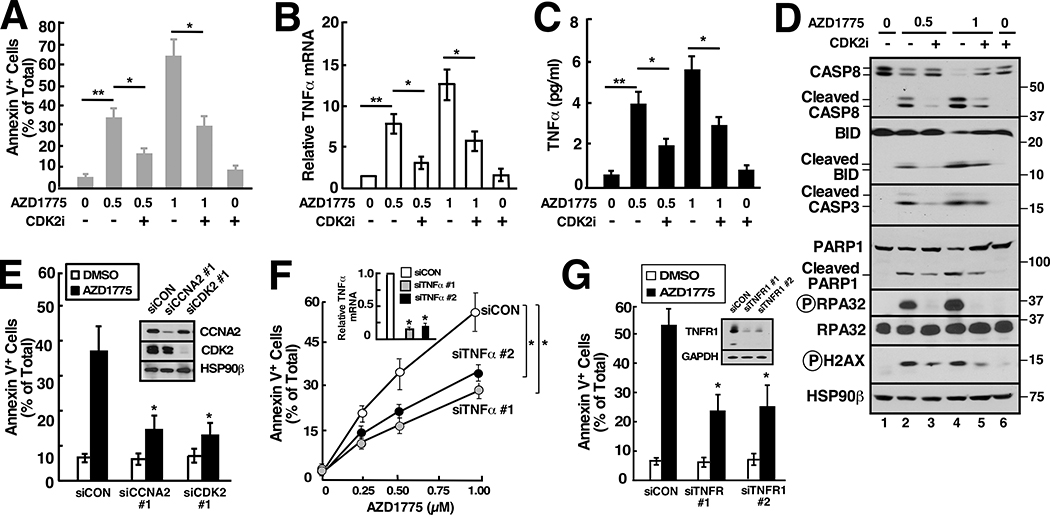
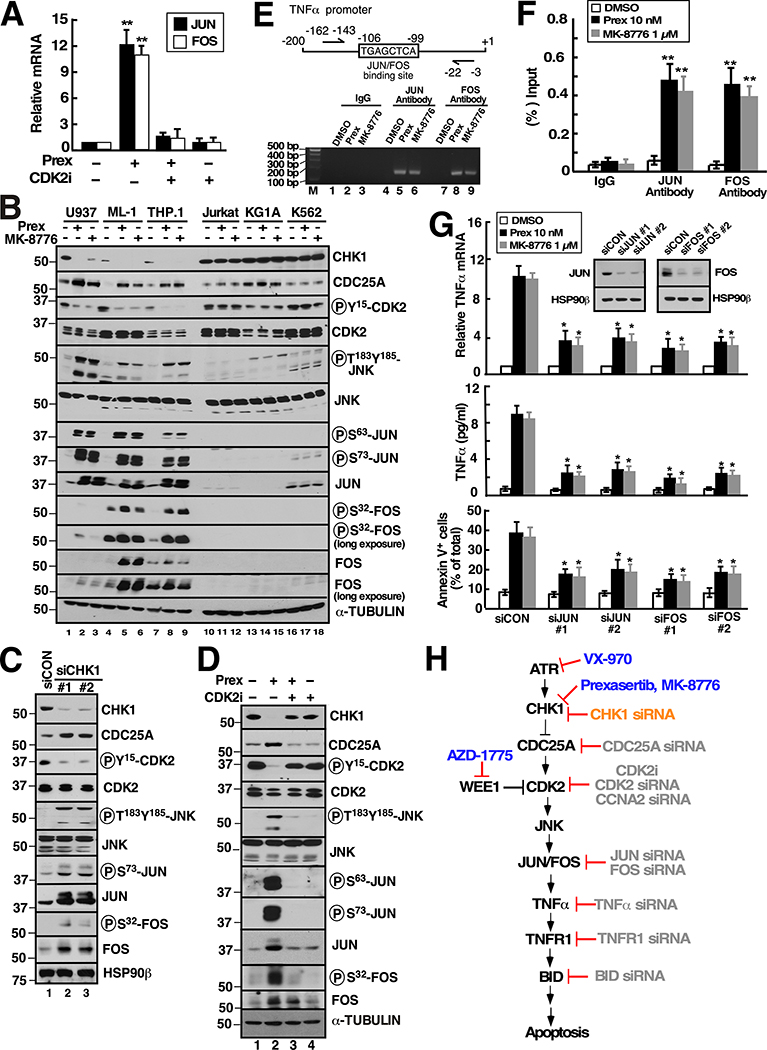
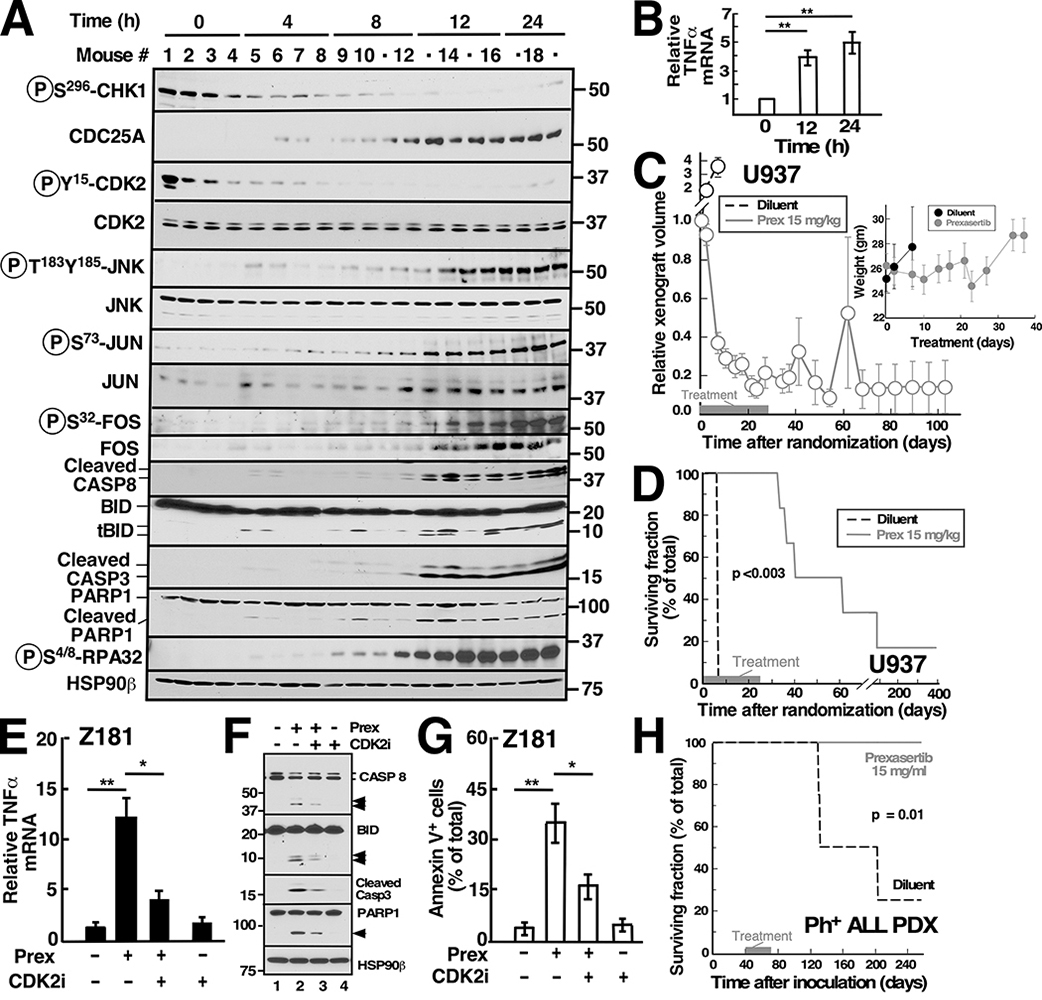
Although inhibitors of the kinases CHK1, ATR, and WEE1 are undergoing clinical testing, it remains unclear how these three classes of agents kill susceptible cells and whether they utilize the same cytotoxic mechanism. Here we observed that CHK1 inhibition induces apoptosis in a subset of acute leukemia cell lines in vitro, including TP53-null acute myeloid leukemia (AML) and BCR/ABL-positive acute lymphoid leukemia (ALL), and inhibits leukemic colony formation in clinical AML samples ex vivo. In further studies, downregulation or inhibition of CHK1 triggered signaling in sensitive human acute leukemia cell lines that involved CDK2 activation followed by AP1-dependent TNF transactivation, TNFα production, and engagement of a TNFR1- and BID-dependent apoptotic pathway. AML lines that were intrinsically resistant to CHK1 inhibition exhibited high CHK1 expression and were sensitized by CHK1 downregulation. Signaling through this same CDK2-AP1-TNF cytotoxic pathway was also initiated by ATR or WEE1 inhibitors in vitro and during CHK1 inhibitor treatment of AML xenografts in vivo. Collectively, these observations not only identify new contributors to the antileukemic cell action of CHK1, ATR, and WEE1 inhibitors, but also delineate a previously undescribed pathway leading from aberrant CDK2 activation to death ligand-induced killing that can potentially be exploited for acute leukemia treatment. SIGNIFICANCE: This study demonstrates that replication checkpoint inhibitors can kill AML cells through a pathway involving AP1-mediated TNF gene activation and subsequent TP53-independent, TNFα-induced apoptosis, which can potentially be exploited clinically.


Conflict of interest statement

Conflicts of interest: Dr. Patnaik has served on an advisory board for Stem Line Pharmaceuticals. Dr. Koh is employed by Gilead Sciences/Kite Pharmaceuticals. The other authors have no conflicts of interest to disclose.

Figures

Figure 1:
Figure 1:. Proapoptotic effects of CHK1 inhibition or knockdown.
A, human AML lines with the indicated genomic features were treated for 6 d with prexasertib and assayed for MTS reduction. B-F, U937 (B-E) and THP.1 cells (C, D, F) were treated for 24 h with prexasertib ± the caspase inhibitor Q-VD-OPh (5 μM), and analyzed for DNA fragmentation (B, C), annexin V binding (D) or cleavage of caspase substrates (E, F). Similar results were observed in ML-1 cells (Fig. S3). Inset in B, immunoblot of CHK1 Ser296 autophosphorylation, a marker of CHK1 activity, after a 6-h treatment with prexasertib and 30 nM bortezomib (to prevent proteasome-mediated CHK1 degradation). G, after siRNA transfection, THP.1 cells were incubated for 48 h and harvested for annexin V binding (bar graph) or immunoblotting. Error bars in A, C, D, and G: mean ± sd of 3 independent experiments. *, **, and *** in this and subsequent figures: p <0.05, p <0.01 and p <0.001, respectively, relative to control siRNA or treatment with prexasertib alone. H, freshly isolated clinical AML isolates (black or green lines) were plated in methylcellulose with prexasertib (0, 3, 6 and 10 nM or 0, 3, 6 and 12 nM) and assayed for leukemic colonies (CFU-L). Green lines, samples with TP53 mutations. Black lines, samples without known TP53 mutations (Table S3). Orange lines, myeloid colony formation by cells from normal marrows. Numbers correspond to sample numbers in Table S3. I, effect of diluent vs. 10 nM prexasertib (Prex) on relative survival of normal myeloid stem and progenitor cells (CD34+/CD45dim/CD38+) or hematopoietic stem cells (HSCs, CD34+/CD38/ CD90+/CD45RA) at 24 h as assessed by 10-color flow cytometry (27). Venetoclax (100 nM) is a positive control for toxicity in stem and progenitor cells. Circles in I, results with individual samples. Error bars: mean ± sd of assays in 4–5 separate samples.
Figure 2.
Figure 2.. Contribution of CDC25A and CDK2 to CHK1i killing.
A, B, 24 h after siRNA transfection, U937 cells were treated for 24 h with the indicated CHK1i and analyzed by annexin V staining. Insets, immunoblots showing knockdown. C, U937 cells were treated for 24 h with 10 nM prexasertib (Prex) in the absence or presence of 350 nM CDK2i and analyzed for annexin V staining. D, AML isolates were plated in methylcellulose in the presence of 10–12 nM prexasertib ± CDK2i and examined for leukemic colonies. Values are normalized to diluent treated control samples. Error bars in B and C: mean ± sd from 3 independent experiments.
Figure 3.
Figure 3.. TNFα contribution to CHK1i-induced apoptosis.
A, heat map of RNAseq experiment comparing biological replicates of U937 cells treated for 24 h with diluent (Dil) or 10 nM prexasertib (Prex) or 10 nM prexasertib + CDK2i (P + C). Of 384 transcripts that were highly differentially expressed, defined as |log2 fold change|>2 and p-value <0.01, in response to prexasertib, 67 (labeled) have been implicated in cell death or apoptosis. Red labels indicate transcripts that figured prominently in subsequent analysis. B, significantly upregulated differentially expressed genes, defined as [|log2 fold change|>1 and false discovery rate (FDR) < 0.01], were queried against the hallmark gene sets in the Molecular Signatures Database v7.0 (MSigDB) as described in the Supplemental Methods. Natural log of FDR (q-value) given for the top ten gene sets is shown on the y-axis with the relative proportion of genes in the overlap (genes in overlap/genes in gene set) shown on the x-axis. TNFα signaling via NFκB is the most significantly upregulated pathway by FDR (q-value) as well as by the relative proportion of genes in the overlap. C, cells treated with diluent, 10 nM prexasertib (Prex) or 1 μM MK-8776 for 24 h were stained with annexin V. D, E, cells treated for 24 h with prexasertib or MK-8776 in the presence of Q-VD-OPh (to prevent apoptosis-associated mRNA degradation – 28) were assayed for TNFα mRNA (D) and TNFα protein release into the medium (E). F, TNF luciferase reporter construct (upper panel) containing 1100 bp of upstream sequence (the canonical TNF promoter – 40) was transfected into U937 cells along with pTK Renilla transfection control. After 24 h, cells were treated with diluent or CHK1i for 24 h, then assayed for firefly and Renilla luciferase. The ratio was then normalized to diluent-treated controls. G, after siRNA transfection, THP.1 cells were incubated for 48 h in the presence of Q-VD-OPh and assayed for TNFα mRNA. H-J, 24 h after siRNA transfection, U937 cells were treated for 24 h with diluent or CHK1i and analyzed for annexin V binding (H, I) or relative TNFα mRNA (J). Insets in G, I and J: immunoblots to assess knockdowns. K, U937 cells treated for 24 h with recombinant human (rh) TNFα were stained with annexin V (bar graph) or subjected to immunoblotting (inset). Error bars: mean ± sd from 3 independent experiments.
Figure 4.
Figure 4.. Contribution of BID to CHK1i-induced apoptosis.
A, after cells were treated with diluent, 10 nM prexasertib (Prex) or 1 μM MK-8776 for 24 h, whole cell lysates were blotted for BCL2 family members and, as a loading control, α-Tubulin. B, 48 h after siRNA transfection, THP.1 whole cell lysates were prepared for immunoblotting. C, after U937 cells were treated with diluent or 10 nM prexasertib for 24 h, cell lysates, cytosol or mitochondria were blotted for the indicated BCL2 family members. D, 24 h after siRNA transfection, cells were treated with diluent or 10 nM prexasertib for 24 h and stained with annexin V. Blots above bar graph show knockdown at 48 h. E, pooled U937 cells transduced with empty vector (EV) or two separate BID knockout clones were treated with diluent, 10 nM prexasertib (24 h) or 200 nM cytarabine (48 h) and assayed for DNA fragmentation. Baseline apoptosis was subtracted to correct for differences in apoptosis in diluent-treated cells incubated for 24 vs. 48 h. F, after U937 cells were treated for 24 h with 10 nM prexasertib ± CDK2i, whole cell lysates were subjected to immunoblotting. G, beginning 24 h after transfection with control or TNFα siRNA, cells were treated with diluent or 10 nM prexasertib for 24 h and subjected to immunoblotting. Error bars in D and E: mean ± sd from 3 independent experiments.
Figure 5.
Figure 5.. CDK2/TNFα/BID pathway contributes to WEE1i-induced apoptosis.
A-D, U937 cells treated for 24 h with adavosertib (AZD1775, 0.5 – 1 μM) ± CDK2i were assayed for annexin V binding (A), TNFα mRNA (B), TNFα release (C), and cleavage of caspase substrates (D). Q-VD-OPh was included in panels B and C. E-G, 24 h after siRNA transfection, U937 cells were treated for 24 h with diluent or adavosertib 0.5 μM (E, G) or the indicated concentrations (F) and analyzed for annexin V binding. Insets in E, F and G, immunoblots or qRT-PCR to assess knockdown. Error bars in A-C and E-G: mean ± sd from 3 independent experiments.
Figure 6.
Figure 6.. Role of AP-1 in CDK2-mediated TNF transactivation.
A, after U937 cells were treated with 10 nM prexasertib (Prex) and 5 μM Q-VD-OPh ± CDK2i for 24 h, JUN and FOS mRNA were measured by qRT-PCR. B, 24 h after treatment with 10 nM prexasertib or 1 μM MK-8776, whole cell lysates were harvested for immunoblotting with α-Tubulin as the loading control. C, after siRNA transfection, THP.1 cells were incubated with 5 μM Q-VD-OPh for 48 h and harvested for immunoblotting. D, after U937 cells were treated for 24 h with 10 nM prexasertib ± CDK2i in the presence of Q-VD-OPh, whole cell lysates were harvested. E, F, after chromatin immunoprecipitation with the indicated antibody, samples were subjected to PCR with primers that amplify a 160-bp fragment encompassing the AP1 binding site in the TNF promoter followed by agarose gel electrophoresis (E) or qPCR with primers that span this site (F). Control IgG served as a negative control. G, 24 h after siRNA transfection, U937 cells were treated for 24 h with 10 nM prexasertib or 1 μM MK-8776 and analyzed for TNFα mRNA (top panel), TNFα concentration in the supernatant (middle panel), and annexin V binding (lower panel). Treatments in the top and middle panels included Q-VD-OPh. Inset in G, immunoblots showing knockdown efficiency. Error bars in A, F and G: mean ± sd from 3 independent experiments. H, summary of steps involved in killing of AML cell lines by CHK1, ATR or WEE1 inhibitors. Manipulations used to interrogate the pathway in the present study are indicated in grey.
Figure 7.
Figure 7.. Effect of prexasertib on acute leukemia xenografts.
A, B, mice bearing U937 flank xenografts were treated with prexasertib 10 mg/kg every 12 h and harvested for immunoblotting at the indicated time (A) or qRT-PCR for TNFα mRNA at 24 h (B). Our previous studies indicated that mRNA destruction in cells undergoing apoptosis in the absence of caspase inhibition (as in this in vivo experiment) can result in underestimation of the change in mRNA encoding a pro-apoptotic protein (28). C, D, xenograft volumes of surviving mice (C) and survival (D) of mice randomized to diluent vs. prexasertib 15 mg/kg twice daily for 3 days/wk x 4 weeks followed by observation (9). Inset in C, weights of mice in the two cohorts. E-G, BCR/ABL-positive Z181 ALL cells (42) were treated with 10 nM prexasertib ± CDK2i for 24 h in the presence (E) or absence (F, G) of Q-VD-OPh and assayed for TNFα mRNA (E), caspase-mediated cleavage of BID and PARP1 (arrows, F), and annexin V binding (G). H, 40 days after a Ph+ ALL PDX was expanded into 10 NSG mice, animals were randomized to diluent or prexasertib 15 mg/kg twice daily for 3 days/wk x 4 wks followed by observation. Error bars in B, E and G: mean ± sd from 3 independent experiments. Error bars in D: mean ± sd of values from surviving mice.

Similar articles

Cited by

References

    1. Dai Y, Grant S. New insights into checkpoint kinase 1 in the DNA damage response signaling network. Clinical Cancer Research 2010;16(2):376–83. - PMC - PubMed
    1. Karnitz LM, Zou L. Molecular Pathways: Targeting ATR in Cancer Therapy. Clin Cancer Res 2015;21(21):4780–5. - PMC - PubMed
    1. Brandsma I, Fleuren EDG, Williamson CT, Lord CJ. Directing the use of DDR kinase inhibitors in cancer treatment. Expert Opin Investig Drugs 2017;26(12):1341–55. - PMC - PubMed
    1. Ubhi T, Brown GW. Exploiting DNA Replication Stress for Cancer Treatment. Cancer Res 2019;79(8):1730–9. - PubMed
    1. Luo Y, Rockow-Magnone SK, Kroeger PE, Frost L, Chen Z, Han EK, et al. Blocking Chk1 expression induces apoptosis and abrogates the G2 checkpoint mechanism. Neoplasia 2001;3(5):411–9. - PMC - PubMed

Publication types

MeSH terms