. 2021 Mar 5;371(6533):eabb2986.
doi: 10.1126/science.abb2986. Epub 2021 Jan 7.

Characterization of a common progenitor pool of the epicardium and myocardium

Affiliations

Characterization of a common progenitor pool of the epicardium and myocardium

Richard C V Tyser et al. Science. .

Abstract

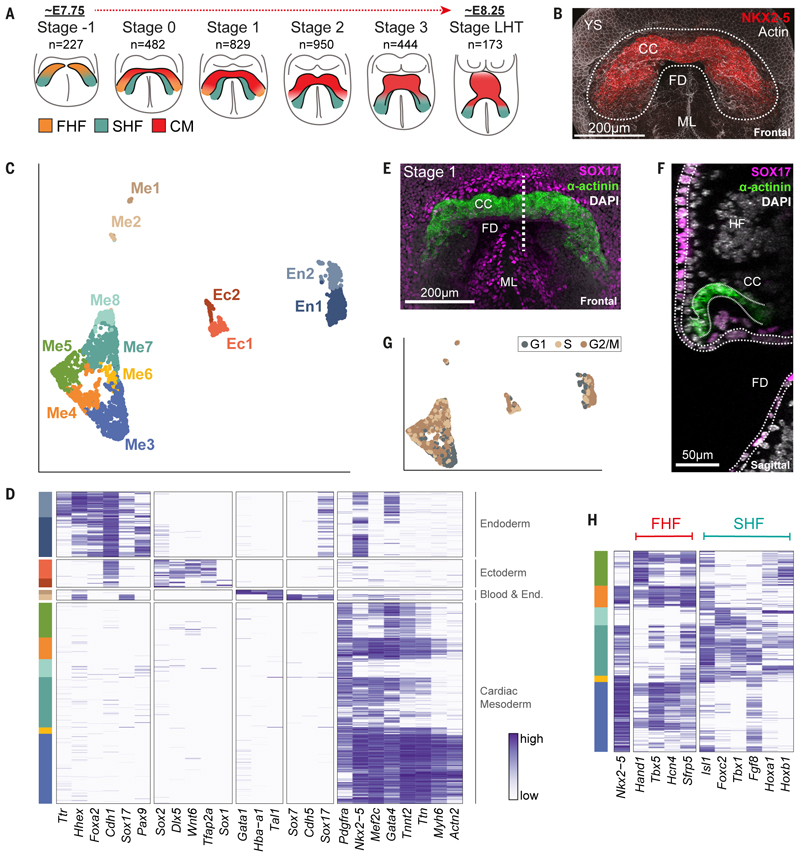
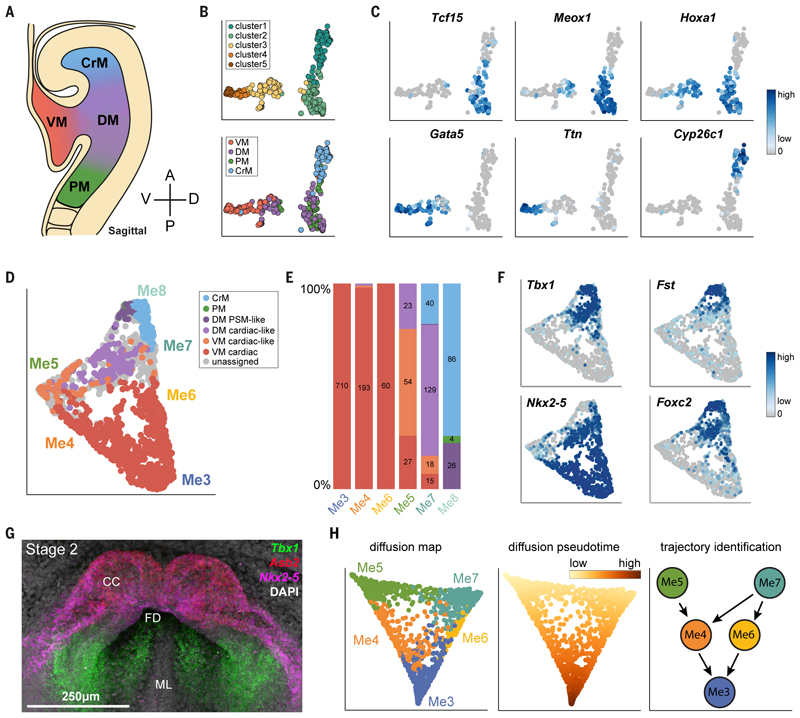
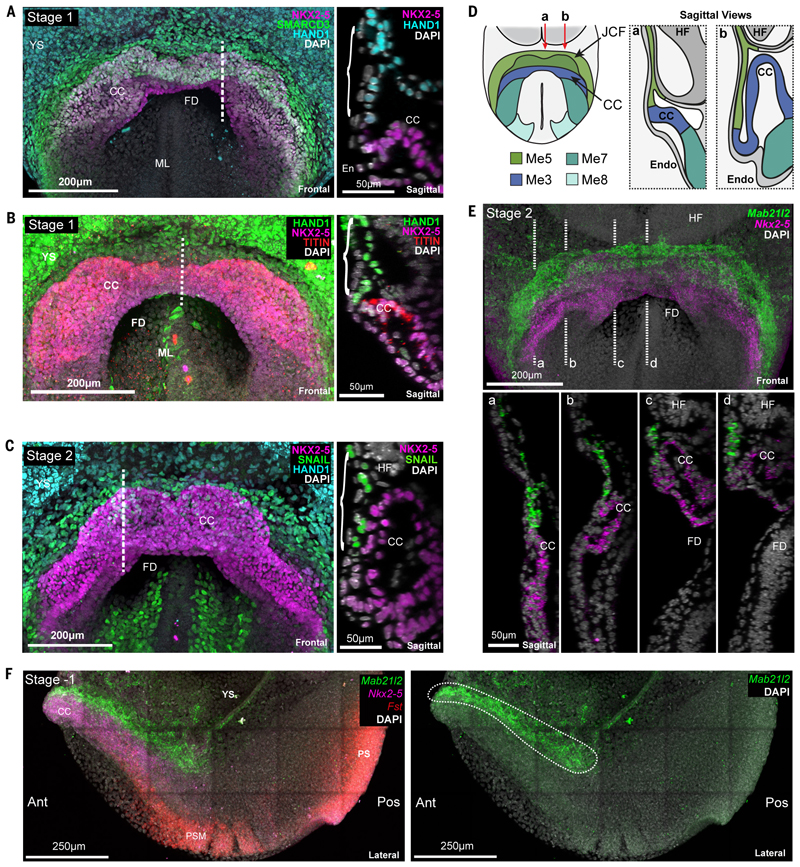
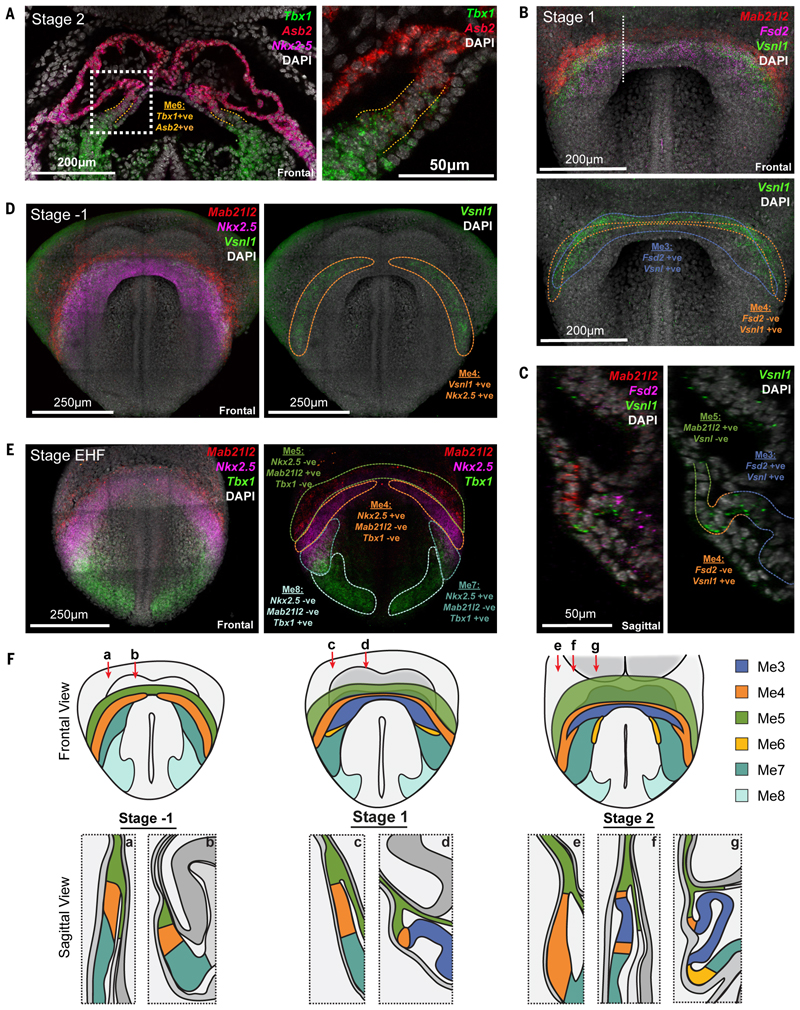
The mammalian heart is derived from multiple cell lineages; however, our understanding of when and how the diverse cardiac cell types arise is limited. We mapped the origin of the embryonic mouse heart at single-cell resolution using a combination of transcriptomic, imaging, and genetic lineage labeling approaches. This mapping provided a transcriptional and anatomic definition of cardiac progenitor types. Furthermore, it revealed a cardiac progenitor pool that is anatomically and transcriptionally distinct from currently known cardiac progenitors. Besides contributing to cardiomyocytes, these cells also represent the earliest progenitor of the epicardium, a source of trophic factors and cells during cardiac development and injury. This study provides detailed insights into the formation of early cardiac cell types, with particular relevance to the development of cell-based cardiac regenerative therapies.


Figures

Fig. 1
Fig. 1. Single-cell resolution spatiotemporal analysis of the forming murine heart.
A, Schematic of crescent and linear heart tube stages collected for scRNA-seq. n = number of single cells that passed quality control. FHF, first heart field; SHF, second heart field; CM, cardiomyocytes. B, Maximum intensity projection (MIP) of a stage 1 cardiac crescent region, marked by NKX2-5 protein expression (Movie S1). The dotted region highlights the area micro-dissected for collecting cells. CC, cardiac crescent; FD, foregut diverticulum; YS, yolk sac; ML, midline. C, UMAP plot of all cells that passed quality control (n = 3,105) computed from highly variable genes. Cells with similar transcriptional profiles were clustered into 12 different groups, as indicated by the different colors. D, Heatmap showing the expression of well-characterized marker genes. Cells (rows) are ordered first by cluster and then by hierarchical clustering. Each gene’s normalized log expression levels are regularized to be within [0,1]. E, MIP of representative embryo showing SOX17 and sarcomeric α-actinin protein (Movie S2). This serves as an example of the approach used to anatomically localize in the intact embryo the cell types identified in the scRNA-seq dataset. The dotted line represents the location of the section shown in F. F, Sagittal section of the embryo in E. Dotted lines outline the endoderm (SOX17+) and cardiac crescent (α-actinin+). See also Figure S3. HF, headfold. G, UMAP plot as in C but colored based on the inferred cell cycle stage of each cell. H, Heatmap of cardiac related clusters showing the expression of genes associated with the first (FHF) and second (SHF) heart fields.
Fig. 2
Fig. 2. Classification of cells from clusters Me3-Me8 based on an anatomically-resolved mesoderm reference dataset.
A, Schematic indicating the four regions of mesoderm micro-dissected to generate the reference dataset. Single cells from each region were isolated and used for scRNA-seq. B, UMAP plot of reference cells that pass quality control, colored by their anatomical origin (top) or clustering based on their transcriptional profiles (bottom). These cells were used to build a random forest classifier. C, Expression of genes that are important for the random forest, distinguishing the different types of cells. D, UMAP plot of clusters Me3-Me8 as in Figure 1C, but colored based on the class assigned by the random forest classifier. Cells in grey cannot be confidently assigned to a single class. E, Barplot indicating the proportion of cells in each cluster assigned to the different classes. Numbers indicate the number of cells. F, UMAP plots showing the expression of genes used to identify clusters Me7 and Me8. G, Maximum intensity projection of a stage 2 crescent showing expression of Nkx2-5 and Tbx1 using Hybridization Chain Reaction (Supplementary Movie 3). H, Diffusion map of cells from the cardiac mesoderm meta-cluster (Me3-Me7, n = 1,772); the first two diffusion components are shown. On the left, cells are colored by their cluster annotation as in Fig. 1C. In the middle, the color gradient indicates diffusion pseudotime measurements for each cell. On the right, schematic diagram summarizing the trajectories identified, linking the progenitor clusters Me5 and Me7 to the mature cardiomyocytes of Me3 (see also Figure S9). Color scales in C and F represent log2 normalized counts.
Fig. 3
Fig. 3. Identification of a transcriptionally and anatomically distinct cell type with cardiac progenitor like properties.
A-C, Maximum intensity projections (MIP) of immunostained embryos revealing anatomical localization of Me5 (brackets). Dotted line indicates the location of the sagittal section shown at right in each panel. YS, yolk sac; CC, cardiac crescent; FD, foregut diverticulum; ML, midline; En, endoderm; HF, headfold. D, Schematic highlighting the localization of Me5 (Juxta cardiac field (JCF)) and Me7/8, relative to the myocardium of the cardiac crescent (Me3). E, MIP of hybridization chain reaction (HCR) staining of an embryo at stage 2 revealing the distinct anatomical localization of JCF cells marked by Mab21l2 (Movie S6). Dotted lines (a-d) correspond to sagittal sections shown below. F, Left, MIP of lateral view of HCR on a stage -1 embryo showing distinct expression domains of Mab21l2, Nkx2-5 and Fst (Movie S7). Ant, anterior; Pos, posterior; PS, primitive streak; YS, yolk sac; PM, paraxial mesoderm. Right panel shows only Mab21l2 expression highlighting location of Me5 cells (white dotted region).
Fig. 4
Fig. 4. Anatomical identification of transition states during cardiomyocyte differentiation.
A, Coronal section of a hybridization chain reaction (HCR) stained stage 2 embryo, showing the anatomical location of Me6 (dotted orange lines) marked by co-expression of Tbx1 and Asb2. Dotted white box represents region of higher magnification at right. B, Maximum intensity projection (MIP) of HCR on stage 1 embryo showing expression of Mab21l2, Vsnl1 and Fsd2 to identify cluster Me4. Colored dotted lines correspond to Me3 and Me4 (Movie S8). White dotted line shows location of section in C. C, Sagittal section of embryo in B highlighting locations of Me3, Me4 and Me5. D, MIP of HCR on stage -1 embryo showing Mab21l2, Vsnl1 and Nkx2-5, to identify cluster Me4 (yellow dotted line) (Movie S11). E, MIP of an early headfold (EHF) stage embryo, prior to crescent formation, showing expression of Mab21l2, Tbx1 and Nkx2-5, to identify clusters Me4, Me5, Me7 and Me8. Colored dotted lines outline corresponding regions. F, Schematic highlighting the anatomical location of all mesoderm transcriptional states identified at multiple stages of heart formation. Red arrows represent the location of sagittal sectional views.
Fig. 5
Fig. 5. The JCF represents a cardiac progenitor population.
A, Top, sagittal section of Mesp1-Cre; R26R-mTmG embryos immunostained for α-actinin and GFP (n=6). Bottom, section of Nkx2-5-Cre; R26R-mTmG embryos immunostained for SMARCD3 and GFP (n=4). Dotted regions highlight the JCF, revealing it is derived from Mesp1, but not Nkx2-5, expressing cells. HF; headfold; FD, foregut diverticulum; CC, cardiac crescent. B, Nkx2-5 expression levels plotted against the diffusion pseudotime of all cells consistent with the trajectory from Me5 to Me3. Points are colored based on their assigned cluster. Nkx2-5 is upregulated during the transition from JCF towards cardiomyocytes. The line is the quadratic local linear fit of the expression levels as a function of pseudotime. C, Schematic diagrams highlighting the relative positions of Me3-Me5 during rostral folding and the transition from stage 0 to stage 2 cardiac crescents. D,E, Frames from time-lapse movie of an E7.5 Nkx2-5-Cre; R26-nTnG embryo imaged over a 16-hour period with light-sheet microscopy. D, JCF cells migrated from a more rostral position towards the developing crescent (blue spheres = representative tracked cells). A, anterior; P, posterior. E, Nkx2-5 was upregulated by JCF cells, as shown by an increase in the nuclear expression of GFP. Circles indicate the same cell tracked across time, shown in different channels. Representative cells also shown in Movies S12 and S13. F, On the left, Mab21l2 gene expression levels are plotted against the diffusion pseudotime of all cells consistent with the trajectory from Me5 to Me3. Points are colored based on their assigned cluster. Mab21l2 expression is downregulated during the transition from the JCF towards cardiomyocytes. At right, maximum intensity projection (MIP) of HCR on an early headfold stage (EHF) embryo, prior to crescent formation, revealing the early rostral expression of Mab21l2 in JCF progenitors proximal to Nkx2-5 and Fst expression. 3D rendering of expression is shown in Movie S14. ML, midline. G, Tbx18 is expressed in multiple cell clusters. The percentages of Tbx18-positive cells from each cluster are shown as proportionally sized circles. At right, MIP of HCR for Tbx18, Mab21l2 and Nkx2-5 in a stage 2 embryo, highlighting location of Tbx18 expression (brackets) (Movie S6). Schematic at bottom, highlights Tbx18 expression domains in the anterior crescent region of the developing embryo.
Fig. 6
Fig. 6. Juxta-cardiac field progenitors contribute to cardiomyocytes and epicardium.
A, Schematic showing the experimental design of lineage labelling experiments using a Mab21l2- iCreERT2 transgenic mouse line. At right, a schematic highlighting that labelling of the juxta-cardiac field (JCF) between E7.75 and E8.0 leads to labelling of both cardiomyocytes (CM) and the epicardium (Epi) at E10.5. B, Maximum intensity projection (MIP) of a stage 1 Mab21l2- iCreERT2; R26R-YFP embryo immunostained for cardiac troponin T (cTnT) and YFP. The dotted line represents the location of the sagittal section at right. YFP positive cells (arrows) are located in the JCF and do not express cardiomyocyte marker cTnT. CC, cardiac crescent; FD, foregut diverticulum; YS, yolk sac; ML, midline; HF, headfold. C, MIP of a looping heart tube from an E8.5 Mab21l2-iCreERT2; R26R-YFP embryo immunostained for α-actinin and YFP. Dotted lines show locations of sagittal sections at right. Arrows highlight the location of recombined YFP cells within the myocardium (2.) and maintained within the JCF progenitor region (1.). The dotted box (3.) shows zoomed in view of JCF derived cardiomyocytes with sarcomeric striations of α-actinin. OFT, outflow tract; IFT, inflow tract. D, MIP of an E9.5 embryo immunostained for WT1 and YFP. WT1 marks both the nephrogenic cord and proepicardium (boxed). Below are high magnification views of the proepicardium highlighting the coexpression of YFP and WT1. E and F, Immunostaining of E10.5 hearts showing co-expression of α-actinin (E) and WT1 (F) with YFP positive cells, highlighting the dual potential of the JCF. Dotted boxes represent zoomed in regions. Dorsal and ventral views shown.

References

    1. Lawson Ka. Fate mapping the mouse embryo. Int J Dev Biol. 1999;43:773–775. - PubMed
    1. Parameswaran M, Tam PPL. Regionalisation of cell fate and morphogenetic movement of the mesoderm during mouse gastrulation. Dev Genet. 1995;17:16–28. - PubMed
    1. Saga Y, et al. MesP1 is expressed in the heart precursor cells and required for the formation of a single heart tube. Development. 1999;126:3437–3447. - PubMed
    1. Meilhac SM, Buckingham ME. The deployment of cell lineages that form the mammalian heart. Nat Rev Cardiol. 2018;15:705–724. - PubMed
    1. Lescroart F, et al. Early lineage restriction in temporally distinct populations of Mesp1 progenitors during mammalian heart development. Nat Cell Biol. 2014 doi: 10.1038/ncb3024. - DOI - PMC - PubMed

Publication types