Comparative Study
. 2021 Jan;9(1):e001615.
doi: 10.1136/jitc-2020-001615.

Differences in TCR repertoire and T cell activation underlie the divergent outcomes of antitumor immune responses in tumor-eradicating versus tumor-progressing hosts

Affiliations
Comparative Study

Differences in TCR repertoire and T cell activation underlie the divergent outcomes of antitumor immune responses in tumor-eradicating versus tumor-progressing hosts

Rachel A Woolaver et al. J Immunother Cancer. 2021 Jan.

Abstract

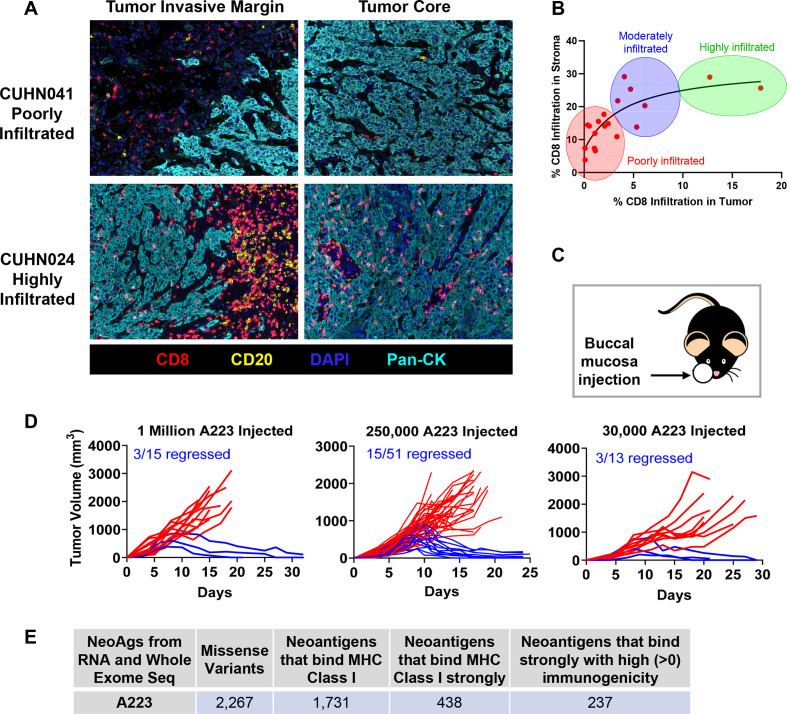
Background: Antitumor immunity is highly heterogeneous between individuals; however, underlying mechanisms remain elusive, despite their potential to improve personalized cancer immunotherapy. Head and neck squamous cell carcinomas (HNSCCs) vary significantly in immune infiltration and therapeutic responses between patients, demanding a mouse model with appropriate heterogeneity to investigate mechanistic differences.

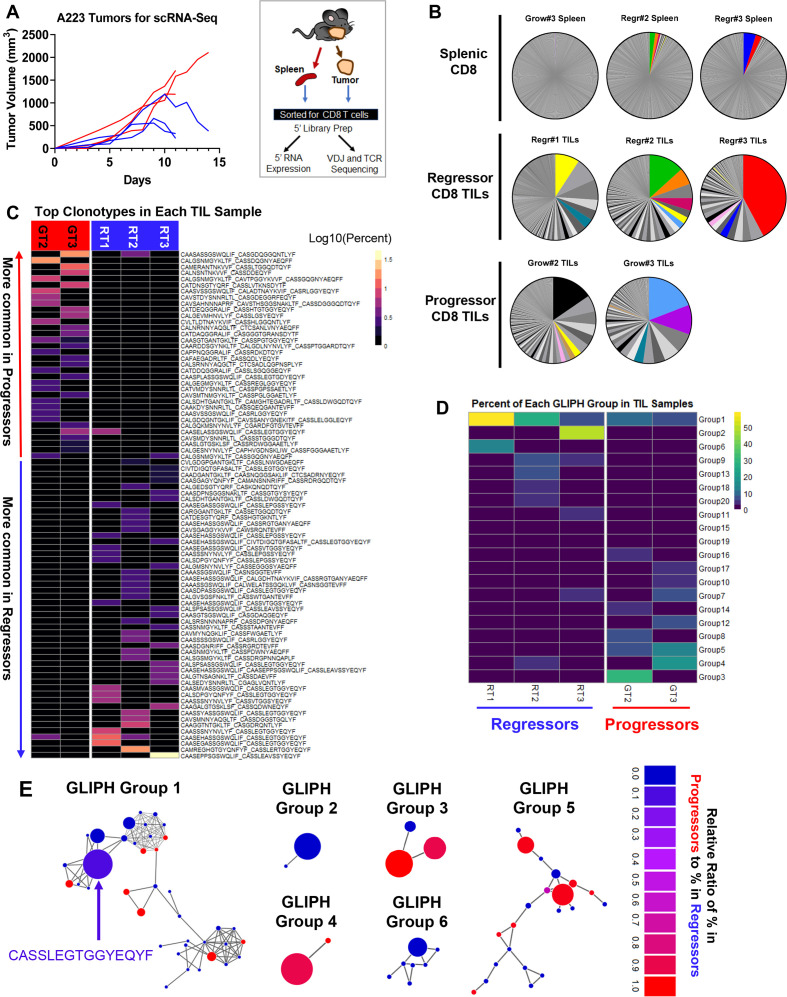
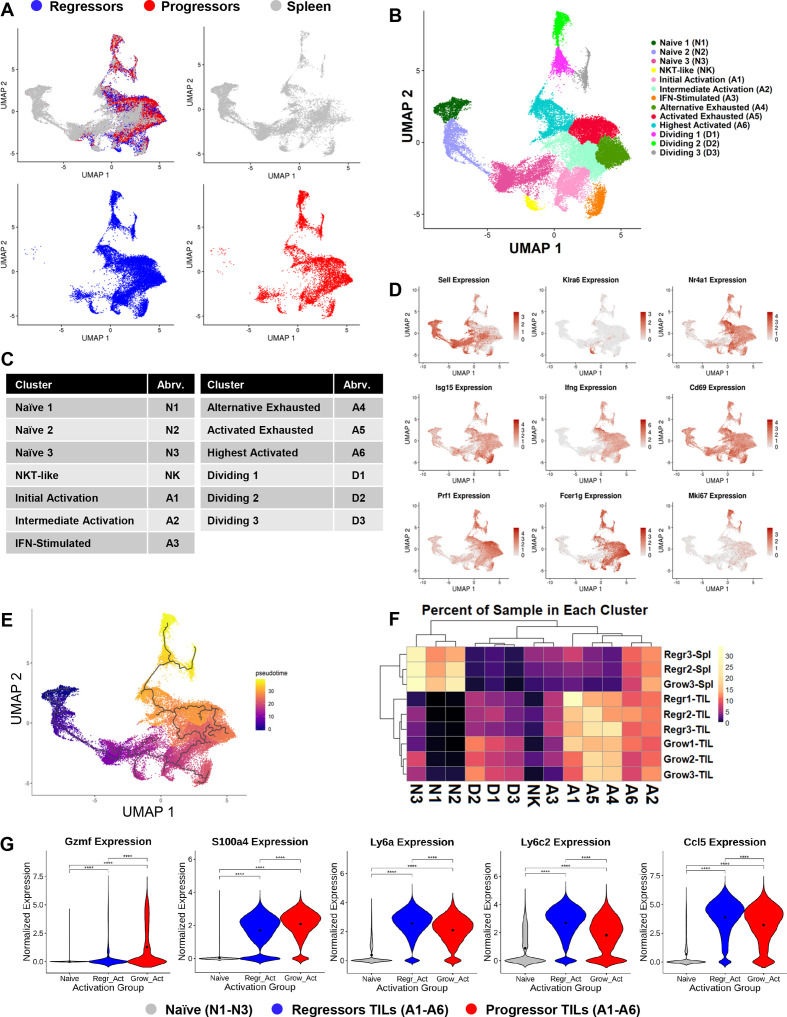
Methods: We developed a unique HNSCC mouse model to investigate underlying mechanisms of heterogeneous antitumor immunity. This model system may provide a better control for tumor-intrinsic and host-genetic variables, thereby uncovering the contribution of the adaptive immunity to tumor eradication. We employed single-cell T-cell receptor (TCR) sequencing coupled with single-cell RNA sequencing to identify the difference in TCR repertoire of CD8 tumor-infiltrating lymphocytes (TILs) and the unique activation states linked with different TCR clonotypes.

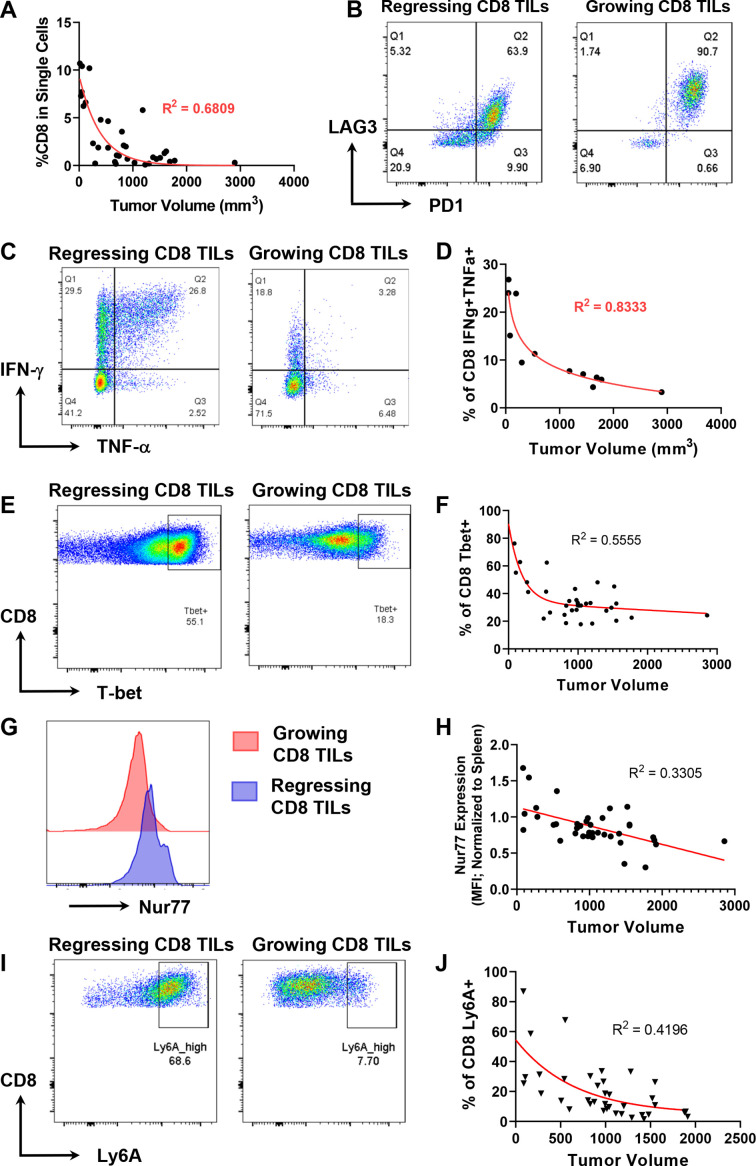
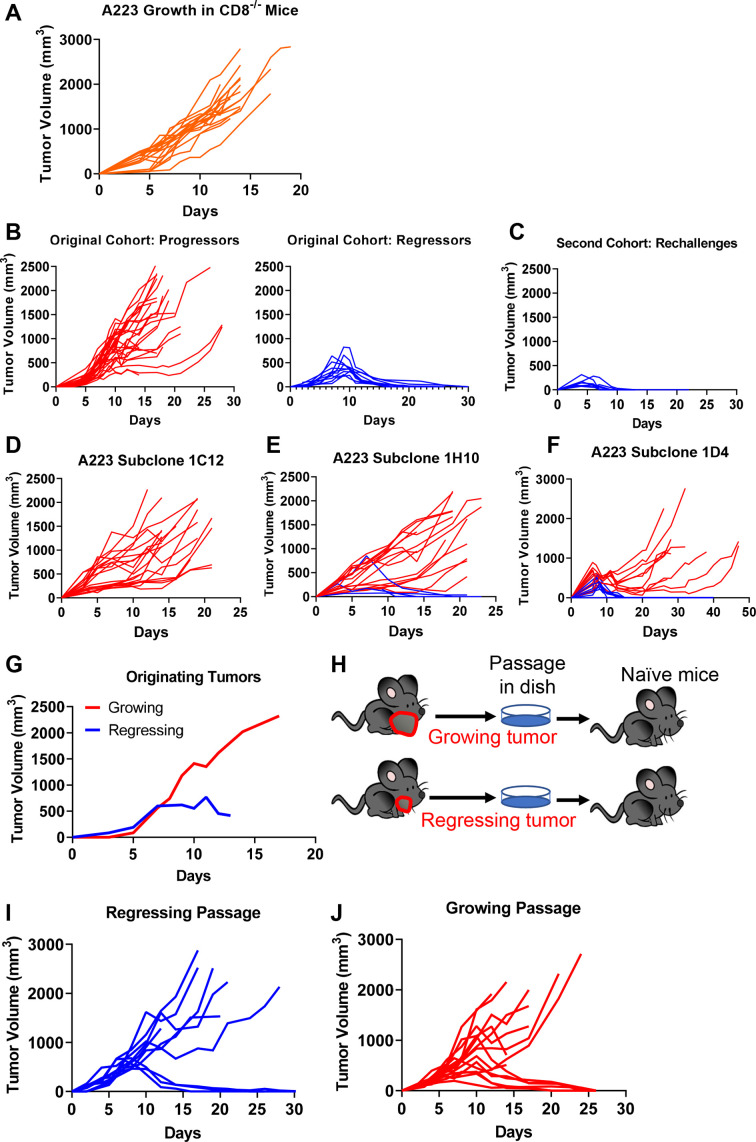
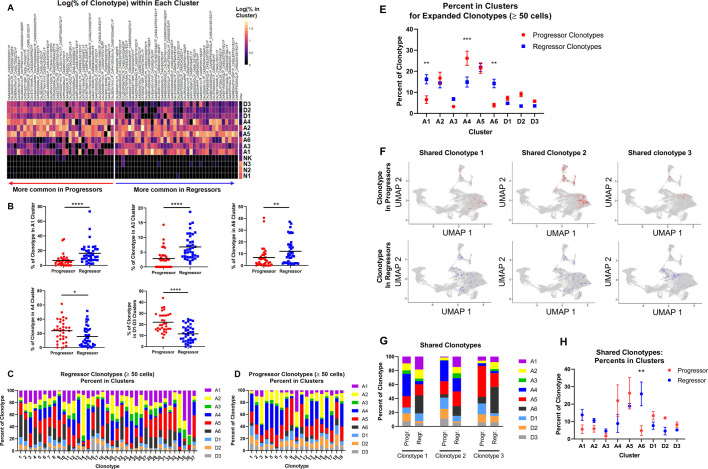
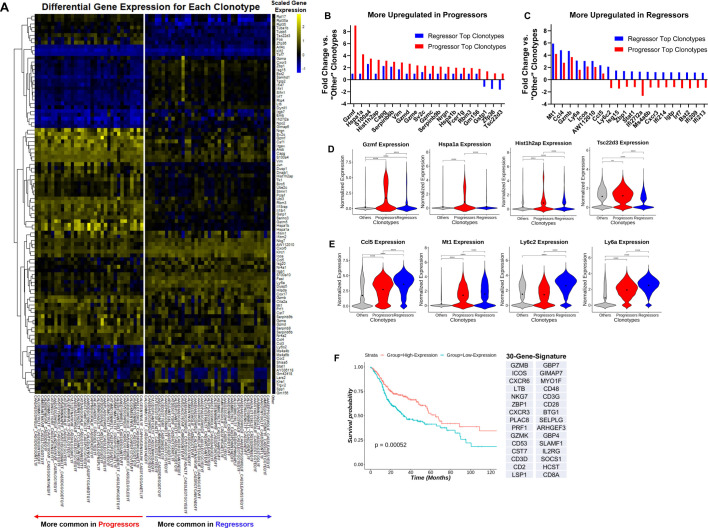
Results: We discovered that genetically identical wild-type recipient mice responded heterogeneously to the same squamous cell carcinoma tumors orthotopically transplanted into the buccal mucosa. While tumors initially grew in 100% of recipients and most developed aggressive tumors, ~25% of recipients reproducibly eradicated tumors without intervention. Heterogeneous antitumor responses were dependent on CD8 T cells. Consistently, CD8 TILs in regressing tumors were significantly increased and more activated. Single-cell TCR-sequencing revealed that CD8 TILs from both growing and regressing tumors displayed evidence of clonal expansion compared with splenic controls. However, top TCR clonotypes and TCR specificity groups appear to be mutually exclusive between regressing and growing TILs. Furthermore, many TCRα/TCRβ sequences only occur in one recipient. By coupling single-cell transcriptomic analysis with unique TCR clonotypes, we found that top TCR clonotypes clustered in distinct activation states in regressing versus growing TILs. Intriguingly, the few TCR clonotypes shared between regressors and progressors differed greatly in their activation states, suggesting a more dominant influence from tumor microenvironment than TCR itself on T cell activation status.

Conclusions: We reveal that intrinsic differences in the TCR repertoire of TILs and their different transcriptional trajectories may underlie the heterogeneous antitumor immune responses in different hosts. We suggest that antitumor immune responses are highly individualized and different hosts employ different TCR specificities against the same tumors, which may have important implications for developing personalized cancer immunotherapy.

Keywords: antigen; head and neck neoplasms; immune evation; immunologic techniques; lymphocytes; receptors; tumor-infiltrating.


Conflict of interest statement

Competing interests: None declared.

Figures

Figure 1
Figure 1
Heterogeneous immune responses in head and neck cancer. (A) Fomalin-fixed paraffin-embedded (FFPE) tumor sections from patients with head and neck cancer were stained with antibodies to CD8 (T cells), CD20 (B cells), pan-cytokeratin (tumor cells) and DAPI, followed by Opal fluorophores for multispectral immunofluorescence. Images were taken with Vectra3 microscope (20×) and fluorophores were unmixed using InForm software (Akoya Biosciences). Representative unmixed images of tumor invasive margin and tumor core from patient CUHN041 (poorly infiltrated) and CUHN024 (highly infiltrated) are shown. (B) Eighteen tumor samples from patients with HNSCC were stained as described above and grouped into ‘poorly infiltrated’, ‘moderately infiltrated’ or ‘highly infiltrated’ based on CD8 T cell infiltration into stroma and tumor compartments. (C, D) A223 squamous cell carcinomas (SCCs) were eliminated in ~20%–25% of recipients regardless of the number of tumor cells injected. (C) Tumors were orthotopically transplanted in the buccal (cheek) cavity of wild-type (WT) B6 mice at 4–7 weeks of age. (D) Left panel: 1 million cells injected, 3 out of 15 recipients rejected (2 independent experiments). Middle panel: 250 000 cells injected, 15 out of 51 recipients rejected (6 independent experiments). Right panel: 30 000 cells injected, 3 out of 13 recipients rejected (2 independent experiments). (E) A223 SCCs potentially harbor neoantigens. Whole-exome sequencing and RNA sequencing were performed on A223 SCCs to evaluate neoantigen load. Sequencing reads were mapped to the mouse reference genome (C57BL/6J) and variants were filtered for those that produced missense peptides. Peptides spanning each mutation were input into NetMHC4.0 for major histocompatibility complex (MHC) class I binding prediction (weak or strong) and those that bound were input into Immune Epitope Database (IEDB) for prediction of immunogenicity.
Figure 2
Figure 2
Tumor regression correlates to CD8 T cell-mediated antitumor immune response. A223 tumors were implanted into wild-type (WT) B6 mice and tumor volume was measured (mm3). Tumors were digested to single cell suspension and analyzed by flow cytometry. (A) Tumor volume inversely correlated with the percentage of CD8 tumor-infiltrating lymphocytes (TILs) within the single-cell gate (R2=0.6809) (n=34, across eight independent experiments). (B) CD8 TILs in growing tumors (right) express more programmed death-1 (PD-1) and LAG-3 than those in regressing tumors (left). Data are representative of eight independent experiments. (C) The percentage of CD8 TILs expressing interferon (IFN)-γ or both IFN-γ and tumor necrosis factor (TNF)-α is higher in regressing tumors (left) than growing tumors (right). TILs were stimulated ex vivo with phorbol 12-myristate 13-acetate (PMA) and ionomycin in the presence of brefeldin A (BFA). (D) The percentage of CD8 TILs expressing both IFN-γ and TNF-α inversely correlated best with tumor volume (mm3) (R2=0.8333) (n=12, across two independent experiments). (E) A higher percentage of CD8 TILs expressing T-bet in regressing tumors (left) than growing tumors (right). (F) The percentage of CD8 TILs expressing T-bet inversely correlated with tumor volume (R2=0.5555) (n=39, two independent experiments). (G) A higher level of Nur77 expression on CD8 TILs in regressing tumors (blue) than growing tumors (red). (H) Normalized Nur77 expression inversely correlated with tumor volume (R2=0.3305). Nur77 expression was normalized by dividing the geometric mean fluorescence intensity (MFI) of Nur77 expression on CD8 TILs with Nur77 MFI on splenic CD8 controls. (I) A higher percentage of CD8 TILs expressing Ly6A in regressing tumors (left) than growing tumors (right). (J) The percentage of CD8 TILs expressing Ly6A inversely correlated with tumor volume (R2=0.4196) (n=37, two independent experiments).
Figure 3
Figure 3
Tumor-extrinsic and tumor-intrinsic factors influencing heterogeneous growth pattern of A223. (A) CD8 T cells were required for tumor eradiation. A223 squamous cell carcinomas (SCCs) were orthotopically transplanted into the cheek of CD8α−/− recipient mice (n=19, across four independent experiments). (B–C) Regressors developed antitumor memory responses. Wild-type (WT) B6 mice were injected with A223 tumors (n=40, three independent experiments). (B) Left panel: 29 out of 40 mice were progressors (tumor growing out). Right panel: 11 out of 40 mice were regressors (tumor eliminated). Regressors were re-challenged with A223 and rejected tumors rapidly (n=9) (C). (D–F) A223 was subcloned into single colonies. Subclones were each tested by injection into WT B6 recipients. Growth from three independent subclones are shown—1C12 (n=19; two independent experiments) (D), 1H10 (n=19, two independent experiments) (E) and 1D4 (n=20, two independent experiments) (F). (G–J) Passaged A223 tumors still exhibited heterogeneous growth pattern regardless of the originator tumors. (G) Original tumor growth of each passage. A total of 250 000 A223 cells were injected into WT B6 mice. (H) Experimental scheme for passaging tumors. Two regressing and two growing tumors were removed from original mice, passaged in vitro and 250 000 cells were injected into the cheek of naïve WT B6 mice. (I) Tumor growth in WT B6 naïve mice that received a regressing passage (250 000 cells injected). Three out of 10 mice rejected tumors (two independent cohorts). (J) Tumor growth in naïve mice that received a growing passage (250 000 cells injected). Six out of 15 mice rejected tumors (two independent cohorts).
Figure 4
Figure 4
Top T-cell receptor (TCR) clonotypes and TCR specificity groups appear to be mutually exclusive between regressing and progressing tumor-infiltrating lymphocytes (TILs). (A) Left panel: tumor growth pattern of regressors (blue) and progressors (red) (n=3 for each group). A total of 250 000 A223 tumor cells were injected into wild-type (WT) B6 mice (n=6). Right panel: experimental scheme. Tumors were removed and CD8 T cells were isolated by sorting and subjected for single-cell 5’ RNA sequencing and TCR sequencing. (B) TCR clonotype distribution in eight sequenced samples including three splenic CD8, three regressor CD8 TIL and two progressor CD8 TIL samples. In each sample, cells containing the same TCR (one ‘clonotype’) are shown as a single pie slice representing the per cent of these cells in the entire sample. Clonotypes shared between samples are colored, where the yellow denotes the most shared clonotype (‘Shared Clonotype 1’). (C) Cells were grouped into clonotypes based on the paired amino acid (a.a.) sequences of their CDR3α and CDR3β regions. Top clonotypes are shown in a heatmap sorted by average abundance in progressors versus average abundance in regressors. (D) Heatmap of top 20 GLIPH groups identified in five TIL samples based on TCRβ CDR3 sequences. Groups are ordered based on their average per cent in regressor samples (RT1, RT2, RT3) versus average per cent in progressor samples (GT2, GT3). Only group 1 is present in all five TIL samples, whereas most groups occurred only in one sample. (E) Network plots of GLIPH groups 1–6. Each node represents a TCRβ CDR3 sequence, and each line represents a global (thick line) or local (thin line) similarity to another CDR3 sequence. Node sizes represent overall abundance in samples and nodes are colored based on the relative ratio between their per cent in growing samples (red) versus their per cent in regressing samples (blue). Relative ratio is calculated as (% in progressors)/(% in progressors+% in regressors). The shared clonotype’s node in group 1 is colored blue-purple and labeled with its CDR3 a.a. sequence.
Figure 5
Figure 5
Both regressor and progressor tumor-infiltrating lymphocytes (TILs) cluster into the same activation states. (A) Transcriptional data of >41 000 cells from nine samples (Grow1-TIL, Regr1-TIL, Grow2-TIL, Regr2-TIL, Regr2-Spln, Grow3-TIL, Regr3-TIL, Grow3-Spln, Regr2-Spln) were integrated using Seurat’s integration algorithm, and clustered using UMAP (see online supplemental table 1 for additional information on the nine samples). Cells are colored by sample type: regressor TILs (blue), progressor TILs (red) or splenic CD8 (gray). The same UMAP plot was shown as a plot containing three types of samples or three separate plots containing only one sample type. (B) Cells from nine samples are clustered together by UMAP as described in (A) and 13 functional clusters are colored based on gene expression. (C) Cluster abbreviations are shown to be referenced in other plots. (D) Cells from nine samples are clustered by UMAP as in (A). Cells are colored based on normalized expression for nine representative gene markers (gray=little to no expression; red=high expression). (E) Cells from nine samples are clustered by UMAP as in (A) and were analyzed using Monocle 3 Beta to plot a pseudo-time trajectory onto the UMAP, demonstrating a differentiation trajectory between naïve cells and highest activated (A6) cells. (F) Heatmap of the per cent of each sample residing in each cluster of the UMAP. Samples and cluster names of the heatmap were ordered by unsupervised clustering. (G) Representative genes upregulated in growing or regressing activated TILs (residing in one of the six activated clusters: A1–A6) versus naïve T cells (residing in N1–N3). Grow-Act, activated clusters in growing samples; Naïve, naïve clusters in all samples; Regr-Act, activated clusters in regressing samples. Groups were compared using one-way analysis of variance (ANOVA) (****p<0.0001).
Figure 6
Figure 6
Top T-cell receptor (TCR) clonotypes of progressor tumor-infiltrating lymphocyte (TIL) versus regressor TIL occupy different activation clusters. (A) Expanded clonotypes (>1% of a TIL sample) are shown as log10 of the per cent of the clonotype existing in each cluster of the UMAP. (B) Clusters that are differentially occupied by progressing and regressing clonotypes from (A) are quantified with dot plots with a black line indicating the mean. Progressor and regressor groups were compared using t-tests with Mann-Whitney U test correction for non-parametric data. *P<0.05; **p<0.01; ***p<0.001; ****p<0.0001. (C and D) All TCR clonotypes from Regr2 and Regr3 (C) or from Grow2 and Grow3 (D) with at least 50 cells are shown as bars, broken down into different colors representing the per cent of the clonotype in each cluster of the UMAP. (E) A graph summary of per cent in clusters for clonotypes in (C) and (D). Progressor group (red), regressor group (blue). Error bars indicate the SEM. Significance was calculated using two-way analysis of variance (ANOVA) with Sidak’s multiple comparison test (**p<0.01, ***p<0.001). (F) UMAP of CD8 T cells with shared TCR clonotypes. Three representative TCR clonotypes are shown. Cells with a given TCR clonotype are shown in red color for progressing TILs or blue for regressing TILs, over cells with all other TCR clonotypes from all samples (gray). (G) The per cent of each of the three shared clonotypes in each of the clusters (A1–D3). (H) A summary graph showing the per cent of the three shared clonotypes occupying each of the clusters (A1–D3). Clonotypes in regressor samples occupy A6 cluster more than their matched counterparts in progressor samples. Significance was calculated with two-way ANOVA with Sidak’s multiple comparisons test. **P<0.01.
Figure 7
Figure 7
Top T-cell receptor (TCR) clonotypes of progressor tumor-infiltrating lymphocyte (TIL) versus regressor TIL show differentially activated genes. All cells with a given clonotype above 1% of a progressor or regressor TIL sample were evaluated against all cells with clonotypes <1% of spleen samples (‘other’) using Seurat’s FindMarkers function. (A) Gene expression is shown by heatmap where values are the average of scaled expression for all cells of each clonotype. Genes were filtered for those differentially expressed in regressor and progressor clonotypes (≥0.4 difference between progressor fold change and regressor fold change). (B and C) Fold changes were calculated as the difference in expression between progressor top clonotypes and other clonotypes (‘progressor fold change’) or between regressor top clonotypes and other clonotypes (‘regressor fold change’) (≥0.6 difference between progressor fold change and regressor fold change). See online supplemental table 6 and online supplemental file 10 for full list of genes with fold changes and p values. Genes more upregulated in progressor clonotypes (B) or in regressor clonotypes (C). (D and E) Violin plots of select differentially expressed genes between regressor or progressor top TCR clonotypes and other clonotypes. The normalized gene expression for all cells in each category is shown. Black dots indicate the mean of each group. Genes more highly expressed in progressor top clonotypes (D) or in regressor top clonotypes (E). Groups were compared using one-way analysis of variance (ANOVA) (**p<0.01, ****p<0.0001). (F) HNSCC TCGA PanCancer RNA sequencing data were used to score patients for the expression of 30 genes found to be upregulated in regressor top clonotypes (right). Scores for the 30-Gene-Signature were calculated as the sum of normalized expression (patient expression/dataset median) for each of the 30 genes, and then patients were grouped into high-expression (having a score >the median score) or low-expression (having a score

Similar articles

Cited by

References

    1. Li J, Byrne KT, Yan F, et al. . Tumor cell-intrinsic factors underlie heterogeneity of immune cell infiltration and response to immunotherapy. Immunity 2018;49:178–93. 10.1016/j.immuni.2018.06.006 - DOI - PMC - PubMed
    1. Bose M, Mukherjee P. Role of microbiome in modulating immune responses in cancer. Mediators Inflamm 2019;2019:1–7. 10.1155/2019/4107917 - DOI - PMC - PubMed
    1. Fessler J, Matson V, Gajewski TF. Exploring the emerging role of the microbiome in cancer immunotherapy. J Immunother Cancer 2019;7:108. 10.1186/s40425-019-0574-4 - DOI - PMC - PubMed
    1. Bray F, Ferlay J, Soerjomataram I, et al. . Global cancer statistics 2018: GLOBOCAN estimates of incidence and mortality worldwide for 36 cancers in 185 countries. CA Cancer J Clin 2018;68:394–424. 10.3322/caac.21492 - DOI - PubMed
    1. Cramer JD, Burtness B, Le QT, et al. . The changing therapeutic landscape of head and neck cancer. Nat Rev Clin Oncol 2019;16:669–83. 10.1038/s41571-019-0227-z - DOI - PubMed

Publication types

MeSH terms

Substances