

Fitness maps to a large-effect locus in introduced stickleback populations
- PMID: 33414274
- PMCID: PMC7826376
- DOI: 10.1073/pnas.1914889118
Fitness maps to a large-effect locus in introduced stickleback populations
Abstract
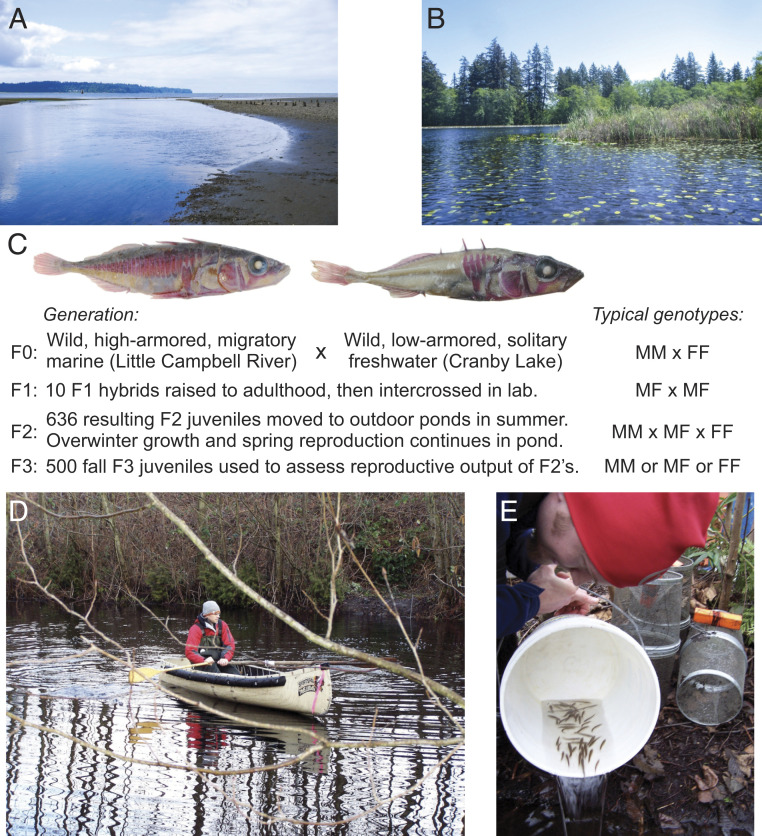
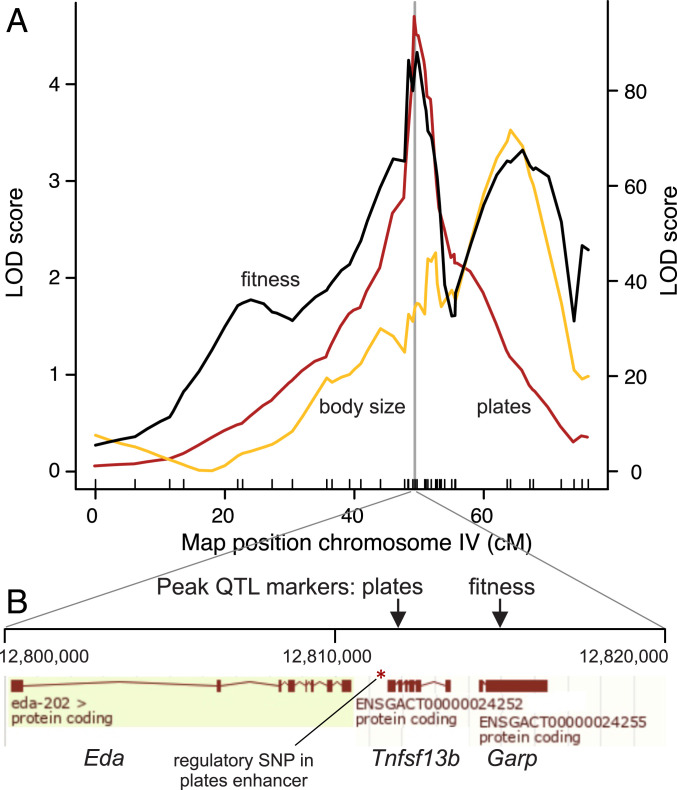
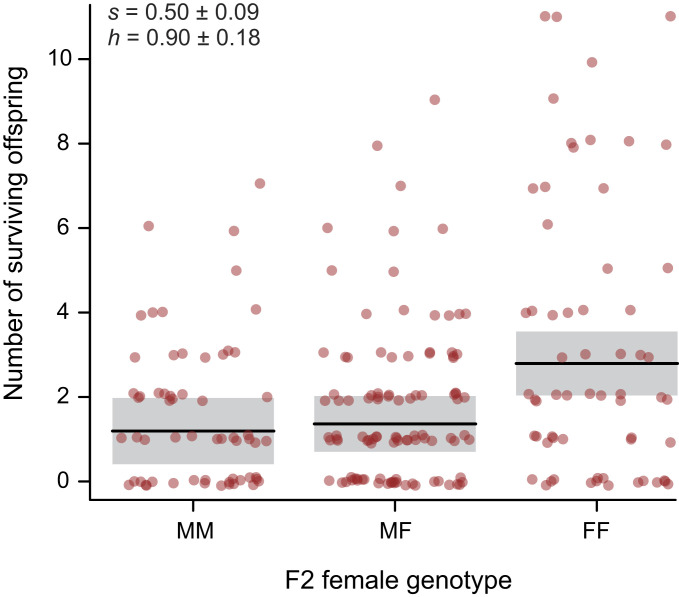
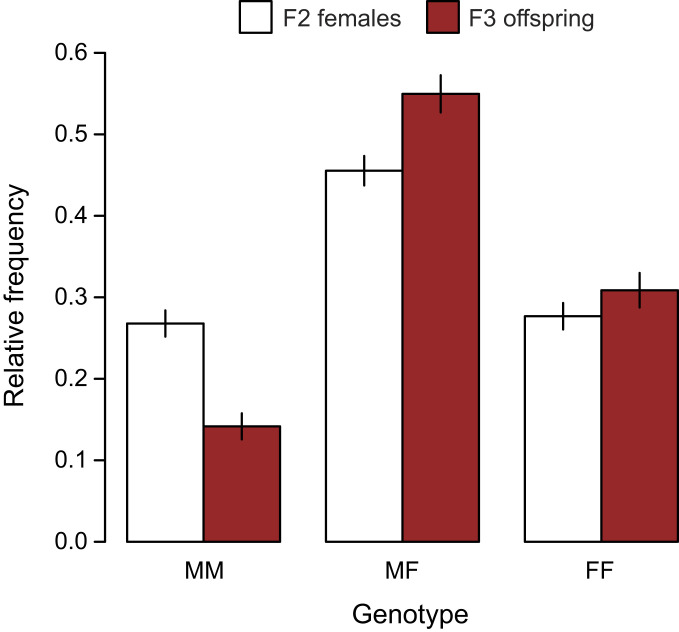
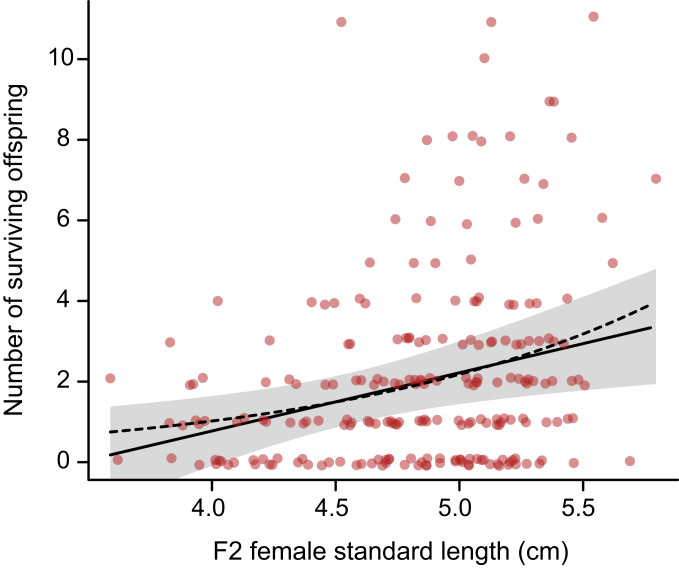
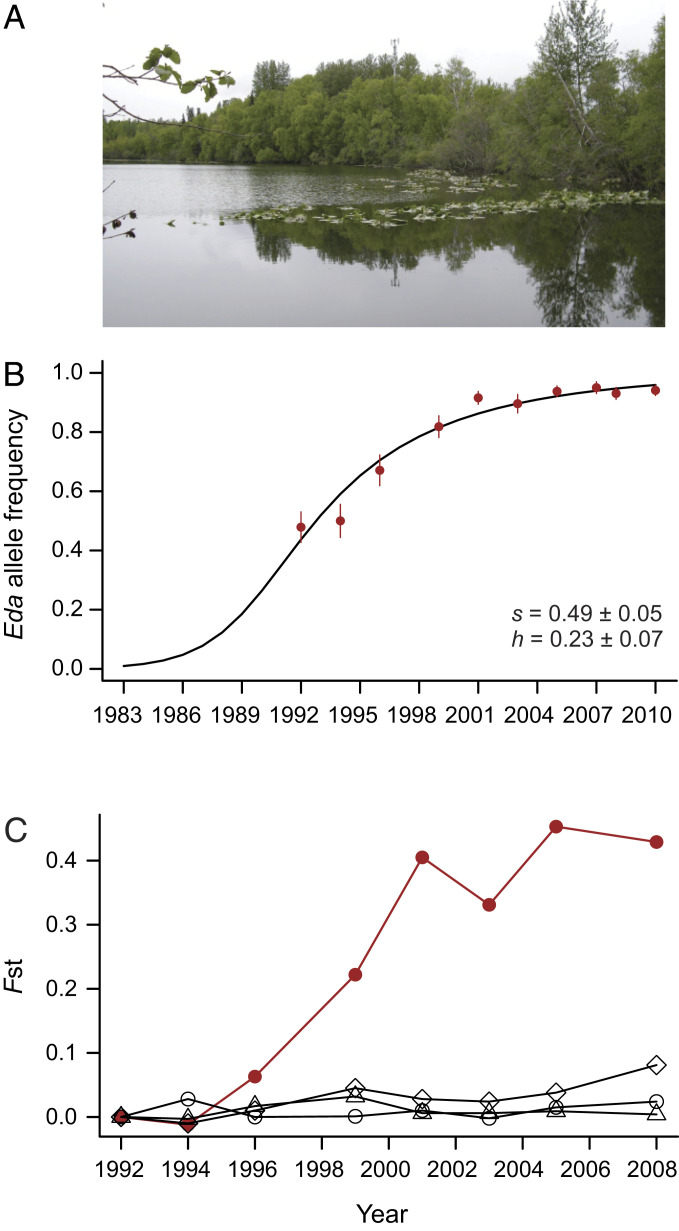
Mutations of small effect underlie most adaptation to new environments, but beneficial variants with large fitness effects are expected to contribute under certain conditions. Genes and genomic regions having large effects on phenotypic differences between populations are known from numerous taxa, but fitness effect sizes have rarely been estimated. We mapped fitness over a generation in an F2 intercross between a marine and a lake stickleback population introduced to a freshwater pond. A quantitative trait locus map of the number of surviving offspring per F2 female detected a single, large-effect locus near Ectodysplasin (Eda), a gene having an ancient freshwater allele causing reduced bony armor and other changes. F2 females homozygous for the freshwater allele had twice the number of surviving offspring as homozygotes for the marine allele, producing a large selection coefficient, s = 0.50 ± 0.09 SE. Correspondingly, the frequency of the freshwater allele increased from 0.50 in F2 mothers to 0.58 in surviving offspring. We compare these results to allele frequency changes at the Eda gene in an Alaskan lake population colonized by marine stickleback in the 1980s. The frequency of the freshwater Eda allele rose steadily over multiple generations and reached 95% within 20 y, yielding a similar estimate of selection, s = 0.49 ± 0.05, but a different degree of dominance. These findings are consistent with other studies suggesting strong selection on this gene (and/or linked genes) in fresh water. Selection on ancient genetic variants carried by colonizing ancestors is likely to increase the prevalence of large-effect fitness variants in adaptive evolution.
Keywords: Ectodysplasin; fitness mapping; genetics of adaptation; natural selection; stickleback.
Conflict of interest statement
The authors declare no competing interest.
Figures
Similar articles
-
Non-parallel divergence across freshwater and marine three-spined stickleback Gasterosteus aculeatus populations.J Fish Biol. 2017 Jul;91(1):175-194. doi: 10.1111/jfb.13336. Epub 2017 May 17. J Fish Biol. 2017. PMID: 28516498
-
Contemporary ancestor? Adaptive divergence from standing genetic variation in Pacific marine threespine stickleback.BMC Evol Biol. 2018 Jul 18;18(1):113. doi: 10.1186/s12862-018-1228-8. BMC Evol Biol. 2018. PMID: 30021523 Free PMC article.
-
A gene with major phenotypic effects as a target for selection vs. homogenizing gene flow.Mol Ecol. 2014 Jan;23(1):162-81. doi: 10.1111/mec.12582. Epub 2013 Nov 28. Mol Ecol. 2014. PMID: 24192132
-
Adaptive evolution of lateral plates in three-spined stickleback Gasterosteus aculeatus: a case study in functional analysis of natural variation.J Fish Biol. 2010 Aug;77(2):311-28. doi: 10.1111/j.1095-8649.2010.02640.x. J Fish Biol. 2010. PMID: 20646158 Review.
-
Genetics and ecological speciation.Proc Natl Acad Sci U S A. 2009 Jun 16;106 Suppl 1(Suppl 1):9955-62. doi: 10.1073/pnas.0901264106. Epub 2009 Jun 15. Proc Natl Acad Sci U S A. 2009. PMID: 19528639 Free PMC article. Review.
Cited by
-
Predicting future from past: The genomic basis of recurrent and rapid stickleback evolution.Sci Adv. 2021 Jun 18;7(25):eabg5285. doi: 10.1126/sciadv.abg5285. Print 2021 Jun. Sci Adv. 2021. PMID: 34144992 Free PMC article.
-
Genome sequence of a marine threespine stickleback (Gasterosteus aculeatus) from Rabbit Slough in the Cook Inlet.G3 (Bethesda). 2025 Jul 9;15(7):jkaf114. doi: 10.1093/g3journal/jkaf114. G3 (Bethesda). 2025. PMID: 40408318 Free PMC article.
-
A Single Nucleotide Variant in the PPARγ-homolog Eip75B Affects Fecundity in Drosophila.Mol Biol Evol. 2023 Feb 3;40(2):msad018. doi: 10.1093/molbev/msad018. Mol Biol Evol. 2023. PMID: 36703226 Free PMC article.
-
Hybridization alters the shape of the genotypic fitness landscape, increasing access to novel fitness peaks during adaptive radiation.Elife. 2022 May 26;11:e72905. doi: 10.7554/eLife.72905. Elife. 2022. PMID: 35616528 Free PMC article.
-
The phoenix hypothesis of speciation.Proc Biol Sci. 2022 Nov 30;289(1987):20221186. doi: 10.1098/rspb.2022.1186. Epub 2022 Nov 16. Proc Biol Sci. 2022. PMID: 36382528 Free PMC article.
References
-
- Orr H. A., Coyne J. A., The genetics of adaptation: A reassessment. Am. Nat. 140, 725–742 (1992). - PubMed
-
- Orr H. A., The genetic theory of adaptation: A brief history. Nat. Rev. Genet. 6, 119–127 (2005). - PubMed
-
- Shapiro M. D., et al. , Genetic and developmental basis of evolutionary pelvic reduction in threespine sticklebacks. Nature 428, 717–723 (2004). - PubMed
Publication types
MeSH terms
Associated data
Grants and funding
LinkOut - more resources
Full Text Sources
Other Literature Sources
Miscellaneous
