. 2021 Jan 19;118(3):e2009493118.
doi: 10.1073/pnas.2009493118.

Drebrin regulates cytoskeleton dynamics in migrating neurons through interaction with CXCR4

Affiliations

Drebrin regulates cytoskeleton dynamics in migrating neurons through interaction with CXCR4

Yufei Shan et al. Proc Natl Acad Sci U S A. .

Abstract

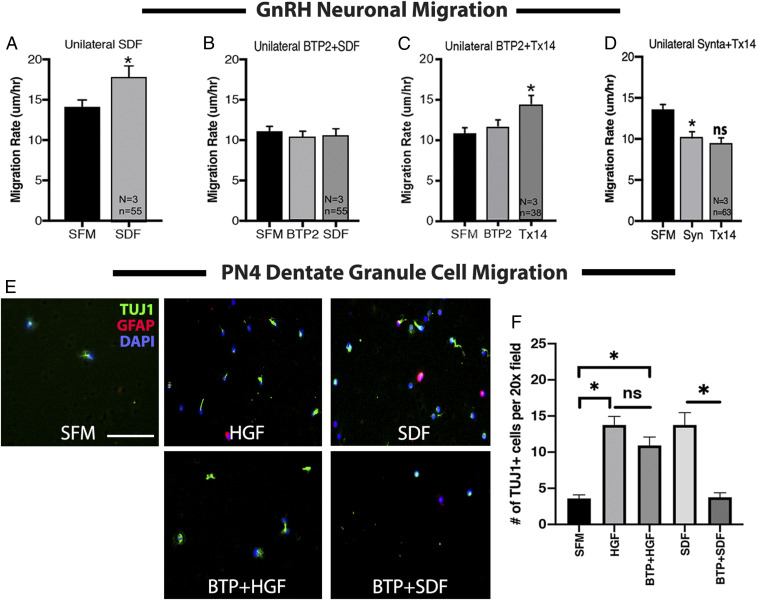
Stromal cell-derived factor-1 (SDF-1) and chemokine receptor type 4 (CXCR4) are regulators of neuronal migration (e.g., GnRH neurons, cortical neurons, and hippocampal granule cells). However, how SDF-1/CXCR4 alters cytoskeletal components remains unclear. Developmentally regulated brain protein (drebrin) stabilizes actin polymerization, interacts with microtubule plus ends, and has been proposed to directly interact with CXCR4 in T cells. The current study examined, in mice, whether CXCR4 under SDF-1 stimulation interacts with drebrin to facilitate neuronal migration. Bioinformatic prediction of protein-protein interaction highlighted binding sites between drebrin and crystallized CXCR4. In migrating GnRH neurons, drebrin, CXCR4, and the microtubule plus-end binding protein EB1 were localized close to the cell membrane. Coimmunoprecipitation (co-IP) confirmed a direct interaction between drebrin and CXCR4 using wild-type E14.5 whole head and a GnRH cell line. Analysis of drebrin knockout (DBN1 KO) mice showed delayed migration of GnRH cells into the brain. A decrease in hippocampal granule cells was also detected, and co-IP confirmed a direct interaction between drebrin and CXCR4 in PN4 hippocampi. Migration assays on primary neurons established that inhibiting drebrin (either pharmacologically or using cells from DBN1 KO mice) prevented the effects of SDF-1 on neuronal movement. Bioinformatic prediction then identified binding sites between drebrin and the microtubule plus end protein, EB1, and super-resolution microscopy revealed decreased EB1 and drebrin coexpression after drebrin inhibition. Together, these data show a mechanism by which a chemokine, via a membrane receptor, communicates with the intracellular cytoskeleton in migrating neurons during central nervous system development.

Keywords: CXCR4; GnRH; drebrin; hippocampus; neuronal migration.


Conflict of interest statement

The authors declare no competing interest.

Figures

Fig. 1.
Fig. 1.
Drebrin and CXCR4 physically interacted in migrating GnRH neurons. (A) Intracellular docking between crystallized CXCR4 (Protein Data Bank: 3ODU) and drebrin N-terminal domains. Low magnification (Left) and higher magnification (Right) shown of four possible interacting domains: 1) CXCR4’s ICL1 (K68/R70) bound to drebrin’s CC (R215/E202), 2) CXCR4’s ICL2 (Q145/R148) bound to drebrin’s CC (L204/D201), 3) CXCR4’s ICL3 (K239) bound to drebrin’s ADFH (D92), and 4) hydrophobic coat created by drebrin’s ADFH and Hel domains (residues 112 to 119 and 283 to 291) that wraps around CXCR4’s C-terminal tail. (B) Representative pull-down experiments using anti-drebrin (IP: drebrin) or anti-CXCR4 (IP: CXCR4) from E14.5 mouse whole head. IP: immunoprecipitation target, IB: immunoblotting target, WL: whole lysate, FT: flow through. Visible CXCR4 (IB: CXCR4, 60 kDa) and drebrin (IB: drebrin, 125 kDa) bands were detected in pull-down (PD) lanes. (C) Migrating GnRH neurons detected in E12.5 mouse embryo. High-magnification GnRH-positive neurons are shown (Inset). FB: forebrain, OE: olfactory epithelium, VNO: vomeronasal organ. (Scale bar, 100 µm.) (D) Confocal immunofluorescent staining of drebrin (red) and CXCR4 (green) localized in migrating GnRH neurons (blue, asterisks) in vivo at E12.5. Colocalization was detected at cytoplasmic membrane region as well as leading processes (white and yellow arrow heads). (E) Drebrin (red) and EB1 (green) colocalization detected in GnRH neurons (blue, asterisks) at both somatic membrane and leading processes (white and yellow arrow heads). Merged images in the fourth panels of D and E show colocalized puncta (yellow arrows) in a single z-plane. (Scale bars in D and E, 10 µm.)
Fig. 2.
Fig. 2.
Lack of drebrin-delayed GnRH neuronal migration and decreased DG granule cells. (A) Significantly fewer GnRH cells were observed in DBN1 KO animals at E12.5 (n = 3 WT and 3 KO; *P = 0.0481, unpaired t test). The distribution of GnRH cells plotted at ages E12.5, PN4, and adulthood is shown. χ2 analysis of the distribution of GnRH cells at each age revealed a significant difference between WT and KO mice (*P < 0.0001 for each age). At E12.5, DBN1 KO mice had less GnRH cells than WT controls at the NFJ (*P = 0.0409, unpaired t test), accounting for the overall decrease detected in the total GnRH cell number. No differences were detected in either the nasal region or brain, consistent with a delay in GnRH cell development. In both PN4 and adult mice, DBN1 KO had more GnRH cells rostral to the OVLT as compared to controls (PN4, *P = 0.0173; adult, *P = 0.0216; unpaired t test), consistent with an overall delay in migration that cannot compensate with time. NFJ: nasal forebrain junction, B: brain, R/O: rostral to OVLT, C/O: caudal to OVLT. (B) WT (Left) and KO (Right) PN4 hippocampi were stained for NeuN and GFAP. The intensity of NeuN and GFAP was plotted and compared between genotypes (n = 3, unpaired t test). A significant decrease was found in cells stained for NeuN, while a significant increase was detected in overall GFAP staining. (C) Immunocytochemistry revealed colocalization of drebrin (red) and CXCR4 (green) in a migrating hippocampal granule cell at PN4 (white arrow, asterisks). Hil: hillius, GCL: granule cell layer, ML: molecular layer. (Scale bar, 10 µm.) (D) Drebrin immunoprecipitation from PN4 hippocampal protein sample detected CXCR4 bands in pull-down product. Drebrin immunopositive bands are shown at 125 kDa. GAPDH was used for negative control, and no band was detected in the PD lane. IP: immunoprecipitation target, IB: immunoblotting target, WL: whole lysate, FT: flow through, PD: pull-down.
Fig. 3.
Fig. 3.
Primary neurons from DBN1 KO mice do not respond to SDF-1 stimulation. (AC) Immunocytochemistry on primary GnRH neurons (blue) maintained in explants showed coexpression of drebrin (red) and CXCR4 (green) and drebrin (red) and EB1 (green). Expression was seen in the leading process (arrow heads) and soma (arrows) of migrating GnRH neurons. Merged images in the third panel of A and C show colocalized puncta (arrow heads) in a single z-plane. (DG) Histogram shows primary GnRH neurons derived from DBN1 KO mice migrate slower than WT littermates in bilateral condition, when explants contain endogenous SDF-1 (D and F, N = 4, *P < 0.0001 unpaired t test). However, the WT/KO difference was eliminated in unilateral explants with lower amounts of endogenous SDF-1, and exogenous SDF-1 rescue was not detected in GnRH cells from KO mice (E and G for WT/KO, N = 4, P = 0.16, unpaired t test; for WT/WT-SDF and KO/KO-SDF, paired t test, N = 4; WT n = 49, *P < 0.0001; KO n = 50, P = 0.8075). Black bars in F and G indicate linear migration distances from 0′ to 60’. The asterisks indicate the location of the cell nuclei. (HJ) Optical density analysis of immunofluorescence in the leading process of GnRH neurons (dotted lines in H and I) showed reduced CXCR4 expression (green) in cells from DBN1 KO mice compared to cells from WT controls. The insets in H and I show a lower magnification, merged image of cells in double labeled for GnRH (yellow) and CXCR4 (green). (K and L) Modified Boyden chamber assays showed that DG granule cells obtained from DBN1 KO mice respond to HGF but do not respond to SDF. Representative images of each group are shown in K (TUJ1, green; GFAP, red; Dapi, blue). Data are shown in histograms (L) (unpaired t test, N = 3 [pairs of litters], n = 4 [20× fields per treatment group/genotype], *P < 0.05, ns, not significant). (Scale bars, [AC] 10 µm and [K] 50 µm.)
Fig. 4.
Fig. 4.
Pharmacological blockade of drebrin attenuated GnRH migration in bilateral explants with endogenous SDF-1. (A) In bilateral explants, the drebrin inhibitor BTP2 decreased GnRH migration rate (N = 4, n = 95, *P < 0.0001, paired t test). (B) BTP2 decreased GnRH migration rate after treatment with the CRAC channel–specific blocker Synta66 (Syn) application (N = 3, n = 53, *P < 0.0001, #P = 0.0093, paired t test). (C and D) BTP2 application did not block the increase in migration rate associated with blockade of GABAAR via PIC (17) or GPR37 activation via TX-14 (38). (C) N = 3, n = 64, *P < 0.0001, #P = 0.0114; (D) N = 3, n = 35, *P = 0.0453, #P = 0.0070, paired t test. (E) Immunocytochemistry showed that in both BTP2-treated and control explants, drebrin (red) is expressed in a similar pattern in the GnRH cell soma and leading process, being found along the cortical actin. However, in BTP2-treated explants, GnRH neurons showed attenuated CXCR4 expression (green, black arrows) in the leading processes compared to cells in control explants (white arrow heads). (Scale bar, 10 µm.)
Fig. 5.
Fig. 5.
Specificity of drebrin/CXCR4 interaction. (A and B) Histograms show that pretreatment of BTP2 (B) eliminated the increase in migration rate associated with exogenous application of SDF-1 (A, N = 3, n = 55, *P = 0.0119; B, N = 3, n = 55, P = 0.9445 [BTP2 to SFM], P = 0.8782 [SDF-1 to BTP2], paired t test). (C) BTP2 application did not block the increase in migration rate associated with activation of GPR37 via TX-14 (N = 3, n = 38, *P = 0.0041, paired t test). (D) In contrast, the CRAC channel blocker, Synta66 (Syn), decreased the GnRH migration rate (*P = 0.0001) and blocked the increase in migration rate normally associated with activation of GPR37 via TX-14 (N = 3, n = 63, P = 0.3973, paired t test). (E and F) Comparison of DG granule cell response to HGF or SDF in the presence of BTP. DG granule cells showed an increase in migration to both HGF and SDF (E, Top). BTP treatment blocked the chemokine effect of SDF but had no effect on granule cells exposed to HGF (E, Bottom). Representative images of each group are shown in E (TUJ1, green; GFAP, red; DAPI, blue). Data are shown in histogram (F) (unpaired t test, N = 3 [pairs of litters], n = 4 [20× fields per treatment group/genotype], *P < 0.05, ns, not significant). (Scale bar in E, 50 µm.)
Fig. 6.
Fig. 6.
Drebrin/EB1 interaction in migrating neurons. (A) Bioinformatic modeling revealed EB1’s posthelix extension latches onto a hydrophobic pit created between drebrin PP and BB domains (residues 404 to 424). (B and C) BTP treatment decreased DB/EB1 puncta in GnRH cells. Representative STED microscopy images show drebrin (red) and EB1 (green) colocalized in puncta (white arrows) in the leading processes of a GnRH neuron (blue). Higher magnification of boxed images (Left) are shown in the right panel. (Scale, 10 µm.) (C) Quantification of drebrin/EB1 colocalized puncta in GnRH cells in control and BTP2-treated explants. Significantly less puncta per micrometer were detected in cells from the BTP2-treated group (N = 3, n = 10, *P < 0.05, unpaired t test). (D) Either inhibition of CXCR4 receptor or knockout of drebrin results in decreased EB1 puncta in migrating GnRH neurons. High magnification of representative STED microscopy shows the interactive puncta (white arrows) between drebrin (red) and EB1 (green) in the leading processes of control and AMD3100-treated GnRH neurons (Left) and puncta (white arrows) between actin (magenta) and EB1 (green) in GnRH neurons from WT and DBN1 KO mice (Right). (E) Quantification of drebrin/EB1 and actin/EB1 in GnRH cells. Less puncta per micrometer were seen in the AMD3100-treated group (unpaired t test, N = 3, n = 9, *P < 0.05). A similar trend was observed in the DBN1 KO actin/EB1 puncta compared to the WT control group (N = 2, n = 4).
Fig. 7.
Fig. 7.
Schematic diagram of the interaction between CXCR4, drebrin, actin, EB1, and microtubules during SDF-1–induced neuronal migration. Upon SDF-1 binding to CXCR4, the G protein complex is released from the C terminus of CXCR4, exposing drebrin binding sites. CXCR4 then binds with this actin-binding protein, which guides the insertion of microtubule plus-ends into cortical actin via the microtubule plus-end–binding protein EB1. This process then initiates nucleokinesis and subsequently neuronal movement. Inhibition of drebrin (via BTP2) prevents SDF-1 signaling via this pathway and results in slower cell movement. Pharmacological manipulations used in this study are listed in the diagram for reference.

Similar articles

Cited by

References

    1. Rakic P., Principles of neural cell migration. Experientia 46, 882–891 (1990). - PubMed
    1. Ma Q., et al. , Impaired B-lymphopoiesis, myelopoiesis, and derailed cerebellar neuron migration in CXCR4- and SDF-1-deficient mice. Proc. Natl. Acad. Sci. U.S.A. 95, 9448–9453 (1998). - PMC - PubMed
    1. Zou Y. R., Kottmann A. H., Kuroda M., Taniuchi I., Littman D. R., Function of the chemokine receptor CXCR4 in haematopoiesis and in cerebellar development. Nature 393, 595–599 (1998). - PubMed
    1. Stumm R. K., et al. , CXCR4 regulates interneuron migration in the developing neocortex. J. Neurosci. 23, 5123–5130 (2003). - PMC - PubMed
    1. Wray S., Development of gonadotropin-releasing hormone-1 neurons. Front. Neuroendocrinol. 23, 292–316 (2002). - PubMed

Publication types

LinkOut - more resources