. 2021 Jan 26;118(4):e2019617118.
doi: 10.1073/pnas.2019617118.

Retrospective analysis of the Italian exit strategy from COVID-19 lockdown

Affiliations

Retrospective analysis of the Italian exit strategy from COVID-19 lockdown

Valentina Marziano et al. Proc Natl Acad Sci U S A. .

Abstract

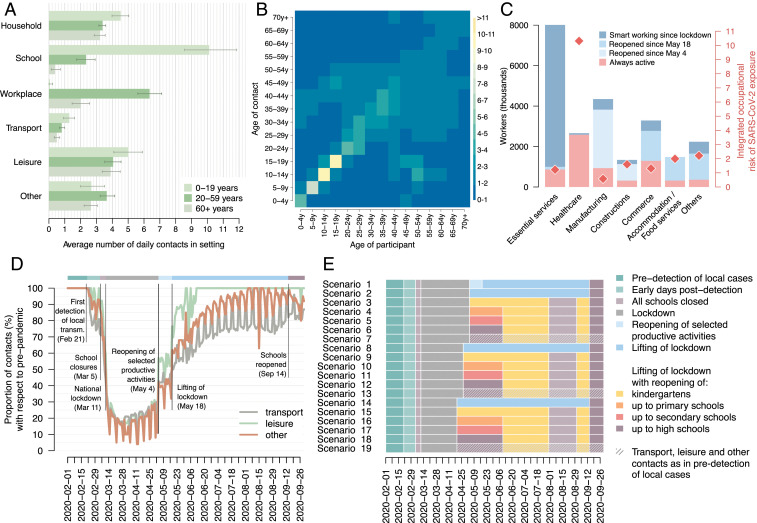
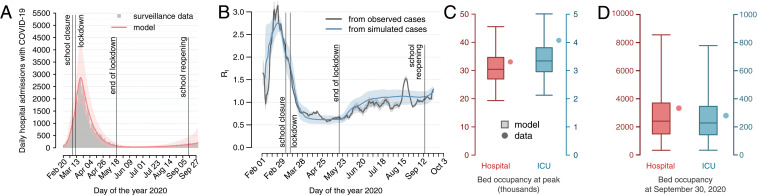
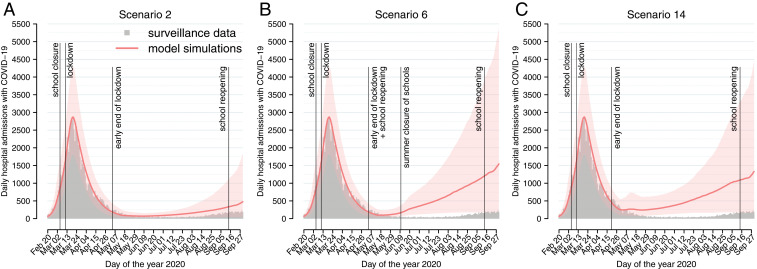
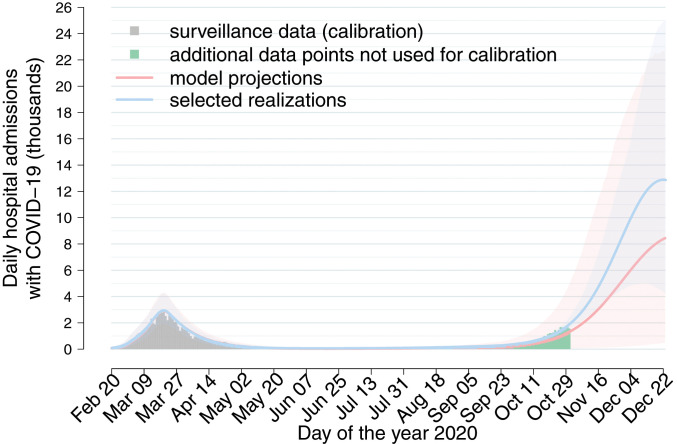
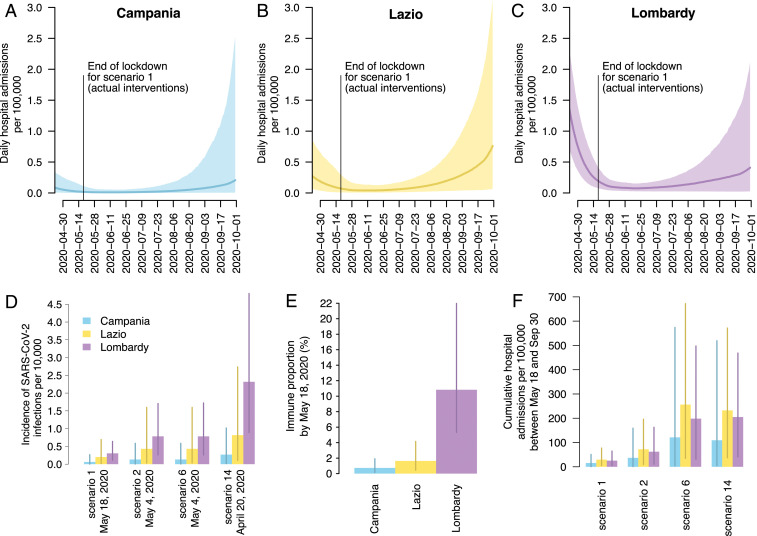
After the national lockdown imposed on March 11, 2020, the Italian government has gradually resumed the suspended economic and social activities since May 4, while maintaining the closure of schools until September 14. We use a model of severe acute respiratory syndrome coronavirus 2 (SARS-CoV-2) transmission to estimate the health impact of different exit strategies. The strategy adopted in Italy kept the reproduction number Rt at values close to one until the end of September, with marginal regional differences. Based on the estimated postlockdown transmissibility, reopening of workplaces in selected industrial activities might have had a minor impact on the transmissibility. Reopening educational levels in May up to secondary schools might have influenced SARS-CoV-2 transmissibility only marginally; however, including high schools might have resulted in a marked increase of the disease burden. Earlier reopening would have resulted in disproportionately higher hospitalization incidence. Given community contacts in September, we project a large second wave associated with school reopening in the fall.

Keywords: SARS-CoV-2; mathematical modeling; reopening scenarios.


Conflict of interest statement

Competing interest statement: M.A. has received research funding from Seqirus. The funding is not related to COVID-19. All other authors declare no competing interest.

Figures

Fig. 1.
Fig. 1.
(A) Mean number (bars) and 95% CI (lines) of daily contacts by type of contact aggregated over three age groups (0 to 19, 20 to 59, and 60+ y old) as estimated from the analysis of the contact diaries collected in 2007 for the Italian population by the POLYMOD study (17). (B) Heat map of the overall contact matrix representing the mean daily number of contacts that an individual of a given age group has with other individuals, stratified by age group, used in the model to represent contact rates in the predetection epidemic phase. The color of each cell represents the mean total number of daily contacts (scale on the right). The contact matrix shown here is the mean of 300 bootstrapped contact matrices as obtained by the analysis of the contact diaries collected in 2007 for the Italian population by the POLYMOD study (17) (SI Appendix). (C) Workforce involved in different employment sectors who were physically present at work throughout the lockdown, worked from home since the lockdown, or were suspended and then reopened at different times (data from ref. 31); red diamonds represent the integrated occupational risk of exposure to SARS-CoV-2 in each sector (data from ref. ; scale on the right y axis). (D) Proportion of contacts over time with respect to the preepidemic period in transportation means, leisure venues, and other generic settings, derived from refs. , (SI Appendix). Main events and national government decisions for control of the COVID-19 epidemic are indicated. (E) Schematic representation of the timeline of different phases considered in the actual interventions (scenario 1) and in 18 counterfactual scenarios.
Fig. 2.
Fig. 2.
(A) Daily hospitalizations with COVID-19 over time in Italy, according to surveillance data (10) (gray bars) and as estimated by the baseline model, scenario 1 (solid line, median; shaded area, 95% CI). (B) Comparison of estimates of the net reproduction number Rt, averaged over a weekly moving window, obtained from the daily number of symptomatic cases by date of symptom onset from surveillance data (10) (black solid line, median; shaded areas, 95% CI) and from estimates of the baseline model, scenario 1 (blue solid line, median; shaded areas, 95% CI). (C) Peak hospital and ICU bed occupancy by patients with COVID-19 according to official data (11) (dots) and corresponding baseline model estimates (boxplots: median, interquartile ranges, and 95% CI). (D) Hospital and ICU bed occupancy by patients with COVID-19 on September 30, according to official data (11) (dots) and corresponding baseline model estimates (boxplots: median, interquartile ranges, and 95% CI).
Fig. 3.
Fig. 3.
Daily hospitalizations with COVID-19 over time in Italy, according to surveillance data (10) (gray bars) and as estimated in (A) scenario 2 (end of lockdown anticipated to May 4), (B) scenario 6 (end of lockdown anticipated to May 4 + reopening of all educational levels), and (C) scenario 14 (end of lockdown anticipated to April 20). Solid line, median; shaded area, 95% CI.
Fig. 4.
Fig. 4.
Daily hospitalizations with COVID-19 (thousands) over time in Italy, according to surveillance data (10) (gray bars, used for calibration; green bars, additional data points) and as projected under the assumption that the reopening of all educational levels and community contacts are maintained unchanged until December 23, without further control interventions. Red indicates projections from 10,000 model realizations; blue indicates the subset of 1,000 simulations with highest Poisson likelihood over hospital admissions occurring between September 15 and October 31. Solid line, median; shaded area, 95% CI.
Fig. 5.
Fig. 5.
Subnational analysis for Campania, Lazio, and Lombardy. (AC). Model estimated daily hospital admissions per 100,000 individuals under scenario 1 (actual interventions) after the lifting of lockdown in the three regions (solid lines, median; shaded area, 95% CI). (D) Model estimated incidence of infection per 10,000 individuals at the date of lifting of lockdown for selected scenarios (mean and 95% CI). (E) Estimated proportion of immune individuals on May 18 (mean and 95% CI). (F) Model estimated cumulative hospital admissions per 100,000 individuals under selected scenarios (mean and 95% CI).

References

    1. World Health Organization , WHO Director-General’s opening remarks at the media briefing on COVID-19. https://www.who.int/dg/speeches/detail/who-director-general-s-opening-re.... Accessed 1 December 2020.
    1. International Monetary Fund , Policy responses to COVID-19. https://www.imf.org/en/Topics/imf-and-covid19/Policy-Responses-to-COVID-19. Accessed 1 December 2020.
    1. Decree of the Prime Minister , Ulteriori disposizioni attuative del decreto-legge 23 febbraio 2020, n. 6, recante misure urgenti in materia di contenimento e gestione dell’emergenza epidemiologica da COVID-19, applicabili sull’intero territorio nazionale. https://www.trovanorme.salute.gov.it/norme/dettaglioAtto?id=73643. Accessed 1 December 2020.
    1. Zhang J., et al. , Evolving epidemiology and transmission dynamics of coronavirus disease 2019 outside Hubei province, China: A descriptive and modelling study. Lancet Infect. Dis. 20, 793–802 (2020). - PMC - PubMed
    1. Pan A., et al. , Association of public health interventions with the epidemiology of the COVID-19 outbreak in Wuhan. JAMA 323, 1915−1923 (2020). - PMC - PubMed

Publication types

LinkOut - more resources