

CD36 deficiency affects depressive-like behaviors possibly by modifying gut microbiota and the inflammasome pathway in mice
- PMID: 33414380
- PMCID: PMC7791141
- DOI: 10.1038/s41398-020-01130-8
CD36 deficiency affects depressive-like behaviors possibly by modifying gut microbiota and the inflammasome pathway in mice
Abstract
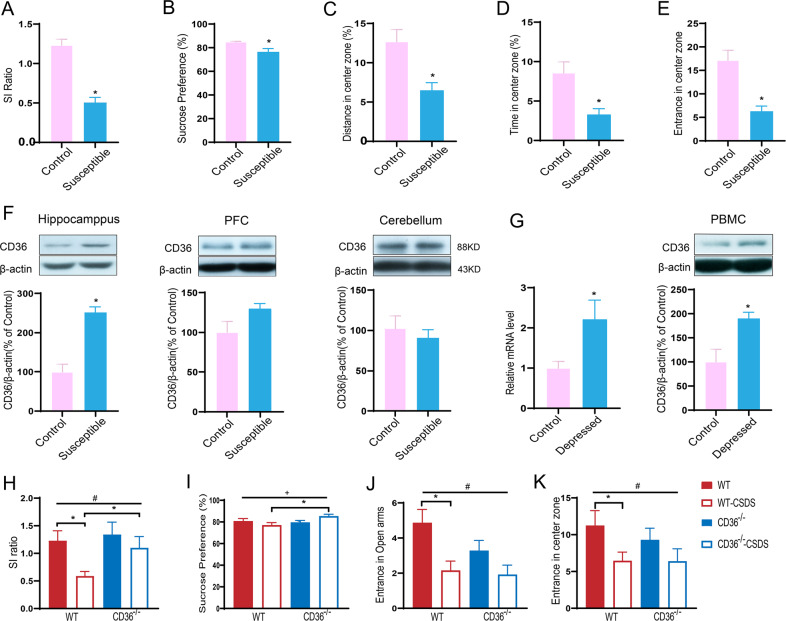
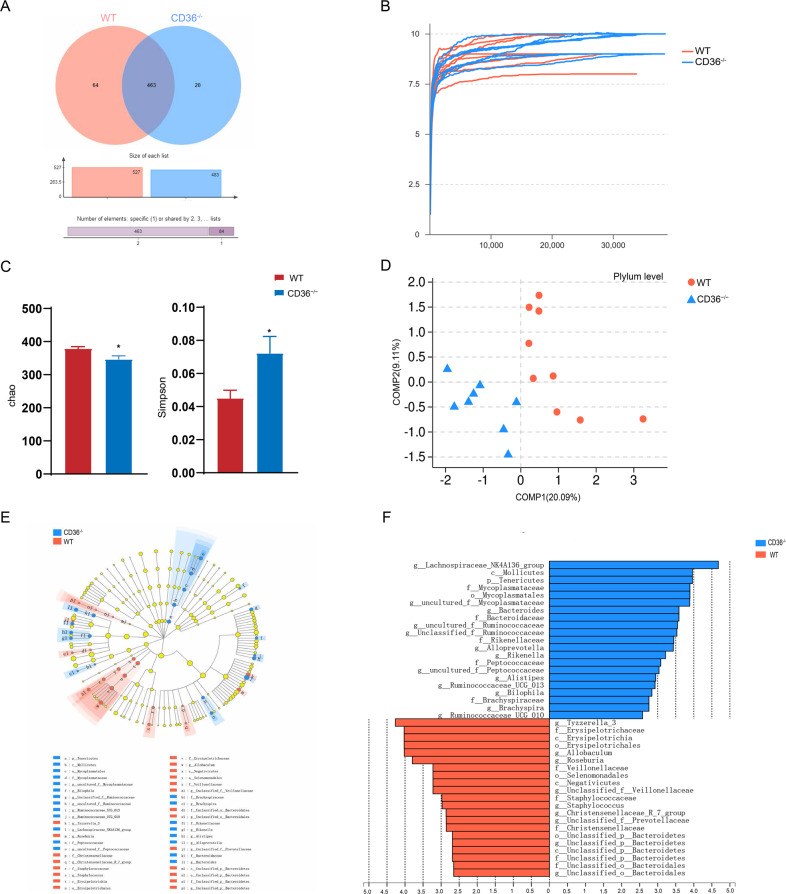
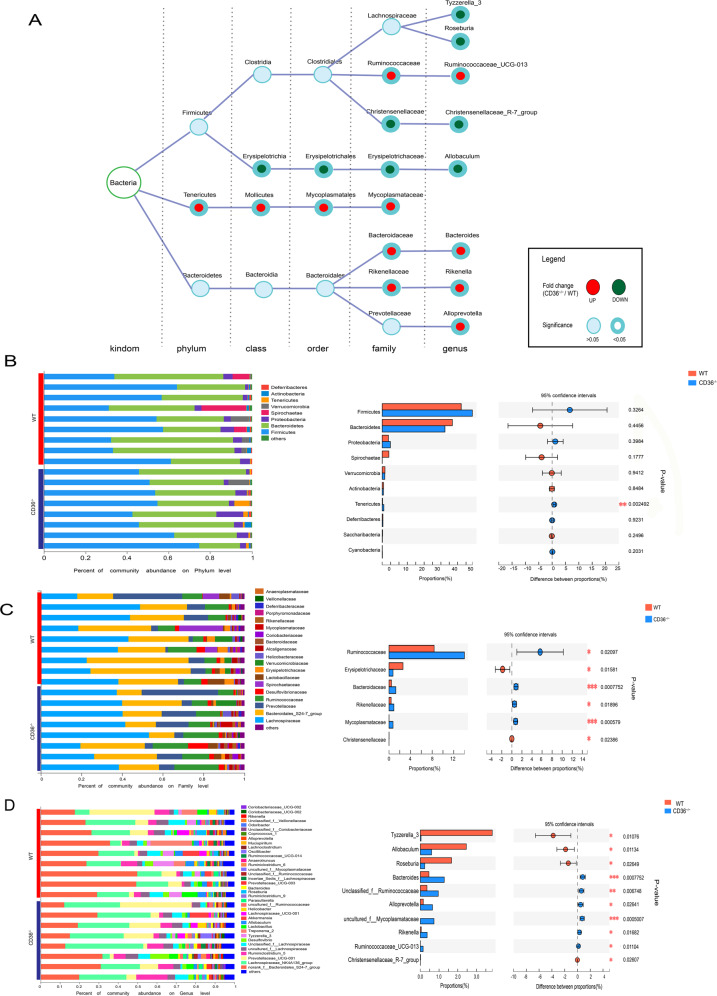
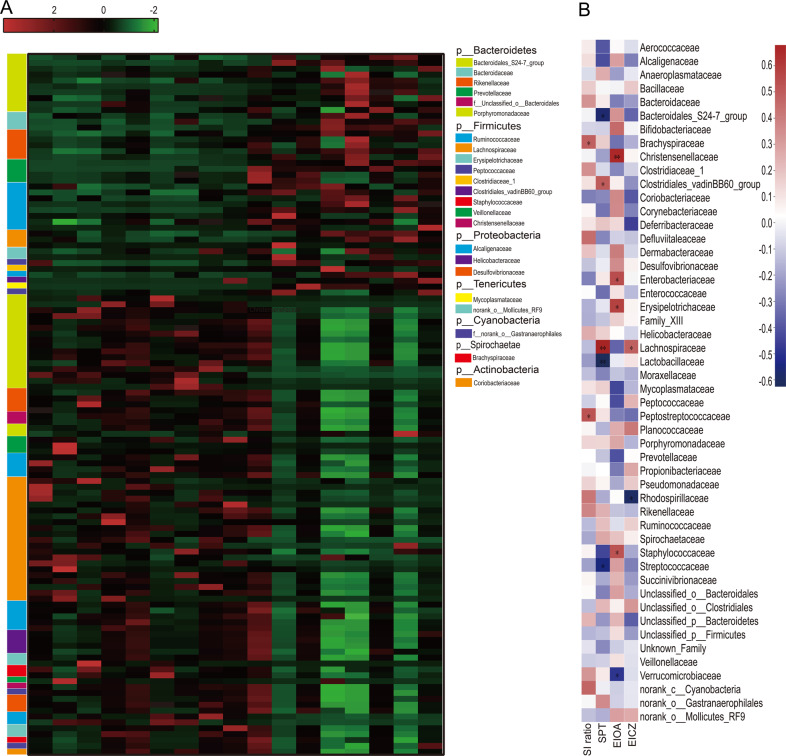
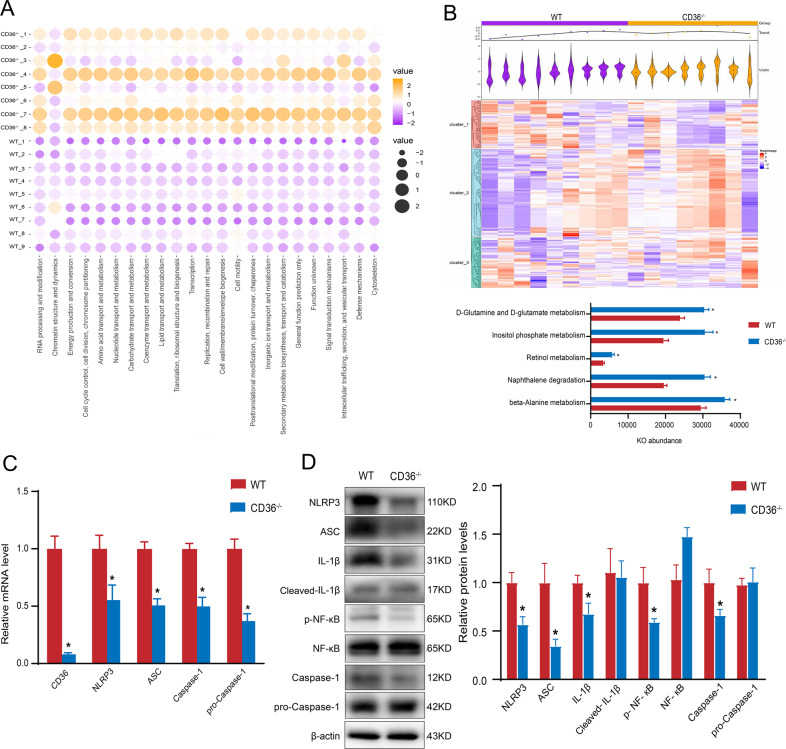
Both inflammatory processes and gut microbiota have been implicated in the pathophysiology of depressive disorders. The class B scavenger receptor CD36 is involved in the cytotoxicity associated with inflammation. However, its role in depression has not yet been examined. In this study, we investigated whether CD36 affects depression by modulating the microbiota-gut-inflammasome-brain axis. We used CD36-/- (knockout) mice subjected to chronic social defeat stress, and measured the expression of CD36 in these depressed mice and in patients with depression. The hippocampus of CD36-/- mice was used to investigate changes in the NLRP3 inflammasome signaling pathway. The 16S rRNA gene sequence-based approach was used to compare the cecal microbial communities in CD36-/- and WT mice. The CD36 deficiency in CD36-/- mice alleviated chronic stress-induced depression-like behaviors. CD36 was upregulated in depressed mice as well as in depressed patients. Furthermore, the NLRP3 inflammasome signaling pathway was downregulated in the hippocampus of CD36-/- mice. The Simpson Diversity Index revealed increased cecal bacterial alpha-diversity in the CD36-/- mice. Among genera, Bacteroides, Rikenella, and Alloprevotella were significantly more abundant in the CD36-/- mice, whereas Allobaculum was less abundant, consistent with the attenuated inflammation in the hippocampus of CD36-/- mice. Our findings suggest that CD36 deficiency changes the gut microbiota composition, which in turn may impact depressive-like behaviors by affecting the inflammasome pathway.
Conflict of interest statement
The authors declare that they have no conflict of interest.
Figures
Similar articles
-
Inflammasome signaling affects anxiety- and depressive-like behavior and gut microbiome composition.Mol Psychiatry. 2016 Jun;21(6):797-805. doi: 10.1038/mp.2016.46. Epub 2016 Apr 19. Mol Psychiatry. 2016. PMID: 27090302 Free PMC article.
-
Nicotinamide riboside alleviates alcohol-induced depression-like behaviours in C57BL/6J mice by altering the intestinal microbiota associated with microglial activation and BDNF expression.Food Funct. 2020 Jan 29;11(1):378-391. doi: 10.1039/c9fo01780a. Food Funct. 2020. PMID: 31820774
-
NLRP3 gene knockout blocks NF-κB and MAPK signaling pathway in CUMS-induced depression mouse model.Behav Brain Res. 2017 Mar 30;322(Pt A):1-8. doi: 10.1016/j.bbr.2017.01.018. Epub 2017 Jan 16. Behav Brain Res. 2017. PMID: 28093255
-
Microbiota-gut-brain axis in health and disease: Is NLRP3 inflammasome at the crossroads of microbiota-gut-brain communications?Prog Neurobiol. 2020 Aug;191:101806. doi: 10.1016/j.pneurobio.2020.101806. Epub 2020 May 28. Prog Neurobiol. 2020. PMID: 32473843 Review.
-
Gut-Liver Axis and Inflammasome Activation in Cholangiocyte Pathophysiology.Cells. 2020 Mar 17;9(3):736. doi: 10.3390/cells9030736. Cells. 2020. PMID: 32192118 Free PMC article. Review.
Cited by
-
Determination of the protective effects of Hua-Zhuo-Jie-Du in chronic atrophic gastritis by regulating intestinal microbiota and metabolites: combination of liquid chromatograph mass spectrometer metabolic profiling and 16S rRNA gene sequencing.Chin Med. 2021 May 1;16(1):37. doi: 10.1186/s13020-021-00445-y. Chin Med. 2021. PMID: 33933119 Free PMC article.
-
NLRP3-Dependent Pyroptosis: A Candidate Therapeutic Target for Depression.Front Cell Neurosci. 2022 May 26;16:863426. doi: 10.3389/fncel.2022.863426. eCollection 2022. Front Cell Neurosci. 2022. PMID: 35722622 Free PMC article. Review.
-
Gut Microbiota-Derived Inflammation-Related Serum Metabolites as Potential Biomarkers for Major Depressive Disorder.J Inflamm Res. 2021 Aug 6;14:3755-3766. doi: 10.2147/JIR.S324922. eCollection 2021. J Inflamm Res. 2021. PMID: 34393496 Free PMC article.
-
Gut microbiota from sigma-1 receptor knockout mice induces depression-like behaviors and modulates the cAMP/CREB/BDNF signaling pathway.Front Microbiol. 2023 Apr 6;14:1143648. doi: 10.3389/fmicb.2023.1143648. eCollection 2023. Front Microbiol. 2023. PMID: 37089558 Free PMC article.
-
Dietary Supplementation With Lactobacillus plantarum Ameliorates Compromise of Growth Performance by Modulating Short-Chain Fatty Acids and Intestinal Dysbiosis in Broilers Under Clostridium perfringens Challenge.Front Nutr. 2021 Oct 14;8:706148. doi: 10.3389/fnut.2021.706148. eCollection 2021. Front Nutr. 2021. PMID: 34722602 Free PMC article.
References
-
- Kokacya MH, Bahceci B, Bahceci I, Dilek AR, Dokuyucu R. Prolidase activity and oxidative stress in patients with major depressive disorder. Psychiatr. Danubina. 2014;26:314–318. - PubMed
Publication types
MeSH terms
Substances
Supplementary concepts
LinkOut - more resources
Full Text Sources
Other Literature Sources
Molecular Biology Databases
