

AgRP neurons trigger long-term potentiation and facilitate food seeking
- PMID: 33414382
- PMCID: PMC7791100
- DOI: 10.1038/s41398-020-01161-1
AgRP neurons trigger long-term potentiation and facilitate food seeking
Abstract
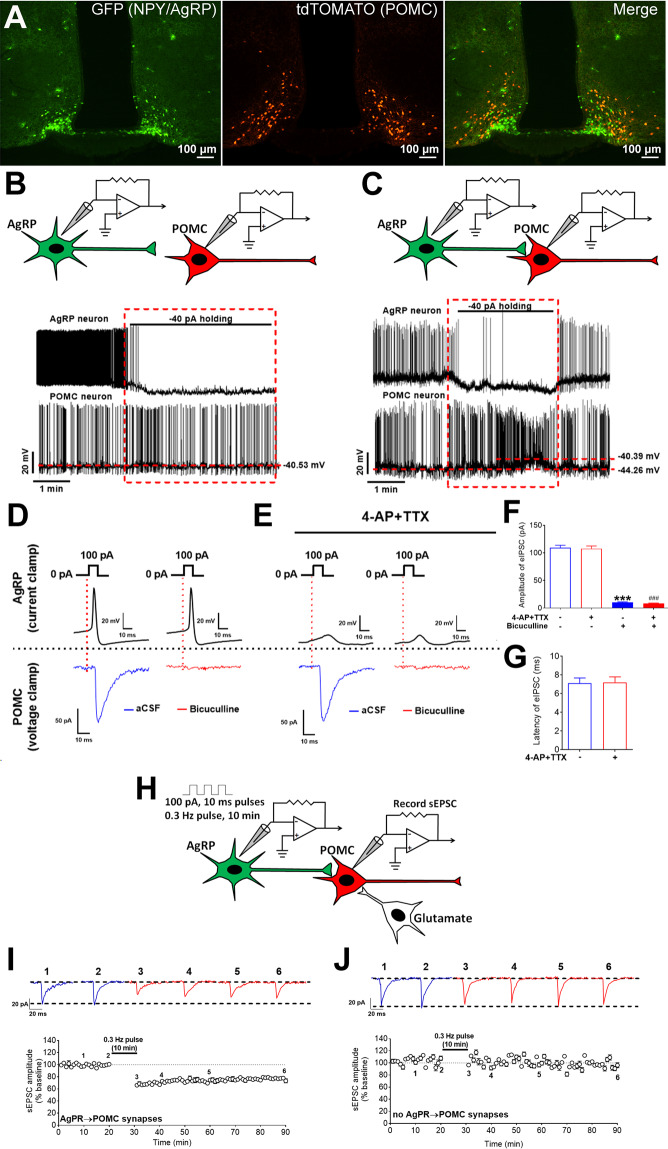
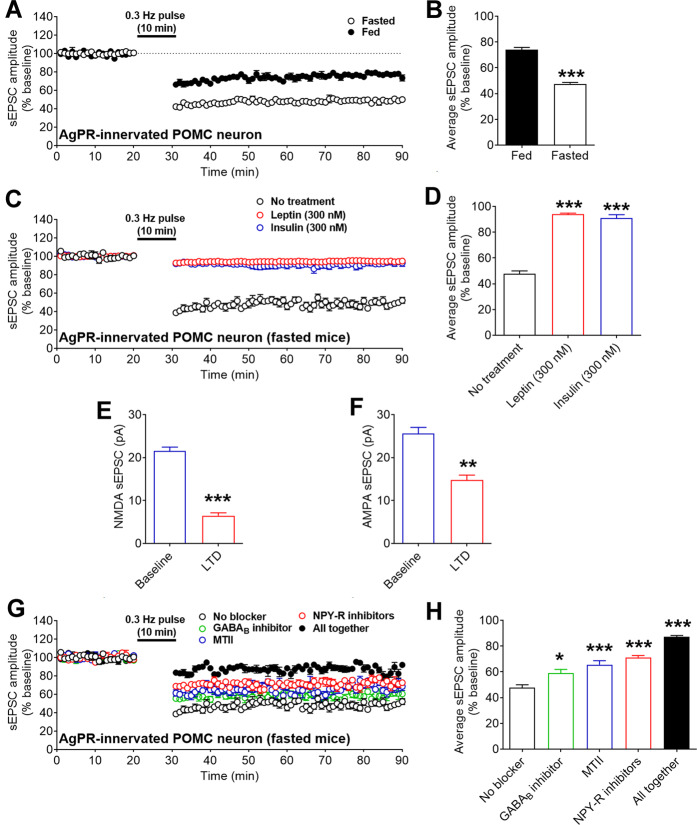
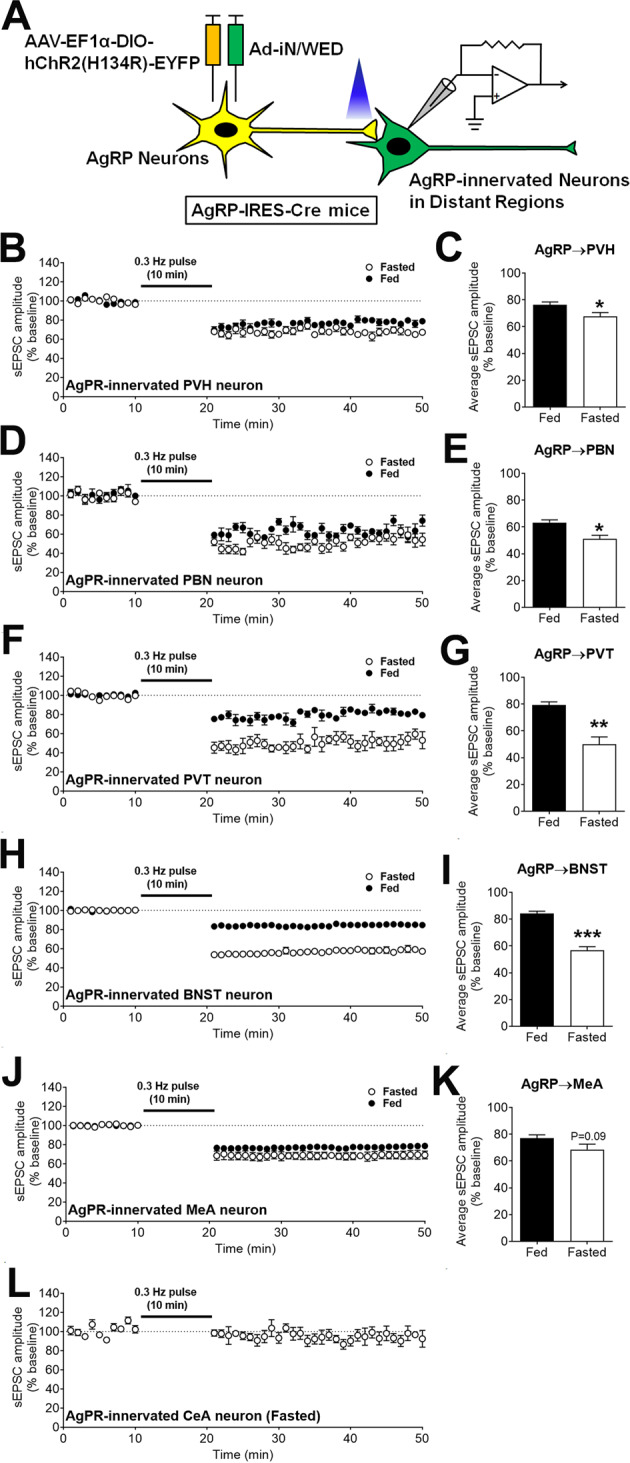
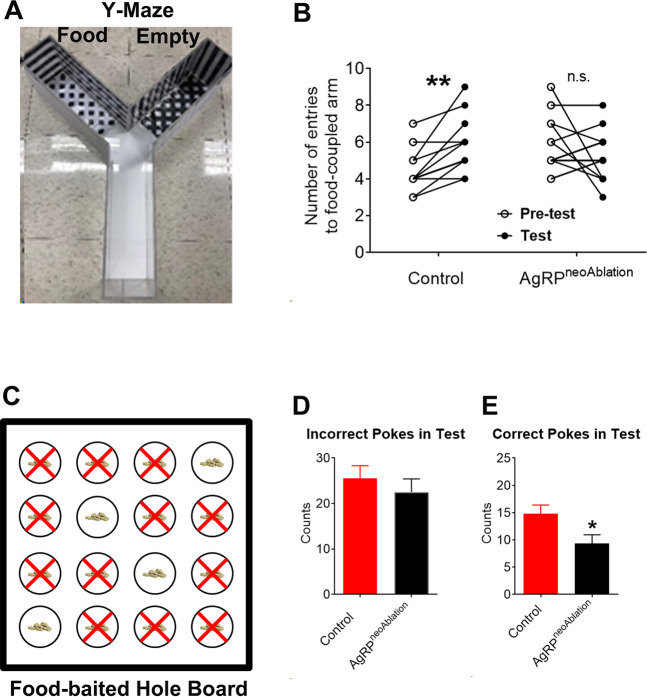
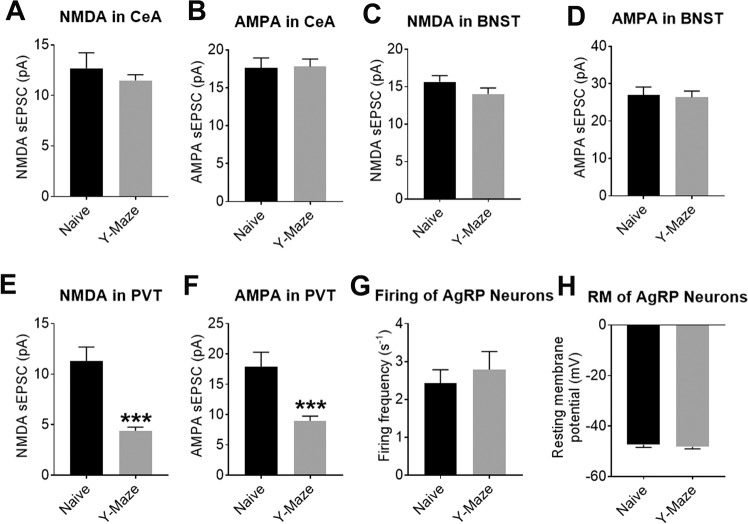
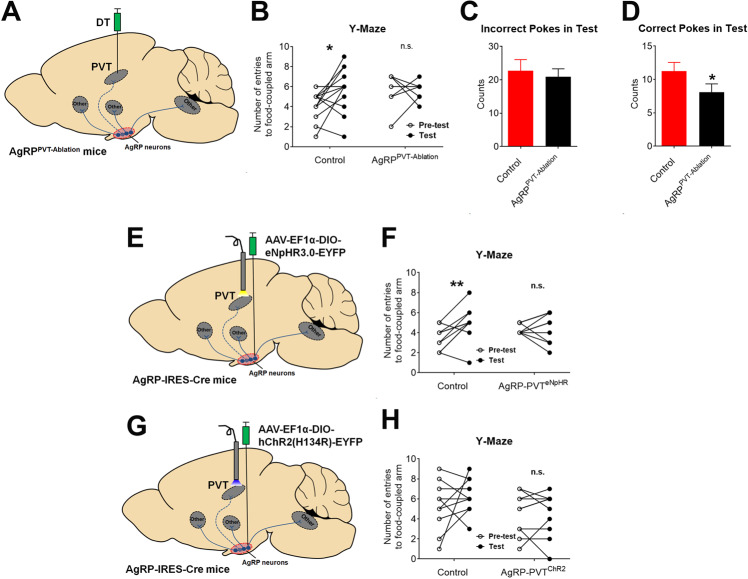
Sufficient feeding is essential for animals' survival, which requires a cognitive capability to facilitate food seeking, but the neurobiological processes regulating food seeking are not fully understood. Here we show that stimulation of agouti-related peptide-expressing (AgRP) neurons triggers a long-term depression (LTD) of spontaneous excitatory post-synaptic current (sEPSC) in adjacent pro-opiomelanocortin (POMC) neurons and in most of their distant synaptic targets, including neurons in the paraventricular nucleus of the thalamus (PVT). The AgRP-induced sEPCS LTD can be enhanced by fasting but blunted by satiety signals, e.g. leptin and insulin. Mice subjected to food-seeking tasks develop similar neural plasticity in AgRP-innervated PVT neurons. Further, ablation of the majority of AgRP neurons, or only a subset of AgRP neurons that project to the PVT, impairs animals' ability to associate spatial and contextual cues with food availability during food seeking. A similar impairment can be also induced by optogenetic inhibition of the AgRP→PVT projections. Together, these results indicate that the AgRP→PVT circuit is necessary for food seeking.
Conflict of interest statement
The authors declare that they have no conflict of interest.
Figures
Similar articles
-
The Relevance of AgRP Neuron-Derived GABA Inputs to POMC Neurons Differs for Spontaneous and Evoked Release.J Neurosci. 2017 Aug 2;37(31):7362-7372. doi: 10.1523/JNEUROSCI.0647-17.2017. Epub 2017 Jun 30. J Neurosci. 2017. PMID: 28667175 Free PMC article.
-
Growth Hormone Receptor Deletion Reduces the Density of Axonal Projections from Hypothalamic Arcuate Nucleus Neurons.Neuroscience. 2020 May 10;434:136-147. doi: 10.1016/j.neuroscience.2020.03.037. Epub 2020 Mar 27. Neuroscience. 2020. PMID: 32229232 Free PMC article.
-
Leptin directly regulate intrinsic neuronal excitability in hypothalamic POMC neurons but not in AgRP neurons in food restricted mice.Neurosci Lett. 2018 Aug 10;681:105-109. doi: 10.1016/j.neulet.2018.05.041. Epub 2018 May 29. Neurosci Lett. 2018. PMID: 29857041
-
AgRP/NPY and POMC neurons in the arcuate nucleus and their potential role in treatment of obesity.Eur J Pharmacol. 2022 Jan 15;915:174611. doi: 10.1016/j.ejphar.2021.174611. Epub 2021 Nov 17. Eur J Pharmacol. 2022. PMID: 34798121 Review.
-
Network of hypothalamic neurons that control appetite.BMB Rep. 2015 Apr;48(4):229-33. doi: 10.5483/bmbrep.2015.48.4.272. BMB Rep. 2015. PMID: 25560696 Free PMC article. Review.
Cited by
-
Identification of a GABAergic neural circuit governing leptin signaling deficiency-induced obesity.Elife. 2023 Apr 12;12:e82649. doi: 10.7554/eLife.82649. Elife. 2023. PMID: 37043384 Free PMC article.
-
Perioperative sleep deprivation activates the paraventricular thalamic nucleus resulting in persistent postoperative incisional pain in mice.Front Neuroanat. 2022 Dec 22;16:1074310. doi: 10.3389/fnana.2022.1074310. eCollection 2022. Front Neuroanat. 2022. PMID: 36620195 Free PMC article.
-
The paraventricular nucleus of the thalamus: an integrative node underlying homeostatic behavior.Trends Neurosci. 2021 Jul;44(7):538-549. doi: 10.1016/j.tins.2021.03.001. Epub 2021 Mar 25. Trends Neurosci. 2021. PMID: 33775435 Free PMC article. Review.
-
A brainstem to hypothalamic arcuate nucleus GABAergic circuit drives feeding.Curr Biol. 2024 Apr 22;34(8):1646-1656.e4. doi: 10.1016/j.cub.2024.02.074. Epub 2024 Mar 21. Curr Biol. 2024. PMID: 38518777 Free PMC article.
-
Structural and functional organization of the midline and intralaminar nuclei of the thalamus.Front Behav Neurosci. 2022 Aug 23;16:964644. doi: 10.3389/fnbeh.2022.964644. eCollection 2022. Front Behav Neurosci. 2022. PMID: 36082310 Free PMC article.
References
Publication types
MeSH terms
Substances
Grants and funding
- R01 DK104901/DK/NIDDK NIH HHS/United States
- P01 DK113954/DK/NIDDK NIH HHS/United States
- R01 DK109934/DK/NIDDK NIH HHS/United States
- UL1 TR003167/TR/NCATS NIH HHS/United States
- R01 DK115761/DK/NIDDK NIH HHS/United States
- R01 DK117281/DK/NIDDK NIH HHS/United States
- R00 DK107008/DK/NIDDK NIH HHS/United States
- R01 ES027544/ES/NIEHS NIH HHS/United States
- R01 DK126655/DK/NIDDK NIH HHS/United States
- R01 DK120858/DK/NIDDK NIH HHS/United States
- R01 DK109194/DK/NIDDK NIH HHS/United States
- P30 DK072476/DK/NIDDK NIH HHS/United States
- K01 DK119471/DK/NIDDK NIH HHS/United States
- P30 HD024064/HD/NICHD NIH HHS/United States
- R01 DK114279/DK/NIDDK NIH HHS/United States
- R21 NS108091/NS/NINDS NIH HHS/United States
- R56 DK109194/DK/NIDDK NIH HHS/United States
LinkOut - more resources
Full Text Sources
Other Literature Sources
Molecular Biology Databases
Miscellaneous
