

Dentate gyrus activin signaling mediates the antidepressant response
- PMID: 33414389
- PMCID: PMC7791138
- DOI: 10.1038/s41398-020-01156-y
Dentate gyrus activin signaling mediates the antidepressant response
Abstract
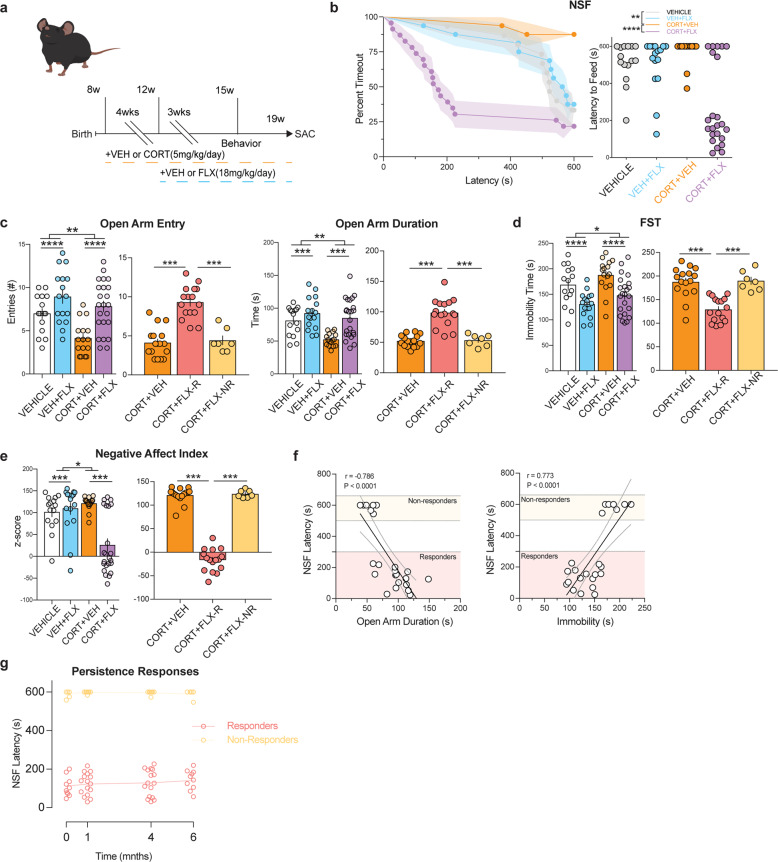
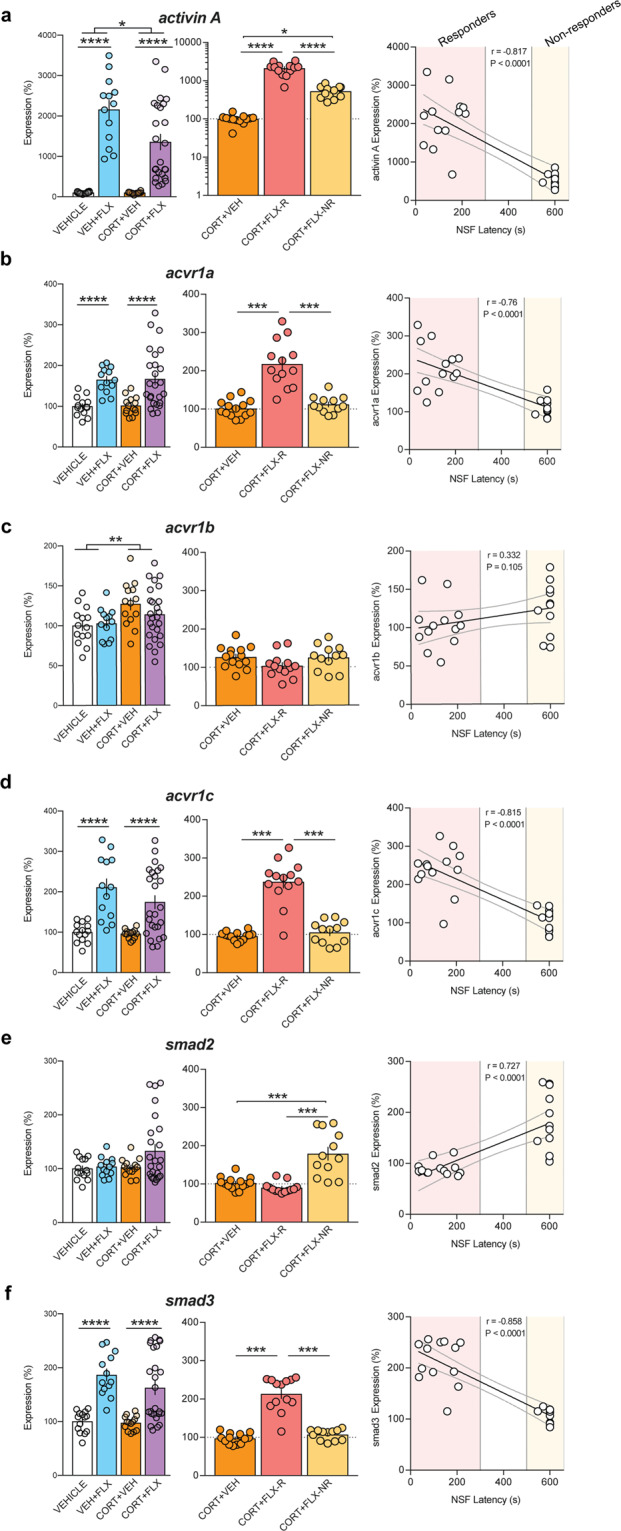
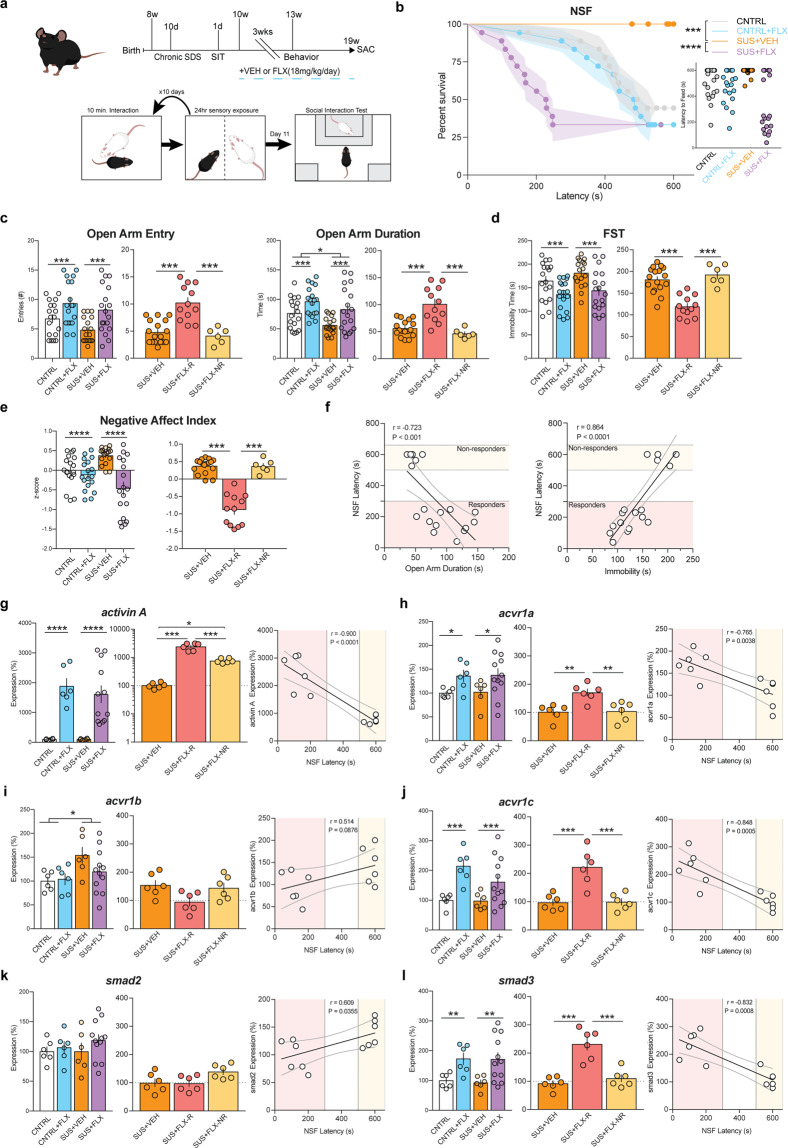
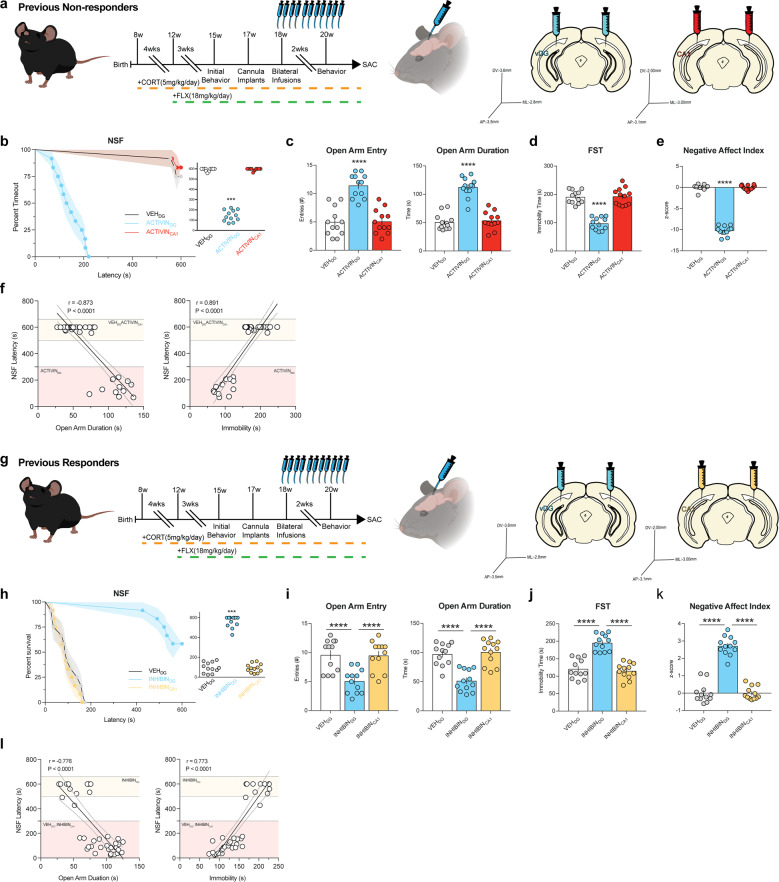
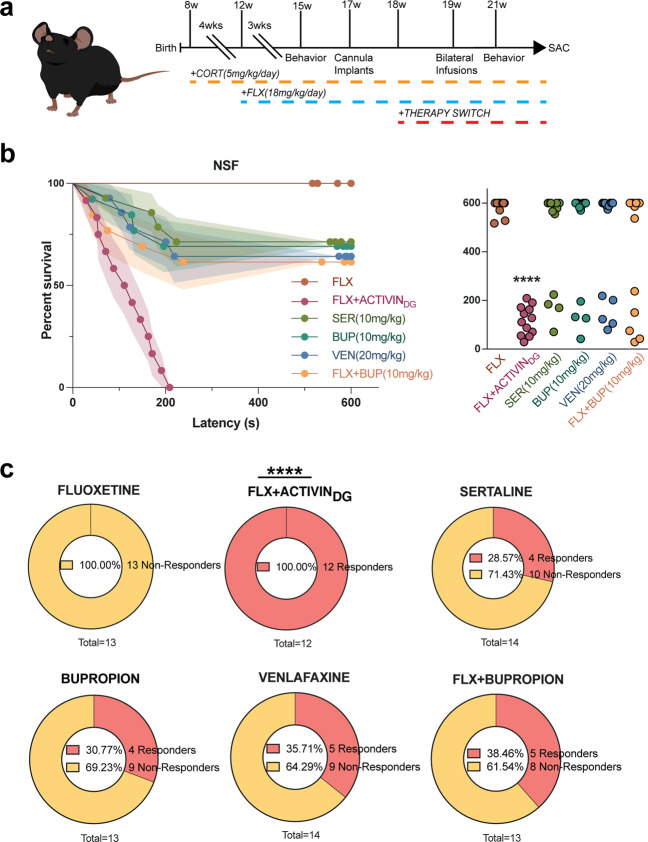
Antidepressants that target monoaminergic systems, such as selective serotonin reuptake inhibitors (SSRIs), are widely used to treat neuropsychiatric disorders including major depressive disorder, several anxiety disorders, and obsessive-compulsive disorder. However, these treatments are not ideal because only a subset of patients achieve remission. The reasons why some individuals remit to antidepressant treatments while others do not are unknown. Here, we developed a paradigm to assess antidepressant treatment resistance in mice. Exposure of male C57BL/6J mice to either chronic corticosterone administration or chronic social defeat stress induces maladaptive affective behaviors. Subsequent chronic treatment with the SSRI fluoxetine reverses these maladaptive affective behavioral changes in some, but not all, of the mice, permitting stratification into persistent responders and non-responders to fluoxetine. We found several differences in expression of Activin signaling-related genes between responders and non-responders in the dentate gyrus (DG), a region that is critical for the beneficial behavioral effects of fluoxetine. Enhancement of Activin signaling in the DG converted behavioral non-responders into responders to fluoxetine treatment more effectively than commonly used second-line antidepressant treatments, while inhibition of Activin signaling in the DG converted responders into non-responders. Taken together, these results demonstrate that the behavioral response to fluoxetine can be bidirectionally modified via targeted manipulations of the DG and suggest that molecular- and neural circuit-based modulations of DG may provide a new therapeutic avenue for more effective antidepressant treatments.
Conflict of interest statement
The authors declare that they have no conflict of interest.
Figures
Similar articles
-
Behavioral response to fluoxetine in both female and male mice is modulated by dentate gyrus granule cell activity.Neurobiol Stress. 2020 Oct 17;13:100257. doi: 10.1016/j.ynstr.2020.100257. eCollection 2020 Nov. Neurobiol Stress. 2020. PMID: 33344712 Free PMC article.
-
Obligatory roles of dopamine D1 receptors in the dentate gyrus in antidepressant actions of a selective serotonin reuptake inhibitor, fluoxetine.Mol Psychiatry. 2020 Jun;25(6):1229-1244. doi: 10.1038/s41380-018-0316-x. Epub 2018 Dec 10. Mol Psychiatry. 2020. PMID: 30531938 Free PMC article.
-
Fluoxetine induces input-specific hippocampal dendritic spine remodeling along the septotemporal axis in adulthood and middle age.Hippocampus. 2015 Nov;25(11):1429-46. doi: 10.1002/hipo.22464. Epub 2015 May 2. Hippocampus. 2015. PMID: 25850664 Free PMC article.
-
Depression and adult neurogenesis: Positive effects of the antidepressant fluoxetine and of physical exercise.Brain Res Bull. 2018 Oct;143:181-193. doi: 10.1016/j.brainresbull.2018.09.002. Epub 2018 Sep 17. Brain Res Bull. 2018. PMID: 30236533 Review.
-
[Fluoxetine: an update of its use in major depressive disorder in adults].Encephale. 2004 Jul-Aug;30(4):392-9. doi: 10.1016/s0013-7006(04)95453-x. Encephale. 2004. PMID: 15597466 Review. French.
Cited by
-
Hippocampal BMP signaling as a common pathway for antidepressant action.Cell Mol Life Sci. 2021 Dec 22;79(1):31. doi: 10.1007/s00018-021-04026-y. Cell Mol Life Sci. 2021. PMID: 34936033 Free PMC article.
-
Behavioral response to fluoxetine in both female and male mice is modulated by dentate gyrus granule cell activity.Neurobiol Stress. 2020 Oct 17;13:100257. doi: 10.1016/j.ynstr.2020.100257. eCollection 2020 Nov. Neurobiol Stress. 2020. PMID: 33344712 Free PMC article.
-
Identification and characterization of noncoding RNAs-associated competing endogenous RNA networks in major depressive disorder.World J Psychiatry. 2023 Feb 19;13(2):36-49. doi: 10.5498/wjp.v13.i2.36. eCollection 2023 Feb 19. World J Psychiatry. 2023. PMID: 36925948 Free PMC article.
-
The effect of SSRIs on unconditioned anxiety: a systematic review and meta-analysis of animal studies.Psychopharmacology (Berl). 2024 Sep;241(9):1731-1755. doi: 10.1007/s00213-024-06645-2. Epub 2024 Jul 9. Psychopharmacology (Berl). 2024. PMID: 38980348 Free PMC article.
-
Neuroadaptations and TGF-β signaling: emerging role in models of neuropsychiatric disorders.Mol Psychiatry. 2022 Jan;27(1):296-306. doi: 10.1038/s41380-021-01186-y. Epub 2021 Jun 15. Mol Psychiatry. 2022. PMID: 34131268 Free PMC article. Review.
References
-
- Kessler RC, et al. The epidemiology of major depressive disorder: results from the National Comorbidity Survey Replication (NCS-R) JAMA. 2003;289:3095–3105. - PubMed
Publication types
MeSH terms
Substances
Grants and funding
- K01 MH098188/MH/NIMH NIH HHS/United States
- NARSAD Young Investigator/Brain and Behavior Research Foundation (Brain & Behavior Research Foundation)/International
- R01 MH112861/MH/NIMH NIH HHS/United States
- K01MH098188/U.S. Department of Health & Human Services | NIH | National Institute of Mental Health (NIMH)/International
- R01MH112861/U.S. Department of Health & Human Services | NIH | National Institute of Mental Health (NIMH)/International
LinkOut - more resources
Full Text Sources
Other Literature Sources
