. 2021 Jan 7;12(1):116.
doi: 10.1038/s41467-020-20216-x.

TgAP2IX-5 is a key transcriptional regulator of the asexual cell cycle division in Toxoplasma gondii

Affiliations

TgAP2IX-5 is a key transcriptional regulator of the asexual cell cycle division in Toxoplasma gondii

Asma S Khelifa et al. Nat Commun. .

Abstract

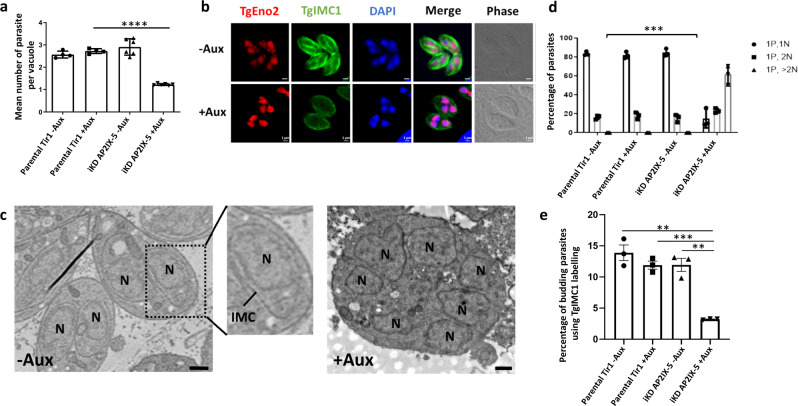
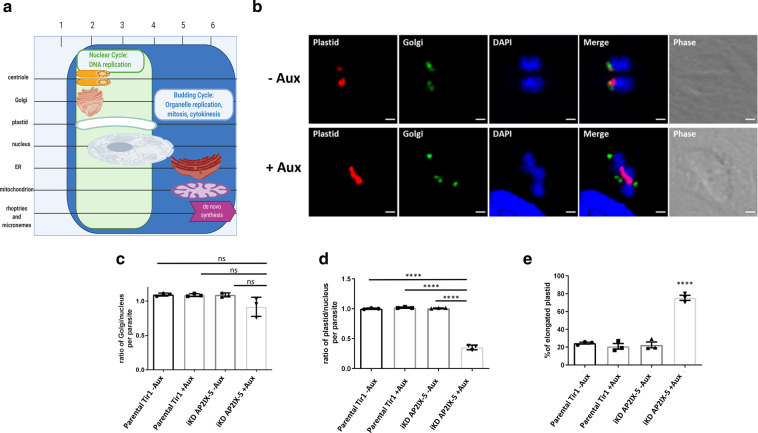
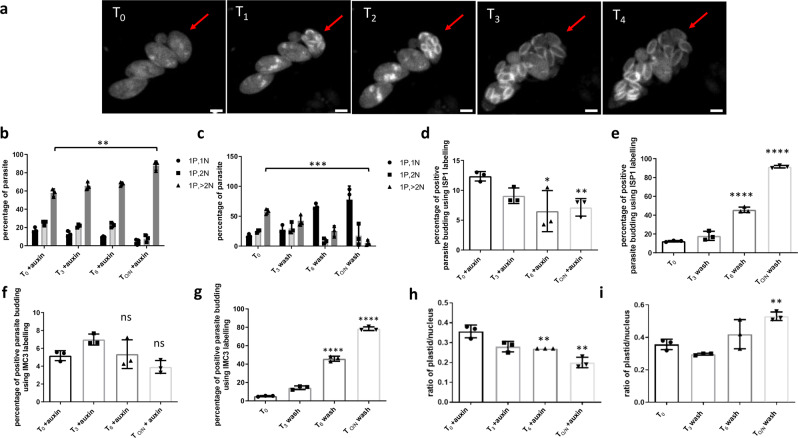
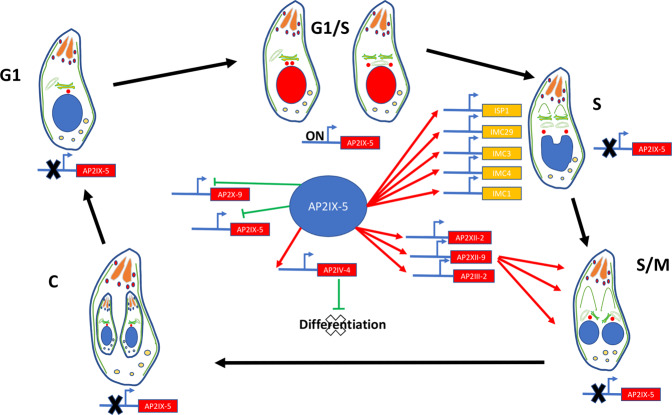
Apicomplexan parasites have evolved efficient and distinctive strategies for intracellular replication where the timing of emergence of the daughter cells (budding) is a decisive element. However, the molecular mechanisms that provide the proper timing of parasite budding remain unknown. Using Toxoplasma gondii as a model Apicomplexan, we identified a master regulator that controls the timing of the budding process. We show that an ApiAP2 transcription factor, TgAP2IX-5, controls cell cycle events downstream of centrosome duplication. TgAP2IX-5 binds to the promoter of hundreds of genes and controls the activation of the budding-specific cell cycle expression program. TgAP2IX-5 regulates the expression of specific transcription factors that are necessary for the completion of the budding cycle. Moreover, TgAP2IX-5 acts as a limiting factor that ensures that asexual proliferation continues by promoting the inhibition of the differentiation pathway. Therefore, TgAP2IX-5 is a master regulator that controls both cell cycle and developmental pathways.


Conflict of interest statement

The authors declare no competing interests.

Figures

Fig. 1
Fig. 1. TgAP2IX-5 is a cell-cycle-regulated protein.
a Confocal imaging demonstrating the expression of the TgAP2IX-5 protein using anti-HA antibody during the tachyzoite cell cycle. Anti-TgCentrin1, anti-TgChromo1, and anti-TgISP1 were used as cell cycle markers. The schematic cell cycle phase is indicated on the right side of the figure and the scale bar (1 µm) is indicated on the lower right side of each confocal image. b Schematic representation of the AID system used to degrade the TgAP2IX-5 protein. This system consists of introducing a recognition sequence into the gene of interest, which expresses a protein fused to the recognition sequence and in the presence of Auxin, will be recognized by the TIR1 protein and degraded by the proteasome. This system was used to produce an inducible knockdown parasite in which the expression of TgAP2IX-5 can be controlled. c Western blot of total protein extract from the parental and iKD TgAP2IX-5 strains treated with Auxin for different durations of time validating the AID system. Western blots were probed with anti-HA to detect the presence of TgAP2IX-5 protein (upper panel), anti-TgActin was used as a control for normalization (lower panel).
Fig. 2
Fig. 2. Characterization of TgAP2IX-5 iKD parasite.
a Growth assay for parental and iKD TgAP2IX-5 strains in the absence and presence of auxin treatment for 24 h. The number of parasites per vacuole was measured and the average number of parasites is represented within the graph. A total of 100 vacuoles were counted for each replicate. A Student’s t-test was performed; two-tailed p-value: ****p < 0.0001; mean ± s.d. (n = 4 independent experiments). b Confocal imaging of iKD TgAP2IX-5 labelled with TgEno2 (red) and TgIMC1(green) in the presence and absence of auxin treatment. Auxin was added 24 h post-infection. DAPI was used to stain the nucleus. Scale bar is indicated at the lower right side of each image. c Electron microscopy scans demonstrating the structural morphology of the nucleus in iKD TgAP2IX-5 parasite in the absence and presence of auxin. (N) represents the nucleus. Two daughter parasites are formed within each mother parasite in absence of auxin. Multinucleated parasites are visible in presence of auxin. Scale bar (500 nm) is indicated at the lower right side in the TEM images. d Bar graphs representing nucleus per parasite counts for parental and iKD TgAP2IX-5 strains in the absence and presence of auxin (12 h treatment). P stands for parasites and N stands for nuclei. A Student’s t-test was performed comparing mean percentage of multinucleated parasite between the control (Parental in absence of auxin) and iKD TgAP2IX-5 in the presence of auxin, two-tailed p-values: ***p = 0,0004; mean ± s.d. (n = 3 independent experiments). e Bar graph representing the percentage of daughter parasite formation in the absence and presence of 6 h of auxin treatment using TgIMC1 labelling, A Student’s t-test was performed, two-tailed p-values: ***p = 0.0002, **p = 0.0012; mean ± s.d. (n = 3 independent experiments).
Fig. 3
Fig. 3. Centrosome division is mostly unaffected in the absence of TgAP2IX-5.
a Confocal imaging of iKD TgAP2IX-5 labelled with TgChromo1 and TgCentrin1. TgChromo1 is indicated in green. TgCentrin1 is indicated in red. DAPI was used to stain the nucleus. Scale bar is indicated at the lower right side of each image. Occasional disconnection between centromere and outer-centrosome was observed but does not represent the majority of cases. b Bar graph representing TgCentrin1: nucleus ratio using the parental and iKD TgAP2IX-5 strains in the absence and presence of auxin treatment for 6 h. A Student’s t-test was performed, two-tailed p-values: **p = 0.0015 (iKD TgAP2IX-5 +auxin compared to Parental Tir1 -auxin), **p = 0.001 (iKD TgAP2IX-5 +auxin compared to Parental Tir1 +auxin), **p = 0.0112 (iKD TgAP2IX-5 +auxin compared to iKD TgAP2IX-5 −auxin); mean ± s.d. (n = 3 independent experiments). c Bar graph representing chromo1: nucleus ratio using the parental and iKD TgAP2IX-5 strains in the absence and presence of auxin treatment for 6 h; A Student’s t-test was performed, two-tailed p-values: ***p = 0.0006 (iKD TgAP2IX-5 +auxin compared to Parental Tir1 −auxin), ***p = 0.0007 (iKD TgAP2IX-5 +auxin compared to Parental Tir1 +auxin), **p = 0.0022 (iKD TgAP2IX-5 +auxin compared to iKD TgAP2IX-5 −auxin); mean ± s.d. (n = 3 independent experiments).
Fig. 4
Fig. 4. Organelle replication in iKD TgAP2IX-5 throughout the tachyzoite asexual cell cycle.
a Schematic representation of the chronological order of organellar division throughout a normal Toxoplasma gondii cell cycle. Nuclear cycle is indicated in green and budding cycle is indicated in blue. Timeframe of each organelle division is represented by length of representative organelle. b Confocal microscopy of iKD TgAP2IX-5 parasite with labelled plastid (red) and Golgi (green) in the presence and absence of overnight auxin treatment. The lower panel clearly represents the elongated plastid phenotype. DAPI was used to stain the nucleus. Scale bar is indicated at the lower right side of each image. c Bar graph representing the ratio of Golgi: nucleus using the parental and iKD TgAP2IX-5 strains in the absence and presence of overnight auxin treatment. A Student’s t-test was performed, two-tailes p-values: p = 0.0948 (iKD TgAP2IX-5 +auxin compared to Parental Tir1 −auxin), p = 0.1039 (iKD TgAP2IX-5 +auxin compared to Parental Tir1 +auxin), p = 0.1030 (iKD TgAP2IX-5 +auxin compared to iKD TgAP2IX-5 −auxin); mean ± s.d. (n = 3 independent experiments). d Bar graph representing the ratio of plastid to nucleus using the parental and iKD TgAP2IX-5 strains in the absence and presence of overnight auxin treatment. A Student’s t-test was performed, two-tailed p-values: ****P < 0.0001; mean ± s.d. (n = 3 independent experiments). e Bar graph representing the percentage of parental and iKD TgAP2IX-5 parasites with an elongated plastid in the absence and presence of overnight auxin treatment. A Student’s t-test was performed, two-tailed p-values: ****P < 0.0001; mean ± s.d. (n = 3 independent experiments).
Fig. 5
Fig. 5. TgAP2IX-5 controls the expression of key genes involved in daughter parasite formation.
a Volcano plot of differentially expressed genes analyzed from RNA-sequencing of TgAP2IX-5 parasites treated with auxin for 6 h. Downregulated genes are represented in blue, upregulated genes are represented in red. Statistically nonsignificant genes are represented in gray. The differential expression analysis (DE) was based on three independent biological experiments. b Heatmap showing the cell cycle expression of all individual transcripts that are downregulated in the iKD AP2IX-5 strain in the presence of 6 h of auxin treatment. The cell cycle phases are represented at the bottom as well as the timing when budding occurs. c ChIP-seq data representing the direct targeting of TgAP2IX-5 to the promoters of TgIMC4 (i), TgIMC1 (i), TgGAPM3 (ii), TgIMC29 (iii), and TgAP2XII-2 (iv) genes. MACS2 generated tracks are represented together with the annotated genes (top). d Venn diagram of overlapping downregulated genes, upregulated genes from RNA-seq, and identified promoters of genes directly interacting with TgAP2IX-5. DEseq2 and MACS2 software were used to analyze RNA-seq and ChIP-seq data, respectively. e Heatmap of 89 downregulated genes directly activated by TgAP2IX-5. The cell cycle phases are represented at the bottom.
Fig. 6
Fig. 6. iKD TgAP2IX-5 parasites treated with auxin resume cell division and daughter parasite formation mimicking endopolyogeny.
a Video-microscopy images of iKD TgAP2IX-5 parasites at different timepoints after auxin washout. The budding vacuole and the emergence of parasites is indicated with a red arrow. The IMC of the parasite is labelled with IMC3-mCherry. The scale bar is indicated at the bottom right of each panel. b Bar graph representing nucleus per parasite ratio. Timepoint T0 = 0 min is equal to start of auxin wash. Two-tailed p-values: **p = 0.0015; mean ± s.d. (n = 3 independent experiments). c Bar graph representing iKD TgAP2IX-5 nucleus per parasite counts during different timepoints of auxin washout treatments; 3 h, 6 h, and overnight (O/N) washout. Two-tailed p-values: **p = 0.0001; mean ± s.d. (n = 3 independent experiments). d Bar graph representing parasite budding in the iKD TgAP2IX-5 strain during overnight auxin treatment using ISP1 labelling. Two-tailed p-values: *p = 0.0457, **p = 0.0057; mean ± s.d. (n = 3 independent experiments). e Bar graph representing parasite budding in the iKD TgAP2IX-5 strain using TgISP1 labelling during different timepoints of auxin washout treatments; 3 h, 6 h, and overnight (O/N) washout. Two-tailed p-values: ****p < 0.0001; mean ± s.d. (n = 3 independent experiments). f Bar graph representing parasite budding in the iKD TgAP2IX-5 strain using TgIMC3 labelling during overnight auxin treatment. Two-tailed p-values: ns: p > 0.05; mean ± s.d. (n = 3 independent experiments). g Bar graph representing parasite budding in the iKD TgAP2IX-5 strain using TgIMC3 labelling during different timepoints of auxin washout treatments; 3 h, 6 h, and overnight (O/N) washout. Two-tailed p-values: ****p < 0.0001; mean ± s.d. (n = 3 independent experiments). h Bar graph representing the ratio of plastid to nucleus in the iKD TgAP2IX-5 strain during overnight auxin treatment. Two-tailed p-values: **p = 0.0029 (TO/N + auxin compared to T0), **p = 0.0095 (T6 + auxin compared to T0); mean ± s.d. (n = 3 independent experiments). (i) Bar graph representing the ratio of plastid to nucleus in the iKD TgAP2IX-5 strain during different timepoints of auxin washout treatments; 3 h, 6 h, and overnight (O/N) washout. Two-tailed p-values: **p = 0.0020; mean ± s.d. (n = 3 independent experiments).
Fig. 7
Fig. 7. Schematic representation of the effect of TgAP2IX-5 depletion on daughter cell formation according to the different phases of the cell cycle.
Absence of TgAP2IX-5 leads to the blockage of the cell cycle within the G1/S phase. This is associated with the direct targeting of key inner membrane complex proteins such as TgISP1, TgIMC1, TgIMC29, TgIMC3, and TgIMC4 as well as other key TFs (TgAP2XII-2, TgAP2XII-9, TgAP2III-2, TgAP2IV-4, TgAP2X-9). TgAP2IV-4 is a known repressor of differentiation. TgAP2X-9 may be repressed by TgAP2IX-5. The TgAP2IX-5 transcript may also be regulated by a negative feedback loop.

Similar articles

Cited by

References

    1. Francia ME, Striepen B. Cell division in apicomplexan parasites. Nat. Rev. Microbiol. 2014;12:125–136. doi: 10.1038/nrmicro3184. - DOI - PubMed
    1. Gubbels M-J, White M, Szatanek T. The cell cycle and Toxoplasma gondii cell division: tightly knit or loosely stitched? Int. J. Parasitol. 2008;38:1343–1358. doi: 10.1016/j.ijpara.2008.06.004. - DOI - PubMed
    1. Chen C-T, Gubbels M-J. Apicomplexan cell cycle flexibility: centrosome controls the clutch. Trends Parasitol. 2015;31:229–230. doi: 10.1016/j.pt.2015.04.003. - DOI - PMC - PubMed
    1. Sheffield HG, Melton ML. The fine structure and reproduction of Toxoplasma gondii. J. Parasitol. 1968;54:209–226. doi: 10.2307/3276925. - DOI - PubMed
    1. Francia ME, et al. Cell division in apicomplexan parasites is organized by a homolog of the striated rootlet fiber of algal flagella. PLoS Biol. 2012;10:e1001444. doi: 10.1371/journal.pbio.1001444. - DOI - PMC - PubMed

Publication types