. 2021 Jan 7;12(1):3.
doi: 10.1038/s41467-020-20176-2.

Earliest Olduvai hominins exploited unstable environments ~ 2 million years ago

Affiliations

Earliest Olduvai hominins exploited unstable environments ~ 2 million years ago

Julio Mercader et al. Nat Commun. .

Abstract

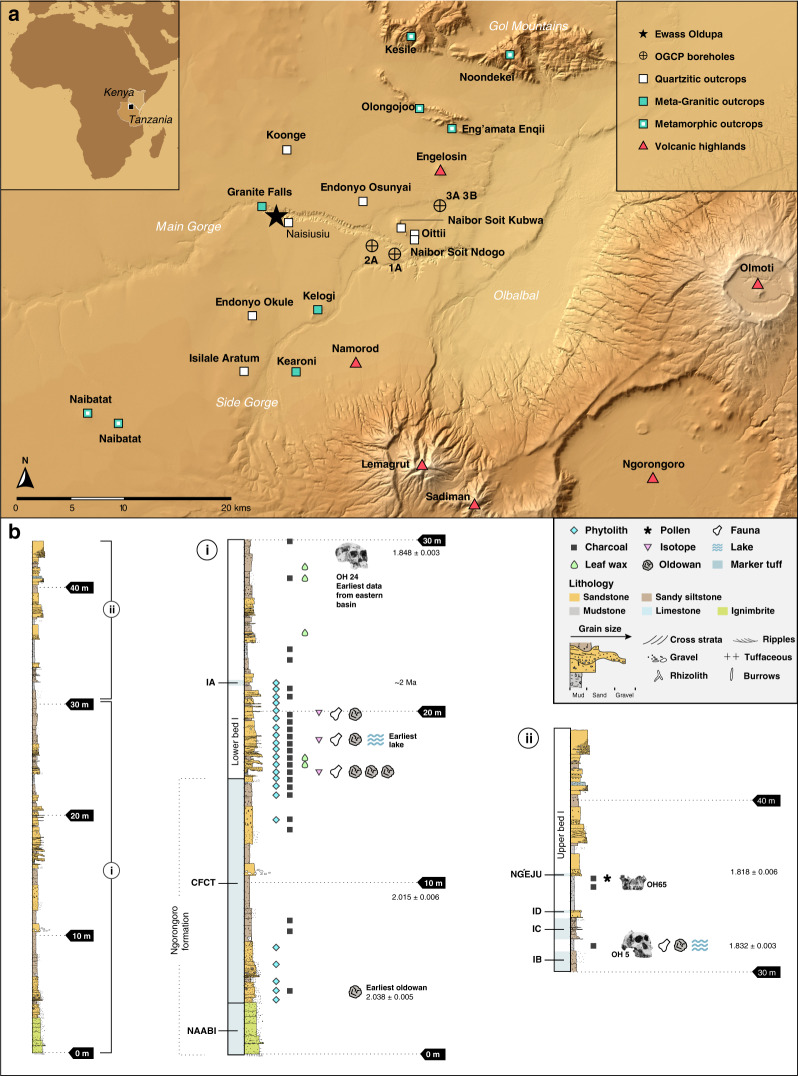
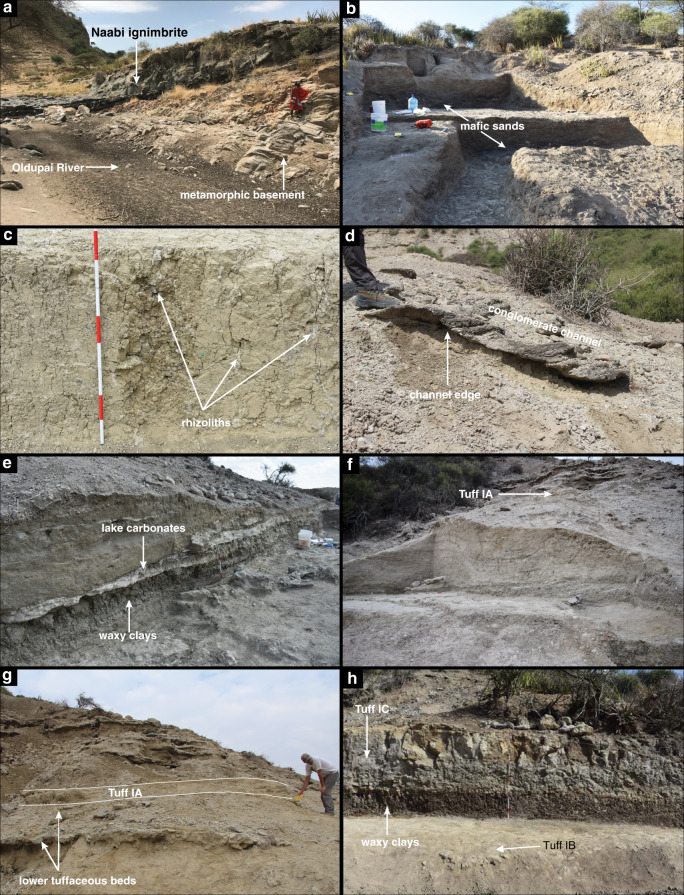
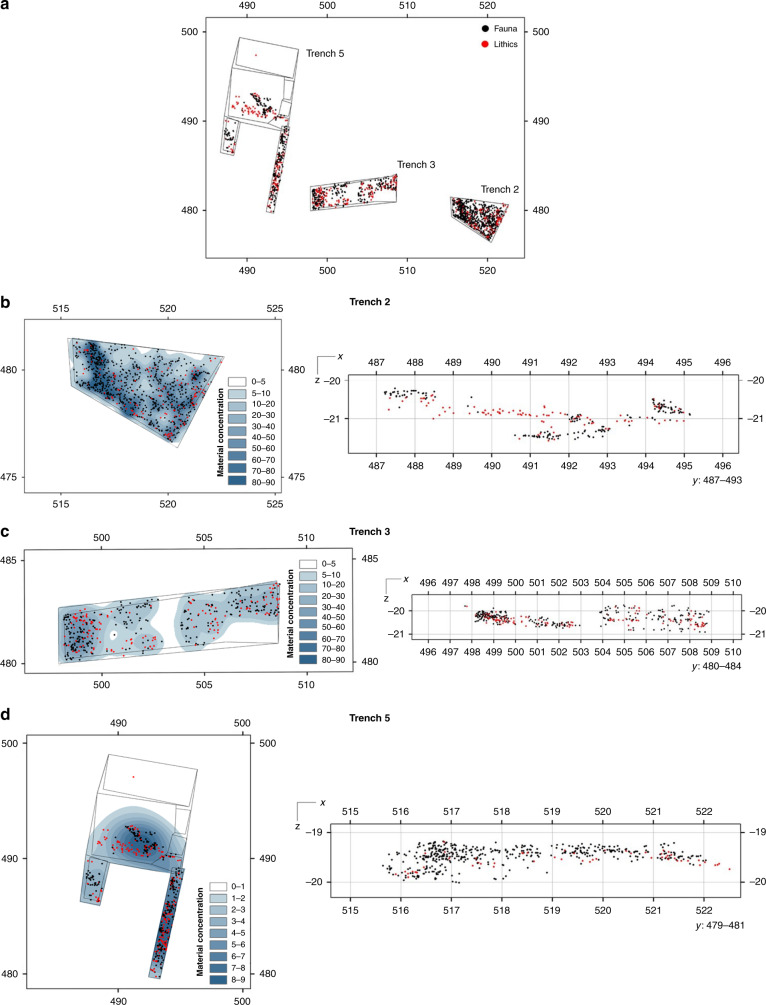
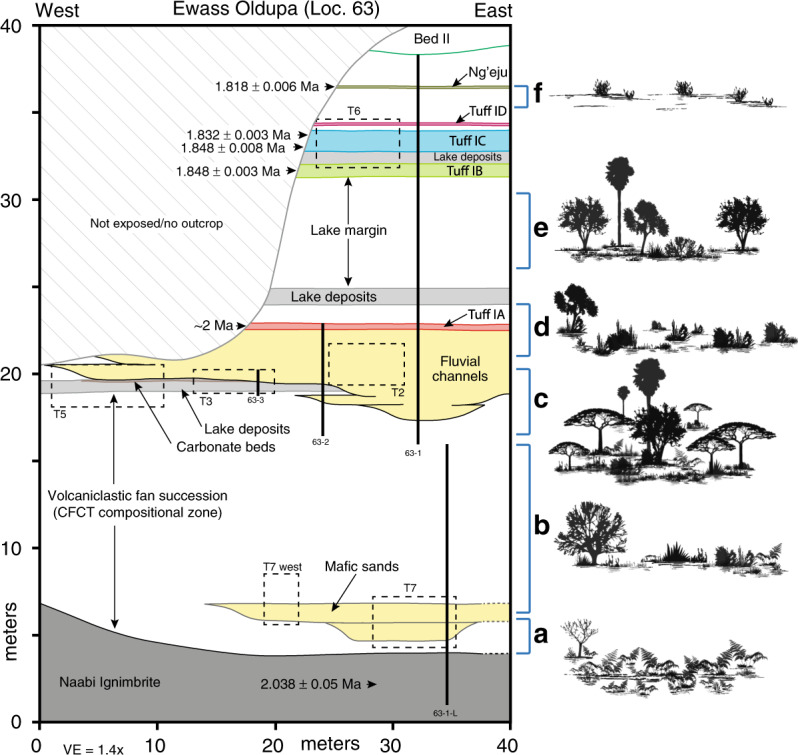
Rapid environmental change is a catalyst for human evolution, driving dietary innovations, habitat diversification, and dispersal. However, there is a dearth of information to assess hominin adaptions to changing physiography during key evolutionary stages such as the early Pleistocene. Here we report a multiproxy dataset from Ewass Oldupa, in the Western Plio-Pleistocene rift basin of Olduvai Gorge (now Oldupai), Tanzania, to address this lacuna and offer an ecological perspective on human adaptability two million years ago. Oldupai's earliest hominins sequentially inhabited the floodplains of sinuous channels, then river-influenced contexts, which now comprises the oldest palaeolake setting documented regionally. Early Oldowan tools reveal a homogenous technology to utilise diverse, rapidly changing environments that ranged from fern meadows to woodland mosaics, naturally burned landscapes, to lakeside woodland/palm groves as well as hyper-xeric steppes. Hominins periodically used emerging landscapes and disturbance biomes multiple times over 235,000 years, thus predating by more than 180,000 years the earliest known hominins and Oldowan industries from the Eastern side of the basin.


Conflict of interest statement

The authors declare no competing interests.

Figures

Fig. 1
Fig. 1. Geographic and Stratigraphic Context.
a Location map. Star symbol is for the site of Ewass Oldupa. Boreholes recently published are shown for reference. Major rock types potentially available for hominin exploitation throughout the region are also marked. b Single stratigraphic section from Ewass Oldupa, subdivided into two segments: lower (i) and upper (ii). Ngorongoro formation: the succession starts with the Naabi, a green-gray, quartz-trachyte welded tuff dated to 2.038 ± 0.005 Ma. A thin red diamictite overlies the Naabi and separates it from a series of fining-upward sandstone-dominated units composed of mafic tephra (Fig. 2b) that is capped by siltstone. Ngorongoro formation, CFCT compositional zone: the strata are composed of reddish-brown sandstone, volcanic detritus, and tephra/siliciclastic diamictite. (i) Lower Bed I—six units that upward fine from pebble-cobble conglomerate to cross-stratified sandstone are attributed to meandering river channels, below Tuff IA. Subsequently, a fine-grained silty sandstone that fines into waxy, green-brown claystone with carbonate nodules was deposited in a lake setting. Lastly, interbedded sandstone, siltstone, claystone, and tuffaceous beds record fluctuating environments from lacustrine to shallow lakeshore to floodplain with small fluvial channels. (ii) Upper Bed I—starts with Tuff IB, overlying waxy, green-brown claystone (Fig. 2H), and then Tuff IC. Capping the succession is a beige, weakly stratified sandstone that is geochemically consistent with Tuff 1D,,. Above this, the Ng’eju Tuff is encountered in a succession of fine-grained floodplain deposits. Additional stratigraphic information is presented in Fig. 5.
Fig. 2
Fig. 2. Key stratigraphic horizons.
a Ngorongoro formation: Naabi ignimbrite overlying metamorphic basement along the Oldupai River. b Ngorongoro Formation: Mafic sands immediately above the Naabi in trench 7. c Ngorongoro formation: CFCT compositional zone, trench 5, characterized by abundant rhizoliths. d Lower Bed I: conglomeratic channel fill deposit with trough-cross stratification dipping to the east. e Lower Bed I: waxy claystones from trench 3 capped by carbonate beds. f Lower Bed I: multi-storey fluvial channel belt deposits in trench 2, several meters beneath Tuff IA. (Metric pole on the ground for scale.) g Lower Bed I: Ewass Oldupa exposure of Tuff IA and underlying thin tuffaceous beds. h Upper Bed I: thick waxy claystone unit capping Tuff IB, and underlying Tuff IC. See Fig. 5 for further stratigraphic information.
Fig. 3
Fig. 3. Mapping of excavated materials.
a Plotting of excavated lithics and fossil specimens. bd Right: vertical projections of stone artifacts and bones show discrete archaeological horizons (axis units are in meters). Left: Kernel density analysis shows spatial variations in the accumulation of archaeological materials (densest in darkest blue). The stratigraphic position of trenches 2, 3, and 5 within the overall column is presented in Fig. 5.
Fig. 4
Fig. 4. Selection of stone tools from Ewass Oldupa.
Ngorongoro Formation: earliest Oldowan, post Naabi, Trench 7: a Quartzite multipolar-multifacial core. bc Quartzite flakes. Ngorongoro Formation, Contact CFCT compositional zone/Bottom of Bed I, Trench 5: d Ignimbrite chopping-tool. e Ignimbrite chopper. f Quartzite unipolar longitudinal core. g Quartzite multipolar-multifacial core. Lower Bed I: earliest lake expansion, Trench 3: h Quartzite spheroid. i Quartzite flakes. Lower Bed I: prograding fluvial system below Tuff IA, Trench 2: jl Quartzite flakes.
Fig. 5
Fig. 5. Outcrop geometry, stratigraphic architecture, and idealized vegetation at Ewass Oldupa.
Location of measured stratigraphic sections and excavation trenches. The details of section 63-1-L and 63-1 are presented in Fig. 1b. Artist rendering of plant communities over time: a Post-eruptive, fern meadow. b CFCT mosaics. c Woodland with palms and ferns. d Grasslands coeval with Tuff IA. e Open woodland. f Asteraceae-dominated scrub.
Fig. 6
Fig. 6. Photomicrographs of selected phytoliths and pollen from Bed I.
a Large tabular sulcate cf. Pteridaceae. b, c Blocky phytoliths from woody dicots. d Epidermal piece cf. Pteridaceae. e Tabular bifid cf. Pteridaceae (e.g. Cyrtomium). f Bulliform, Poaceae. g Tabular. h Shield cf. Solanaceae. i Saddle, short, Chloridoideae. j Tabular scrobiculate. k Tabular strangulated cf. Salvadora. l Tabular sinuate from woody dicot. m Blocky from woody dicot. n Left. Clavate from woody dicot. Right. Upper: globular echinate, Arecaceae. Middle: Tower, Poaceae. Bottom: Bilobate, long, convex, Poaceae. o Asteraceae pollen from Upper Bed I, immediately underneath the Ng’eju Tuff. Pollen concentration = 2649; C3 Ret. Lamiaceae/Convolvulaceae, 101; Asteraceae, 72; Rutaceae, 2. All scale bars = 25 µm. .
Fig. 7
Fig. 7. Plant wax biomarkers.
a Plant landscape reconstruction using δ13C of the weighted mean average of the C27–C33 n-alkanes. A sine-squared mixing model with end-member values of −30‰ (for pure C3) and −19‰ (for pure C4) was used to visualize plant ecology during sample deposition. The δ13C of n-alkanes vary between −29‰ and −39‰ in extant C3 plants and −14‰ and −26‰ in C4 vegetation. VPDB Vienna Pee-Dee Belemnite. bf Graphs show relative abundance of each n-alkane compound (grey bars), their δ13C values (black circles), and average chain length (ACL) of C25–C35 carbon homologue. Roman numerals indicate provenance in the stratigraphic column from bottom to top, and these are individual samples, not composite. The placement of each sample along the soil/plant gradient is based on the obtained weighted average for each sample.
Fig. 8
Fig. 8. Stable carbon (δ13C) and oxygen (δ18O) measurements of animal teeth from Ewass Oldupa (below Tuff IA) compared to contemporaneous and younger fossil datasets,.
A Mann–Whitney–Wilcoxon test shows significant difference in δ13C [W = 215, <0.05(0.004)]. There is also δ18O distinction: [W = 92, <0.05(0.000)]. Overall, the results suggest that the period 2.0–1.9 Ma was wetter than 1.8–1.6 Ma. Note: only data from the same families of taxa have been included in the comparison.

References

    1. Toth N, Schick K. An overview of the cognitive implications of the Oldowan Industrial Complex. Azania. 2018;53:3–39. doi: 10.1080/0067270X.2018.1439558. - DOI
    1. Pobiner BL, Rogers MJ, Monahan CM, Harris JW. New evidence for hominin carcass processing strategies at 1.5Ma, Koobi Fora, Kenya. J. Hum. Evol. 2008;55:103–130. doi: 10.1016/j.jhevol.2008.02.001. - DOI - PubMed
    1. Domínguez Rodrigo M. Meat eating by early hominids at the FLK 22 Zinjanthropus site, Olduvai Gorge, Tanzania: an experimental approach using cut mark data. J. Hum. Evol. 1997;33:669–690. doi: 10.1006/jhev.1997.0161. - DOI - PubMed
    1. Sahnouni M, et al. 1.9-million- and 2.4-million-year-old artefacts and stone tool-cutmarked bones from Ain Boucherit, Algeria. Science. 2018;362:1297–1301. doi: 10.1126/science.aau0008. - DOI - PubMed
    1. Ferraro JV, et al. Earliest archaeological evidence of persistent hominin carnivory. PLoS One. 2013;8:e62174. doi: 10.1371/journal.pone.0062174. - DOI - PMC - PubMed

Publication types

LinkOut - more resources