. 2021 Jan 7;12(1):356.
doi: 10.1038/s41467-020-20742-8.

Optimal COVID-19 quarantine and testing strategies

Affiliations

Optimal COVID-19 quarantine and testing strategies

Chad R Wells et al. Nat Commun. .

Abstract

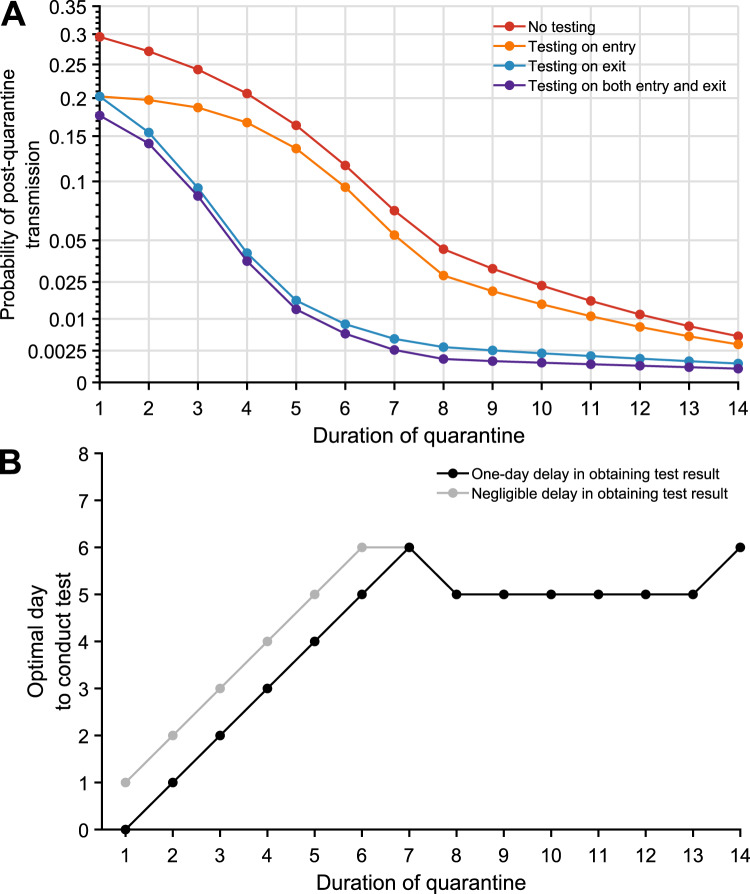
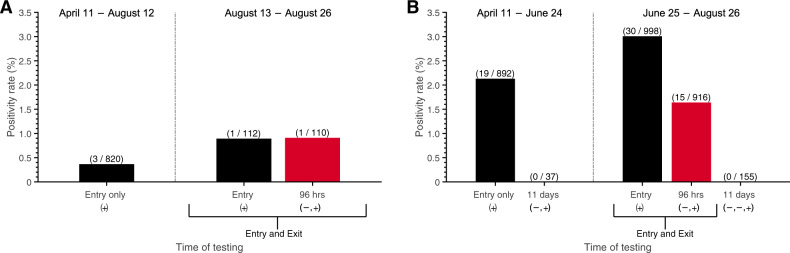
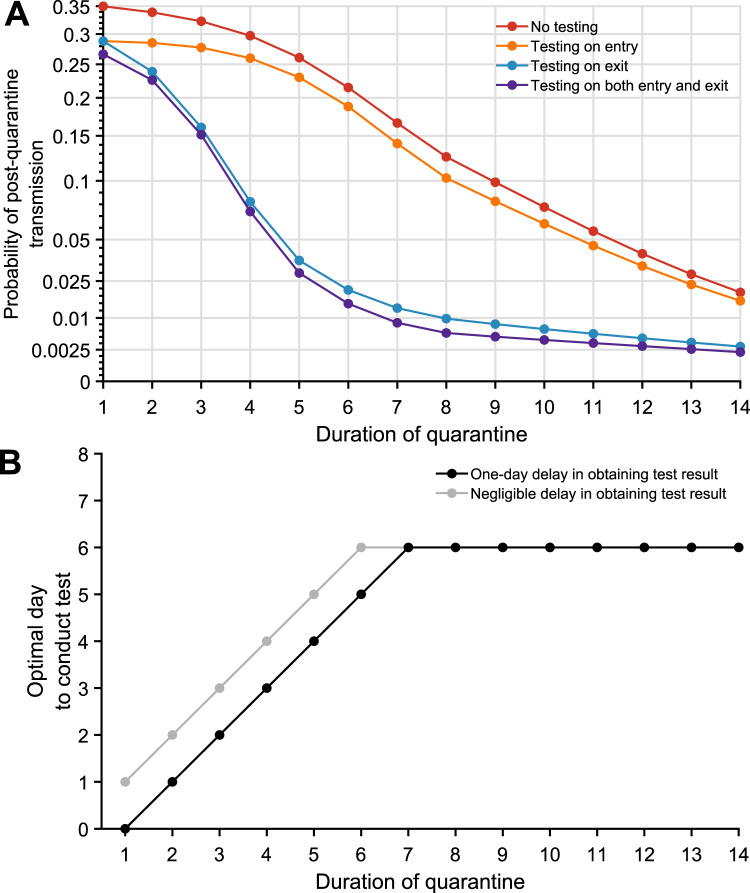
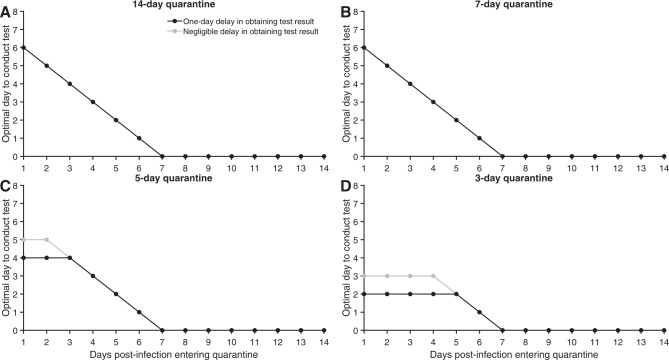
For COVID-19, it is vital to understand if quarantines shorter than 14 days can be equally effective with judiciously deployed testing. Here, we develop a mathematical model that quantifies the probability of post-quarantine transmission incorporating testing into travel quarantine, quarantine of traced contacts with an unknown time of infection, and quarantine of cases with a known time of exposure. We find that testing on exit (or entry and exit) can reduce the duration of a 14-day quarantine by 50%, while testing on entry shortens quarantine by at most one day. In a real-world test of our theory applied to offshore oil rig employees, 47 positives were obtained with testing on entry and exit to quarantine, of which 16 had tested negative at entry; preventing an expected nine offshore transmission events that each could have led to outbreaks. We show that appropriately timed testing can make shorter quarantines effective.


Conflict of interest statement

J.P.T., S.M.M., G.K., B.S., R.M., and A.P.G. declare the following competing interests: received funding from the oil and gas company who collected the data. C.R.W., A.P., and M.C.F. declare no competing interest.

Figures

Fig. 1
Fig. 1. The impact of testing on the post-quarantine transmission for travel quarantine.
The probability of post-quarantine transmission and optimal day to conduct the test when an infected individual enters quarantine uniformly within the incubation or asymptomatic period, for no testing and three testing strategies, and durations of quarantine from 1 to 14 days, with an incubation period of 8.29 days, 30.8% asymptomatic infections and perfect self-isolation of symptomatic infections. A Curves for the probability of post-quarantine transmission (one or more post-quarantine infections) without testing (red), with testing upon entry to quarantine (orange), on exit from quarantine (blue), and on both entry to and exit from quarantine (purple), incorporating with all testing strategies a one-day delay in sample collection to results, such that testing on exit occurred the day before the end of quarantine. B The optimal day to test during quarantine with a 1-day delay (black) and a negligible delay (gray) in obtaining test results.
Fig. 2
Fig. 2. Positivity rates for testing on entry to and exit from quarantine.
SARS-CoV-2 testing and positivity rate between April 11 to August 26, 2020, within two regions where crew members were quarantined: A region A, with a 7-day quarantine, where testing on entry (black) and exit (red) was started on August 13, and B region B, with a 5-day quarantine, where testing on entry (black) and exit (red) was started on June 25. Initially, a 3-day quarantine with testing only on entry was conducted in both regions. The vertical dashed line separates the early strategy of testing on only entry (left) and the later strategy of testing on both entry and exit (right), including follow-up post-quarantine tests conducted 11 days after the initial test (i.e., on day 12). Negative and positive sequential symbols − and + indicate the test histories. In these results, negative symbols are always conveying results to tests that were previous to the results quantified by the bar above. The number of positive tests (numerator) and the number of tests conducted (denominator) is denoted above the bar in parentheses.
Fig. 3
Fig. 3. The impact of testing on the post-quarantine transmission for traced contacts.
The probability of post-quarantine transmission for no testing and three testing strategies applied to 1–14-day durations of quarantine, when an individual enters quarantine through contact tracing, specifying an incubation period of 8.29 days, 30.8% asymptomatic infections, and perfect self-isolation of symptomatic infections. A Curves for the probability of post-quarantine transmission (one or more post-quarantine infections) without testing (red), with testing upon entry to quarantine (orange), on exit from quarantine (blue), and on both entry to and exit from quarantine (purple), incorporating with all testing strategies a 1-day delay in sample collection to results, such that testing on exit occurred the day before the end of quarantine. B The optimal day to test during quarantine for a specified quarantine duration, with a 1-day delay (black) and with a negligible delay (gray) in obtaining test results.
Fig. 4
Fig. 4. Optimal testing day for a known time of exposure.
For a case whose date of exposure has been identified as occurring 1–14 days prior to quarantine, the optimal day to conduct the RT-PCR test with a 1-day delay (black) and with a negligible delay (gray) in obtaining test results, assuming perfect self-isolation of symptomatic infections, 30.8% asymptomatic infections, an incubation period of 8.29 days, and a quarantine lasting A 14 days, B 7 days, C 5 days, and D 3 days.

Update of

References

    1. Nicola M, et al. The socio-economic implications of the coronavirus pandemic (COVID-19): a review. Int. J. Surg. 2020;78:185–193. doi: 10.1016/j.ijsu.2020.04.018. - DOI - PMC - PubMed
    1. Martin A, Markhvida M, Hallegatte S, Walsh B. Socio-economic impacts of COVID-19 on household consumption and poverty. Econ. Disaster Clim. Change. 2020;4:453–479. doi: 10.1007/s41885-020-00070-3. - DOI - PMC - PubMed
    1. Lee, J. C., Mervosh, S., Avila, Y., Harvey, B. & Matthews, A. L. See How All 50 States Are Reopening (and Closing Again). (The New York Times, 2020).
    1. Aleta A, et al. Modelling the impact of testing, contact tracing and household quarantine on second waves of COVID-19. Nat. Hum. Behav. 2020;4:964–971. doi: 10.1038/s41562-020-0931-9. - DOI - PMC - PubMed
    1. Centers for Disease Control and Prevention. When to Quarantine. CDChttps://www.cdc.gov/coronavirus/2019-ncov/if-you-are-sick/quarantine.html (2020).

Publication types